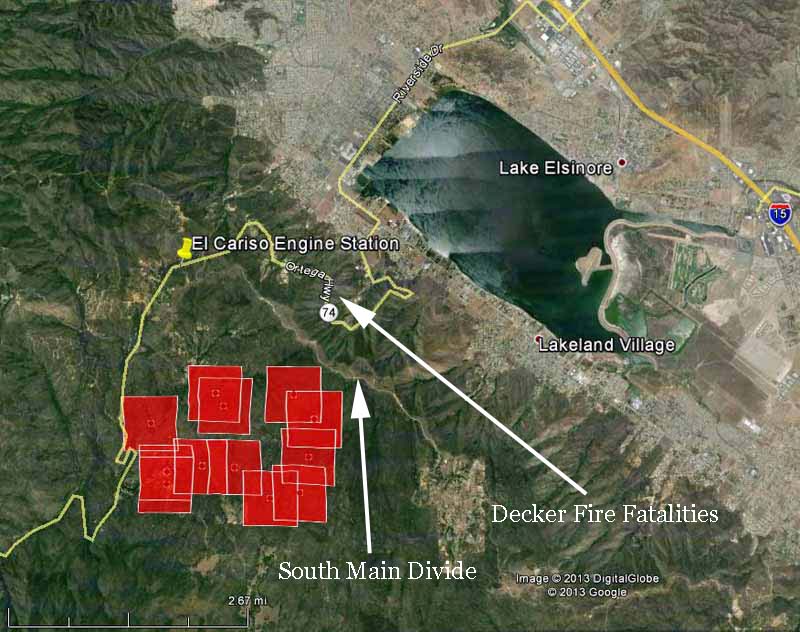
Higher resolution imagery becoming available from satellites will enable more accurate mapping and spread prediction of wildfires. Since we created Wildfire Today in 2008 we have frequently displayed maps showing fire data collected by the Moderate-resolution Imaging Spectroradiometer (MODIS) instrument package, such as the one below of the Falls Fire near Elsinore, California in August. The red squares represent heat detected by MODIS before the fire spread east across the South Main Divide and down through the bowl where the Decker Fire fatalities occurred in 1959. Click on the image to see a larger version.

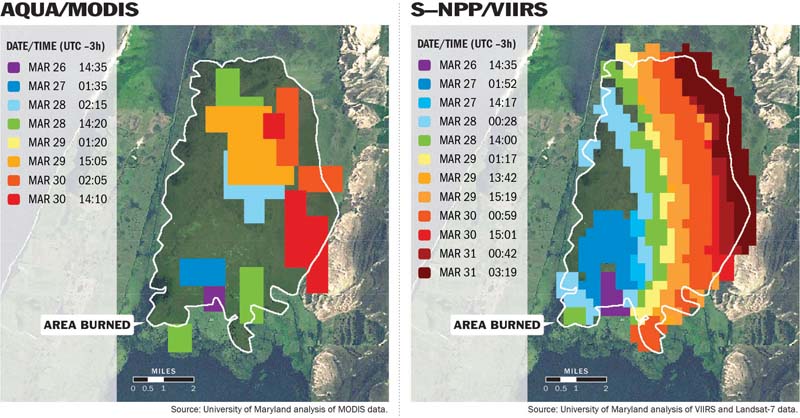
MODIS, launched in 1999 with its 1,000-meter resolution system, is starting to show its age. Better technology is now available and is orbiting 512 miles above the Earth on the Suomi National Polar-orbiting Partnership (Suomi NPP) satellite launched October 28, 2011 . The Visible Infrared Imaging Radiometer Suite (VIIRS) on the satellite is a 22-band radiometer designed to collect infrared and visible light data to observe wildfires, movement of ice, and changes in landforms. It has a resolution of 375 meters, much better than the MODIS. The new Landsat 8 satellite launched in February has a resolution of 30 meters for most of its sensors, and 100 meters for thermal infrared. This will be a game changer. In March we published a test image of the Galena Fire taken with Landsat 8.
Below is a comparison of data from MODIS and VIIRS. Click on it to see a larger version.

Last month we told you about a proposed satellite, called FUEGO – Fire Urgency Estimator in Geosynchronous Orbit, which would survey the entire western United States every two minutes or less and could detect a fire that is about 10 feet in diameter. Assuming that the data from the satellite could be transmitted to the appropriate dispatch center within a minute or two, this could be a major step toward keeping fires small… IF the fire agencies have the appropriate initial attack policies in place and an adequate number of firefighting resources, both ground and air-based, to respond and arrive at the fire within the first 10 to 30 minutes. But since the cost of the satellite could be several hundred million dollars, it probably will never be built or launched.
Two scientists who have been working with some of the new data that is available now are Janice Coen of the National Center for Atmospheric Research in Boulder, Colorado, and Wilfrid Schroeder with the Department of Geographical Sciences, University of Maryland. They intend to transition the new refined spatial resolution VIIRS and Landsat-8 fire detection data and a new weather forecast-fire spread model into operations in the next two to three years. Mr. Schroeder told us that some of the higher resolution data should replace the MODIS data on the GEOMAC website in the next one to two months. In the meantime you can see some early versions of it on an experimental basis at a website they created.
The two of them recently published a paper documenting the development of a new wildfire spread model (think newer version of BEHAVE) that, coupled with high resolution numerical weather prediction and the actual location of a fire as detected by the 375-meter resolution VIIRS, predicts the fire behavior and spread of a fire, displaying it on a map. The model can be run after the overflights of the satellite every 12 hours using updated weather forecast information and the current location of the fire.
Their paper is HERE, and a description of the concept written by Ms. Coen is below.
****
Recent studies have applied models that couple numerical weather prediction (NWP) (i.e. weather forecast) models with components that model wildland fire behavior to simulate the evolution of landscape-scale wildfires. These models simulate weather at very high resolution (with grid spacing of a few hundred meters, compared to the several kilometers between grid points in routine weather forecasts), the winds and humidity of which direct where a fire goes and how fast. As the simulated fire consumes fuel, it releases heat and gaseous water into the air, which creates ‘fire winds’ that in turn affect fire behavior – i.e. the fire ‘creates its own weather’. These models have shown that the unfolding of fire events is largely predictable – capturing not only the operationally-important rate of spread of the heading region, but the shape of the fire perimeter, where it will split into multiple heading regions and possibly rejoin, where flank runs are produced, and fire phenomena that may impact safety by producing rapidly changing fire behavior – where fire whirls and horizontal roll vortices may produce locally rapid fire spread and blowups, where fuels, terrain, and wind (including winds produced by the fire) combine to rapidly increase fire spread.
While including NWP models has dramatically increased the realism of these models in recreating and understanding what happened in past wildland fire events, it introduces other challenges. Once it starts running, a weather forecast model’s skill (an objective assessment of how accurate it is) decreases with time because of unavoidable errors that arise from incompleteness or inaccuracies in the state of the atmosphere the model started with or imperfections in relationships that describe the physical processes in the model. These errors grow with time, and although these make the predictions of coarse continental or global models not useful after a week or two, the skill at producing fine-scale features decreases even more rapidly, making it hard to accurately predict when and where a cloud will form even a few hours ahead of time. The particular challenge when applying it to model the lifecycle of a wildfire is that a lightning strike may smolder for several days before beginning to grow when dry, windy conditions arrive. A forecast that models the fire from ignition would have lost most of the accuracy in the weather before fire growth even starts. Also, fires can have lulls in growth for several days, followed by active fire growth in later periods. This makes continuously predicting the growth of a wildfire, which may last for weeks or months, very challenging.
Taking advantage of new satellite-based fire detection data, this work addresses how such coupled NWP-wildland fire models can be used to accurately predict the evolution of a wildfire throughout its lifetime. The VIIRS instument (details in the paper, more information is probably best obtained from Wilfrid Schroeder, wilfrid.schroeder@noaa.gov) has been returning data for about 1.5 yrs while the algorithms that can accurately identify the burning areas while minimizing false alarms were being developed (the data is only beginning to be released). The paper describes three weather simulations started at the same time and run for a little more than 1.5 days. In the first simulation, the fire was ignited with a perimeter given by the fire extent from the active fire detection product the first time it was detected (4 days after the lightning strike, it was only 2km in diameter) and run for 1.5 days. In a second simulation, the fire was ignited in the same weather simulation 12 h later using the fire extent from the next VIIRS pass and run until the same time a day later. The third simulation initialized the fire extent using the 3rd VIIRS fire detection perimeter and ran for 12 h, until the same time as the other simulations. We found that the coupled model, using a fire detection map, reproduced the fire growth, extent, shape, splitting and merging as the actual fire, and was accurate for about 12-24 h before the errors in simulated fire growth and weather became significant. This is significant, because by that time, a simulation using a more recent fire map would be available and would accurately simulate the next 12-24 h. Also, each subsequent simulation greatly reduced the errors compared to the ‘prediction’ one would get from simply extending the prior simulation through the same period. This method also gets us past other sources of possible error – that crews would do large burnouts that aren’t accounted for in the fire behavior physics or if long-distance spotting played a large role by creating new fires (which would be difficult to model deterministically – which of many spots would survive and specifically which ones would pick up and where).

