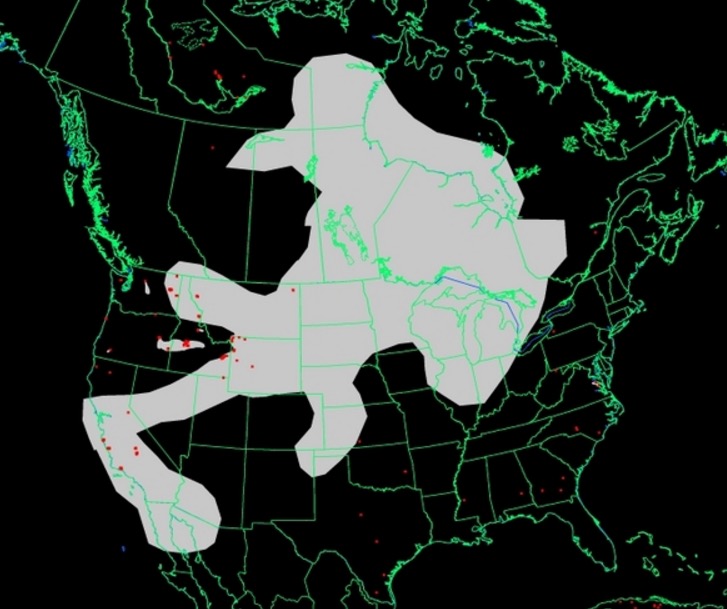
Smoke from wildfires is affecting a large portion of the United States and Canada.
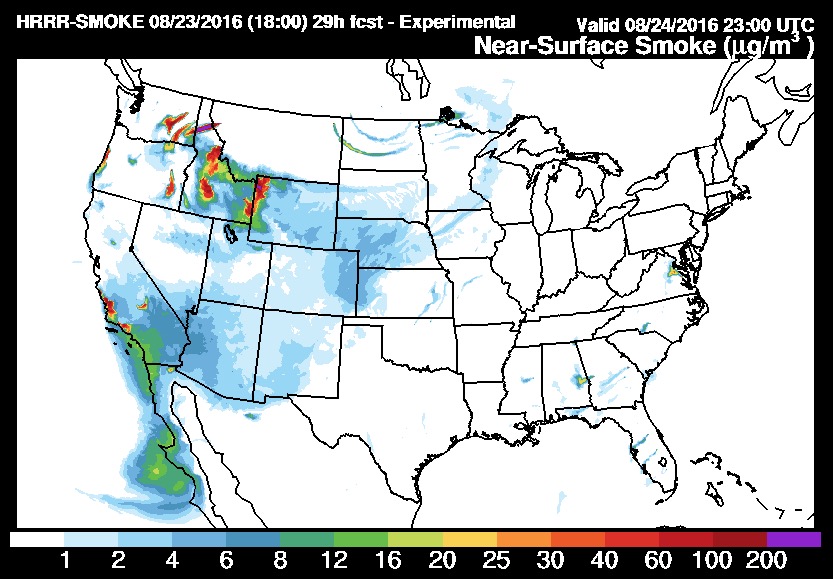
The map below is an experimental forecast for wildfire smoke at 5 p.m. MDT Wednesday, August 24.

News and opinion about wildland fire

Smoke from wildfires is affecting a large portion of the United States and Canada.
The map below is an experimental forecast for wildfire smoke at 5 p.m. MDT Wednesday, August 24.

Comments are closed.
Another smoke mapping site is http://www.airfire.org/bluesky/. It’s more of a research tool than something the general public can readily use.
A weather forecasting site for fire weather (FireBuster) is at http://45.25.216.103/firebuster/about.html.
Hi Bill, I have weather underground and I used the smoke map extensively last year during the forest fire season but now I can’t find it on the app. I saw that you recently posted one of those maps and I wondered how you get to it?
Helen… Weatherunderground blew up their map page, started over, and they are adding some of the original functionality piece by piece. I don’t know if they are going to restore the smoke map. In the meantime, the only smoke map I am aware of is this from NOAA. And it’s very crude compared to the WU map.
There’s also the experimental smoke forecast map. It’s rather cumbersome to use.
Our office (NOAA/NESDIS Satellite Analysis Branch) generates the jpg graphic that is shown (red dots for fires, smoke is gray) for North America. The jpg is just meant to be a quick overview giving the big picture. The link that Bill provides is to our main web page. From the top of the page you can select to view the fire/smoke in google earth or if you have a GIS system you can download the shapefiles to display on your system. Either of these give you more flexibility to zoom in to an area. The smoke is also depicted as individual plumes with an approximate density for each plume and times associated with them All of the smoke that we include is hand drawn by an analyst using satellite imagery. Hope this is helpful. If you have any questions about any of it please contact me.
Thanks Mark. But, could you give us a link “to view the fire/smoke in google earth”?
Hi Bill. Sorry for the delayed reply. I was out of the country for a couple of weeks. The link: http://www.ospo.noaa.gov/data/land/fire/fire.kml will display the latest HMS fire analysis in google earth and http://www.ospo.noaa.gov/data/land/fire/smoke.kml will do the same for the smoke analysis. There is usually a lag of a few hours, especially in the afternoon and evening, as it takes time for the analysts to review all of the imagery that is coming in and perform the analysis. You can also go to: ftp://satepsanone.nesdis.noaa.gov/FIRE/HMS/KML/ to view previous days analysis.