Researchers study factors that affect long-distance spotting of wildfires

The results could lead to more accurate models for spotting and fire behavior

map spot fires wildfire Australia
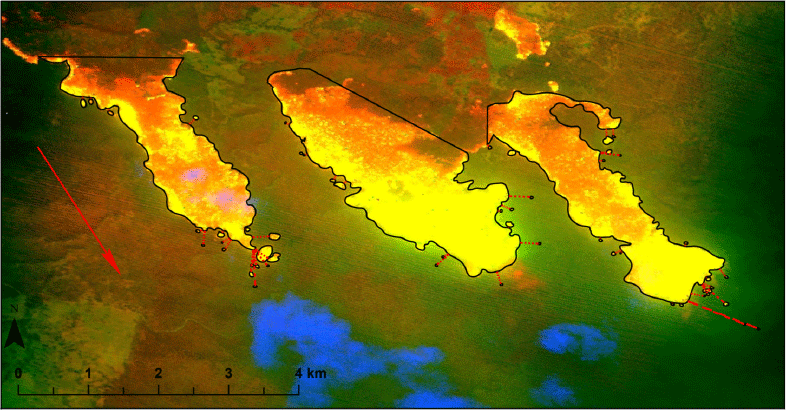
New South Wales Rural Fire Service line scan showing three separate source fires (three largest polygons). Most actively burning fire is yellow, orange is still hot after main fire front has passed, brown is extinguished, green is unburnt vegetation, blue is part of the smoke plume. Red dotted lines indicate spot fire (small polygons) distances measured for analysis. Red arrow indicates spread direction. (from the research)

Data collected in an Australian study could lead to the development of more accurate predictive models for wildfire behavior and spotting, especially for extreme wildfires.

Burning embers driven ahead of a wildfire can dramatically increase the rate of spread and the danger faced by firefighters and the public. Under moderate burning conditions a small number of spot fires might be suppressed if enough firefighting resources are available, but on large plume-dominated fires pushed by strong winds spot fires far from the  main fire can burn together making suppression at the head of the fire impossible. In many cases ember showers have been the primary ignition source for the destruction of structures in the wildland urban interface.

During the 2009 Black Saturday bushfires in eucalpyt-dominated forests in Australia the maximum spot fire distances were 30 to 35 km (18 to 22 miles) and during the 1965 wildfires in eastern Victoria were 29 km (18 miles). Spot fires in North America have been documented at distances of up to 19 km (12 miles).

A research paper on spotting distance in Victoria and New South Wales was published earlier this week by the International Journal of Wildland Fire, written by Michael A. Storey, Owen F. Price, Jason J. Sharples, and Ross A. Bradstock, titled “Drivers of long-distance spotting during wildfires in south-eastern Australia.”

The researchers took advantage of the increasing use of airborne mapping technologies on wildfires in Australia, including infrared and multispectral line scanning, to analyze data from 338 observations. (See map above.) They used ArcGIS to manually draw polygons and determine the size of the actively burning areas of the fire, which they called “source fire area”, and measured the distance to spot fires and the size of each. They also collected fuels, weather, and topography information.

Below is an excerpt from the research:

Maximum spot fire distances ranged from 5.0 m to 13.9 km (mean, 0.9 km; 95th percentile, 3.9 km). The mean number of spot fires per source fire (irrespective of distance) was 13. The distribution of maximum distance values appeared exponential, with a high proportion of shorter distances (Fig. 4a). Very long-distance spotting was rare; only 11 source fires had a maximum spotting distance >5 km.

maximum spot fire distances
Frequency distribution histograms of (a) maximum spot fire distance values from each source fire and (b) number of long-distance spot fire (>500 m) values from each source fire. (from the research)

Eleven of the fires had spotting distances more than 5 km (3.1 miles). The longest distance measured to a spot fire was 13.9 km (8.6 miles).

The analysis of 338 wildfire line scan observations found the size of the active area of the source fire to be the strongest predictor of long-distance spotting. Important secondary effects were fuel, weather, and topography.

Excerpts:

Wind speed was important to both Maximum-distance and long-distance Spot-number. Upper-level wind speed had weaker but still significant effects in the models. Wind at different levels can influence many aspects of wildfire behaviour, including plume development, plume turbulence and tilt, fire intensity, vorticity development, firebrand transport and ignition likelihood in receiver fuels.

A steep slope somewhere within the source fire (i.e. source fire max. slope) increased the maximum spot fire distance and the probability of spot fire occurrence >500 m. TRI [Terrain Ruggedness Index] performed similarly but was highly correlated with slope (>0.9), so was not included in the same models. An area of relatively high wind exposure (e.g. exposed ridge) also increased maximum spotting distance. Slope and wind exposure may be important through interactions with wind, changing wind speed, increasing turbulence and potentially enhancing pyroconvection, leading to enhanced firebrand generation and transport.

[W]e did not find a commonly used measure of bark spotting potential to be a significant predictor. Our results suggest that to accurately predict long-distance spotting, models must incorporate a measure of source fire area. Gathering data on spotting and plume development at wildfires over a range of intensities (including measuring intensity and frequent line scans) and improving fuel maps should be prioritised to allow for the development of reliable predictive spotting models.

The fibrous or stringy bark on some eucalyptus species is particularly suited aerodynamically for being lofted in a convection column and traveling for long distances while still burning, and is one of the primary ignition sources for long range spotting in Australia. The bark on North American trees is different, but the methods used by the Australian researchers could be used to collect similar spot fire occurrence data in the United States and Canada which could lead to improved spotting and fire behavior models.

Fourth grader needs suggestions for wildfire demonstration

Let’s also come up with ideas for gatherings of adults

demonstration of pyrolysis
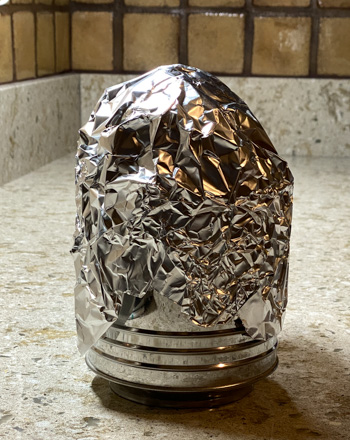
Apparatus for demonstration of pyrolysis, used back in the day.

Today I received a message from a mom who needs our help:

Hi-

My son chose the topic of wildfires for his project on natural disasters. We’re having a hard time thinking of a demonstration that’s safe for his classroom. Do you have any suggestions?

Thank you.

So, I’ll put this out there for our readers. Can you help out this fourth grader that has an interest in wildfires? The young man needs to choose a demonstration this week. Leave a comment with your ideas.

The tricky part is coming up with something that will be safe to do in a classroom full of 10-year olds.

The first thing that came into my mind was a demonstration of pyrolysis, the process of combustion of vegetation. Before canned training was developed for entry level wildland firefighters, we wrote lesson plans and stood before the new hires and taught them about fire behavior, line construction, weather, and fire science. At least that’s the way we did it on the El Cariso Hotshots.

One demonstration I used that would not be safe for a fourth grader without adult supervison, was pyrolysis; showing them that when wood or vegetation is consumed in a fire, it’s actually a gas that is burning. It would be best to do this outside in an area cleared of flammable material. Stuff a coffee can with some sawdust or dried vegetation (grass or brush). Take aluminum foil and form it into an upside down funnel and place it around the top of the can, making it as air-tight as possible (similar to the photo above). Then make a hole a little smaller in diameter than a pencil at the top of the foil. Place the can on a heat source, such as a stove, and wait until a steady stream of smoke comes out of the hole at the top. Then hold a long butane lighter used for igniting a BBQ grill adjacent to the smoke and watch the gas burn. A version of this is described on YouTube.

Another demonstration that absolutely would not be suitable for a fourth grader is something we wrote about in 2008:


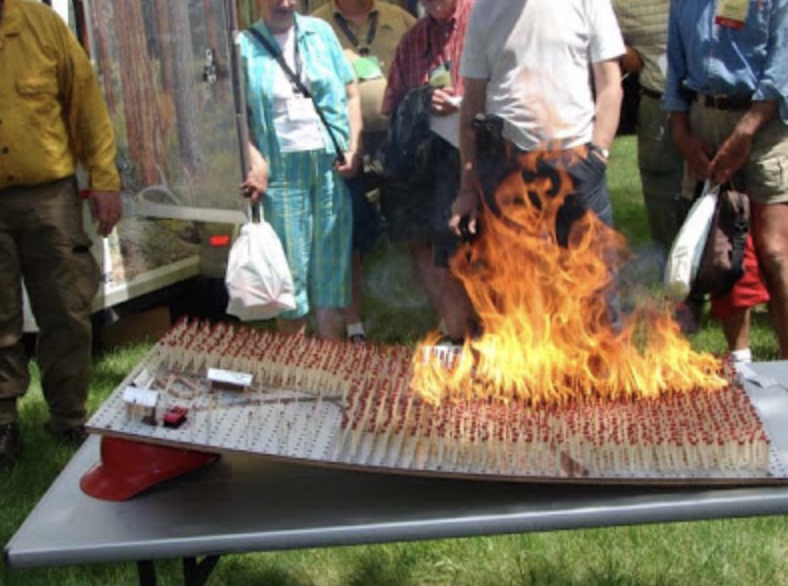
Everybody at some point has played with matches. Mike Dannenberg of the Bureau of Land Management, a fire suppression supervisor in Montana and the Dakotas, puts on a presentation about residential fire preparedness that involves hundreds of matches. The article at wvmetronews.com has more details as well as a series of photos. Here is an excerpt.

“I liken it to building in a flood plain,” said Dannenberg. “If you thin around your house, if you reduce the fuel load, if you build out of materials that are not combustible a lot of times it will protect your home.”

Demonstration fire slope clearance
Demonstration of fire on a slope, and how a clearance around structures can be effective..

Dannenberg has created a demonstration model to show the intensity of a canopy fire. He loads a pegboard with hundreds of match sticks. Each match represents a highly combustible evergreen tree. A road snakes through the middle of the model forest. The upper corner of the board features a homestead with a house, garage, and various outbuildings. The scene is created to the specs recommended by the BLM. Each building is covered with a metal roof and the yard space has only sparse and wide spaced trees.

Dannenberg tilts the board to replicate the speed of a fire moving up the slope of a hill or mountain. He lights a single match at the far end of the pegboard and at the foot of the simulated hill. The fire spreads rapidly, but stops short of the home–leaving it untouched. It’s an effective demonstration that Dannenberg says plays itself out every summer in the western United States.


UPDATE, February 24, 2020: 

There are some good ideas in the comments. Keep them coming. Like the one above (the matches on the peg board) some of them are not appropriate for fourth-graders, but somebody somewhere might find them useful at another venue. So think about gatherings of adults as well.

Fire whirl, or waterspout, or fire tornado?

Spectacular video at a fire near Blythe, California

Above: screenshot from the video below.

Chris Mackie posted this video on July 15, 2018 of spectacular fire behavior at a wildfire on the Arizona side of the Colorado River near Blythe, California. It is not uncommon to see dust devils and fire whirls during unstable weather conditions on a fire, but as you can see beginning at about 1:10 the rotating vortex over this fire intensifies into what some might call a fire tornado (or “firenado”) as trees are uprooted and debris is thrown into the water as it moves over the river (and transforms into a waterspout?).

We have written about similar phenomenons several times on Wildfire Today. Here is an excerpt from a 2016 article, “Defining fire whirls and fire tornados”:


“The news media sometimes calls any little fire whirl a “fire tornado, or even a “firenado”. We found out today that these and related terms (except for “firenado”) were, if not founded, at least documented and defined in 1978 by a researcher for the National Weather Service in Missoula, David W. Goens. He grouped fire whirls into four classes:

  1. Fire Devils. They are a natural part of fire turbulence with little influence on fire behavior or spread. They are usually on the order of 3 to 33 feet in diameter and have rotational velocities less than 22 MPH.
  2. Fire Whirls. A meld of the fire, topograph, and meteorological factors. These play a significant role in fire spread and hazard to control personnel. The average size of this class is usually 33 to 100 feet, with rotational velocities of 22 to 67 MPH.
  3. Fire Tornadoes. These systems begin to dominate the large scale fire dynamics. They lead to extreme hazard and control problems. In size, they average 100 to 1,000 feet in diameter and have rotational velocities up to 90 MPH.
  4. Fire Storm. Fire behavior is extremely violent. Diameters have been observed to be from 1,000 to 10,000 feet and winds estimated in excess of 110 MPH. This is a rare phenomenon and hopefully one that is so unlikely in the forest environment that it can be disregarded.”

A new app to predict wildland fire behavior

Wildfire Analyst Pocket appTechnosylva has released a new free app for smart phones that can help predict fire behavior. It is called Wildfire Analyst Pocket and is available for Android phones. It will soon be on the Apple app store as well.

In a video filmed May 21, 2018, the president of the company, Joaquin Ramirez, introduces us to the app.

Technosylva is one of the companies that produce systems available now that could lead toward the Holy Grail of Wildland Firefighter Safety, tracking in real time the location of firefighters and a wildfire.

A chance to study vortices in a smoke plume

Above: screenshot from the Wall Fire time-lapse video below.

This time-lapse video of the Wall Fire condenses one hour of high intensity fire behavior into a one minute video. It was photographed using the camera system operated by the Nevada Seismological Lab between 7 p.m. and 8 p.m. on July 8, 2017, the day after the fire started. Since then it has burned 5,800 acres and destroyed 41 homes and 55 other structures southeast of Oroville, California.

If you are interested in wildland fire behavior, you may be fascinated by the occasionally counter-rotating as well as single horizontal and vertical vortices as the fire rapidly spreads across the landscape.

This phenomenon is important to firefighters because of the extreme fire behavior that can put personnel in immediate danger.

If you want to read more about horizontal vortices, here are the results of a quick Google search. One of the links leads to an interesting paper titled Three Types of Horizontal Vortices Observed in Wildland Mass and Crown Fires, by Donald A. Haines and Mahlon C. Smith.

Here is a copy of their abstract (click it to see a larger version):

Thanks and a tip of the hat go out to Kelly.
Typos or errors, report them HERE.

Caifornia Fuels and Fire Behavior Advisory

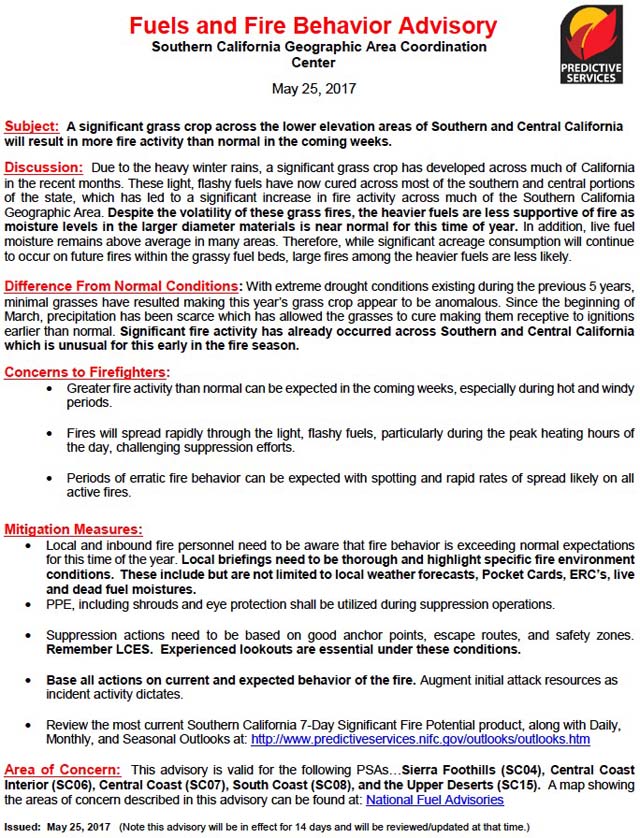
The Southern California Geographic Area Coordination Center has issued a Fuels and Fire Behavior Advisory for the central and southern areas of California due to a heavier than usual grass crop brought on by above average winter rains. Because of the vegetation and climate in Southern California it seems like we hear similar warnings often — heavy rains bring lots of flashy grass fuels, and a dry winter results in low fuel moistures. An average winter can mean typical fire potential, which in this area can still mean large devastating wildfires. But as we often say, the most important factor that affects the number of acres burned is the weather during the fire season.

Below is an excerpt from the Advisory. Following that is the entire document.

****

“Due to the heavy winter rains, a significant grass crop has developed across much of California in the recent months. These light, flashy fuels have now cured across most of the southern and central portions of the state, which has led to a significant increase in fire activity across much of the Southern California Geographic Area. Despite the volatility of these grass fires, the heavier fuels are less supportive of fire as moisture levels in the larger diameter materials is near normal for this time of year. In addition, live fuel moisture remains above average in many areas. Therefore, while significant acreage consumption will continue to occur on future fires within the grassy fuel beds, large fires among the heavier fuels are less likely.”

Fuels And Fire Behavior Advisory SoCal

Thanks and a tip of the hat go out to Ken.
Typos or errors, report them HERE.