Winter task for U.S. and Australia wildfire agencies: create a common operating picture

One source for informing the public and gathering information about mitigating the emergencies, providing relief, managing transportation corridors, electrical power grids, and evacuations

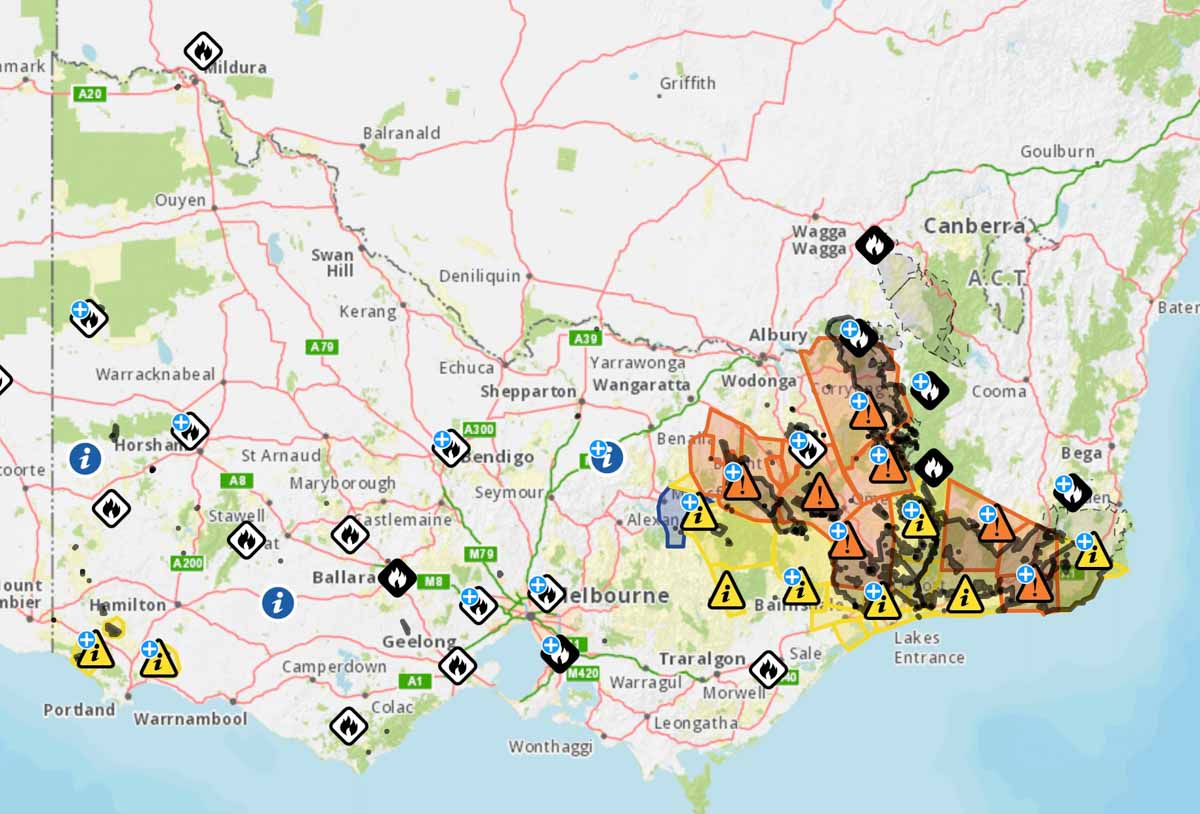
fire map Victoria
Map from Emergency Management Victoria, January 6, 2020.

After the 2019-2020 southern hemisphere bushfire season, emergency management personnel in both the United States and Australia should take the opportunity to evaluate the fire season and determine if there is a better way of distributing information to the public and emergency management agencies.  In neither country is there one key source for information where the public, the media, and the responsible agencies can quickly and efficiently obtain important real-time intelligence and predictive models that they need to make decisions about informing the public, mitigating the emergencies, providing relief, managing transportation corridors, and gathering information about electrical power grids and evacuations.

The military calls this information source a common operating picture (COP).

All of this information is available at hundreds if not thousands of sources, but not everyone that could benefit from the data have access. It needs to be pulled together for safety and efficiency.

In the United States if a citizen needs current information about a wildfire how do they get it? From the county sheriff, local fire department, or a county, state, or federal agency? It makes a difference about where to look if the fire is on federal land, state protected land,  city, county, national or state park. They can try social media, but which application and which account? InciWeb sometimes has information about wildfires managed by federal agencies, but not all. And since law enforcement is responsible for evacuation, InciWeb does not always have current information about the status of evacuations. Information on the website about individual fires may not have been updated for 12 to 18 hours, however some incident management teams are better than others. And InciWeb rarely provides projections of fire spread in a timely manner, if at all. When someone is threatened by a rapidly spreading wildfire they don’t have time to randomly check an alphabet soup of acronyms on dozens of web sites or social media accounts, even if they know the names, handles, or web addresses.

A COP would need to have a sign-in option that would make it possible for authorized personnel to see detailed data that should not be distributed to the whole world, such as exact locations of resources.

Below are examples of fire location information in Australia on January 6, 2020 United States time, in addition to the Victoria map at the top of the page.
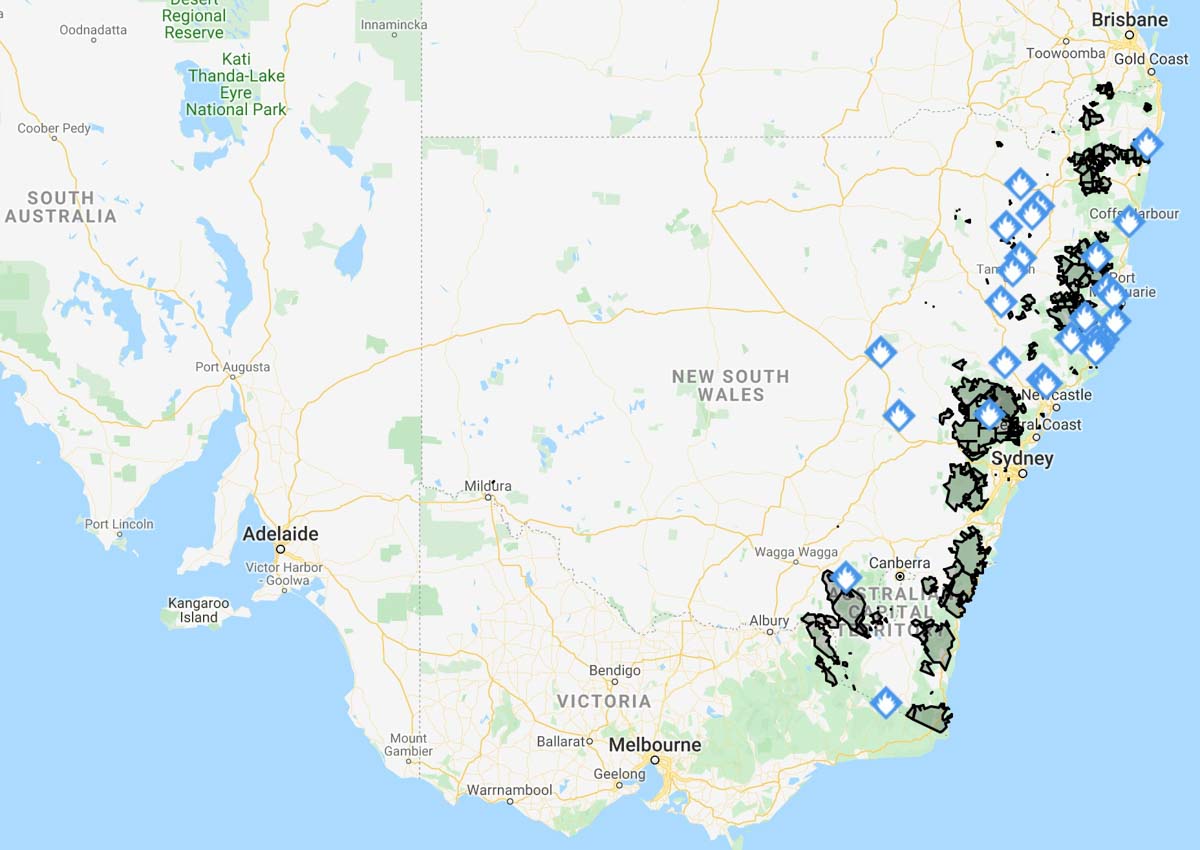
Map New South Wales Rural Fire Service fires
Map from the New South Wales Rural Fire Service showing fires that are at the “Advice” level, meaning “A fire has started. There is no immediate danger. Stay up to date in case the situation changes.”
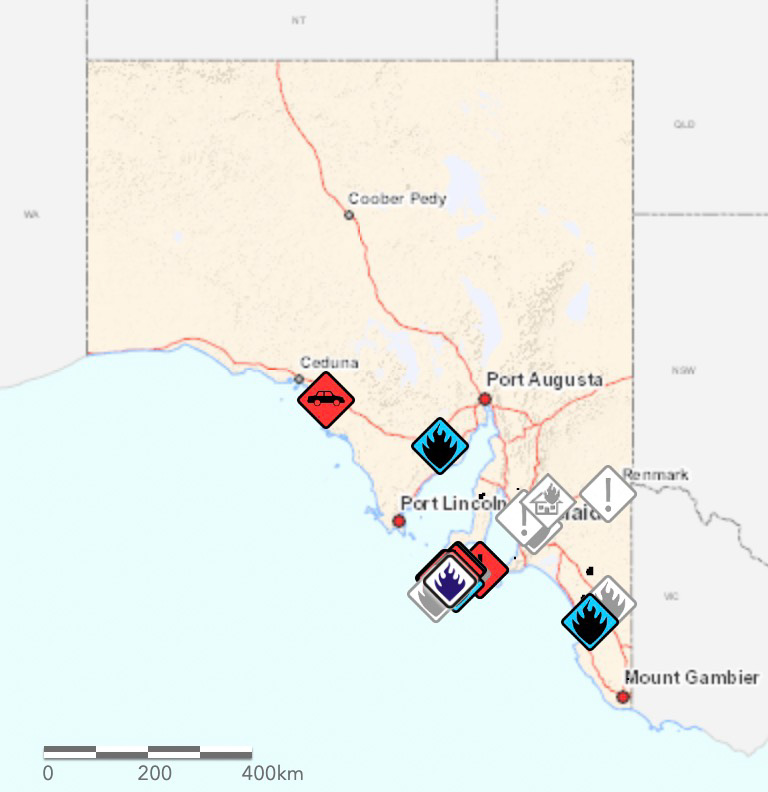
Map in South Australia
Map of fires in South Australia January 6, 2019. From SA Country Fire Service.

The maps produced for New South Wales and South Australia can be more useful upon zooming in, but occasionally they are so cluttered with multiple polygons and symbols that they are difficult to decipher. The Victoria map improves after zooming in, but it tries to include too much information.

The data on these three maps stops at the imaginary line separating the states. This could give someone the false impression that there are no fires just across the state border. If you need information about a location near a state line you need to know how to access the data for both states.

The three Australian states all use different symbology, so an icon or polygon on one map may have a completely different meaning in the neighboring state.

The New South Wales Rural Fire Service occasionally produces detailed maps showing the perimeter of a single fire and the predicted spread, but it is not done on a regular basis and may be difficult to find when it does exist.

But these Australian state maps attempt to include at least some information about all large bushfires in their state. In the United States no agency to my knowledge even attempts this. InciWeb produces a map of the country that shows the location of every fire on federally managed land that is being tracked on the website, but does not include federal fires that are not on the site, or state or locally managed fires.

For both Australia and the U.S. creating a national map for wildfire information would be a great first step toward a common operating picture.

Check out Ellen Broad’s thread on this mapping topic. She has some excellent observations.

Wildfire history of California, interactive

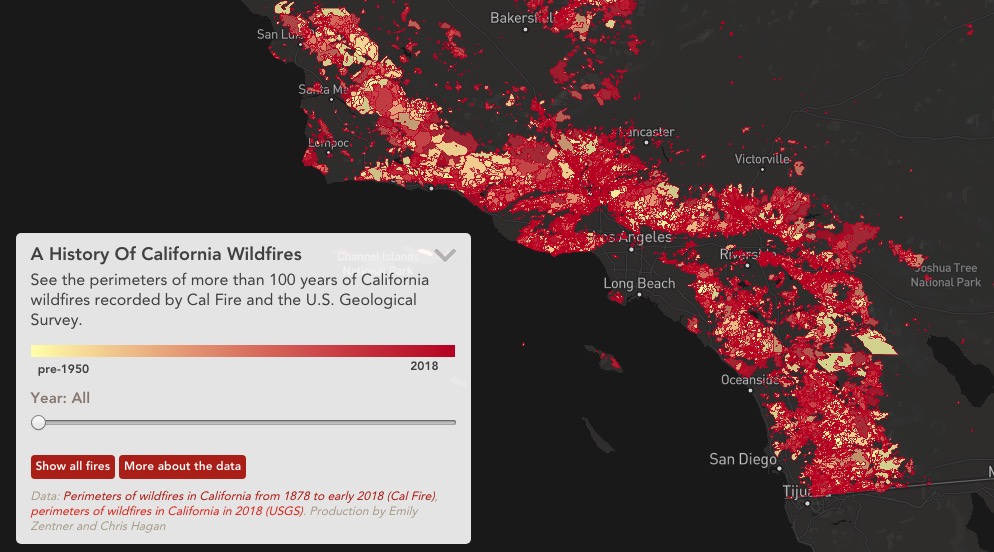
California fire history map
California fire history map by Capital Public Radio. All fires in Southern California 1878-2018. Click to enlarge.

We often hear, “It’s not IF an area will burn, but WHEN”.

Capital Public Radio has developed an interactive map showing the footprints of wildfires that have occurred in California since 1878. You can see all of the fires at once, or individual years, and the map is zoomable. (The map may not display well in all browsers. It seems to work best using Firefox.)

I may or may not have spent too much time looking at these maps.

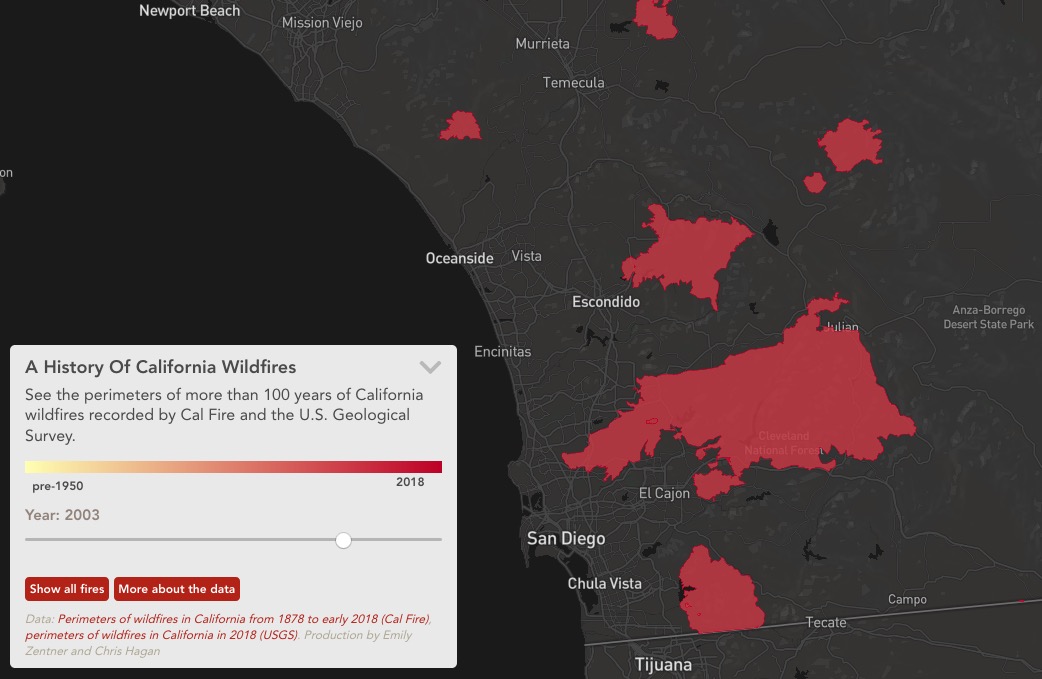
California fire history map San Diego County
California fire history map by Capital Public Radio. San Diego County, 2003. The largest fire is the Cedar Fire. Click to enlarge.

Satellite photos of California wildfires

(Originally published at 6:43 p.m. PDT October 12, 2017)

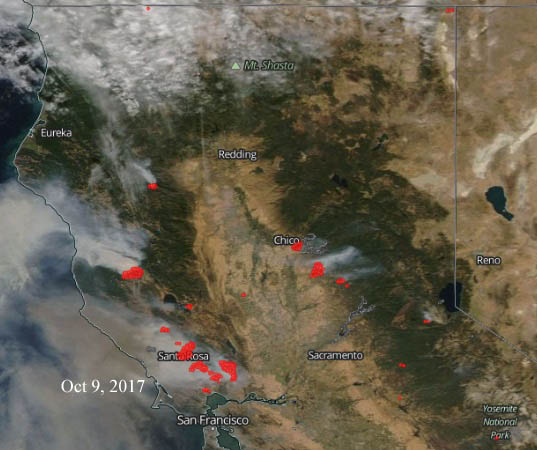
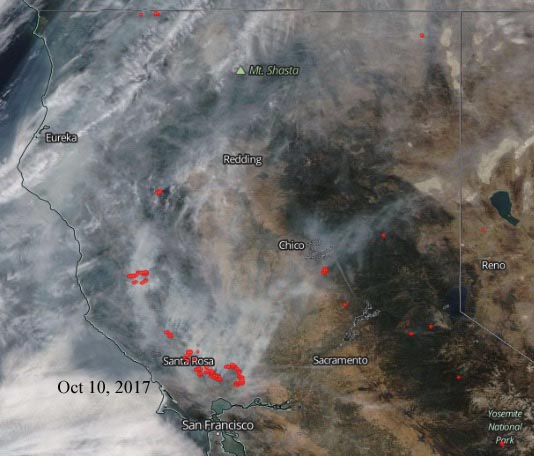
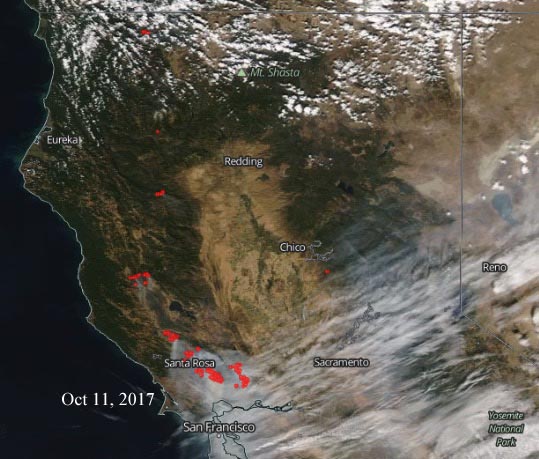
These satellite photos show the growth of the wildfires in northern California. The photo above is from October 12, 2017. The red dots represent heat.

The next four photos are October 8 through October 11.

Satellite photo California wildfires

Satellite photo California wildfires

Satellite photo California wildfires

Satellite photo California wildfires

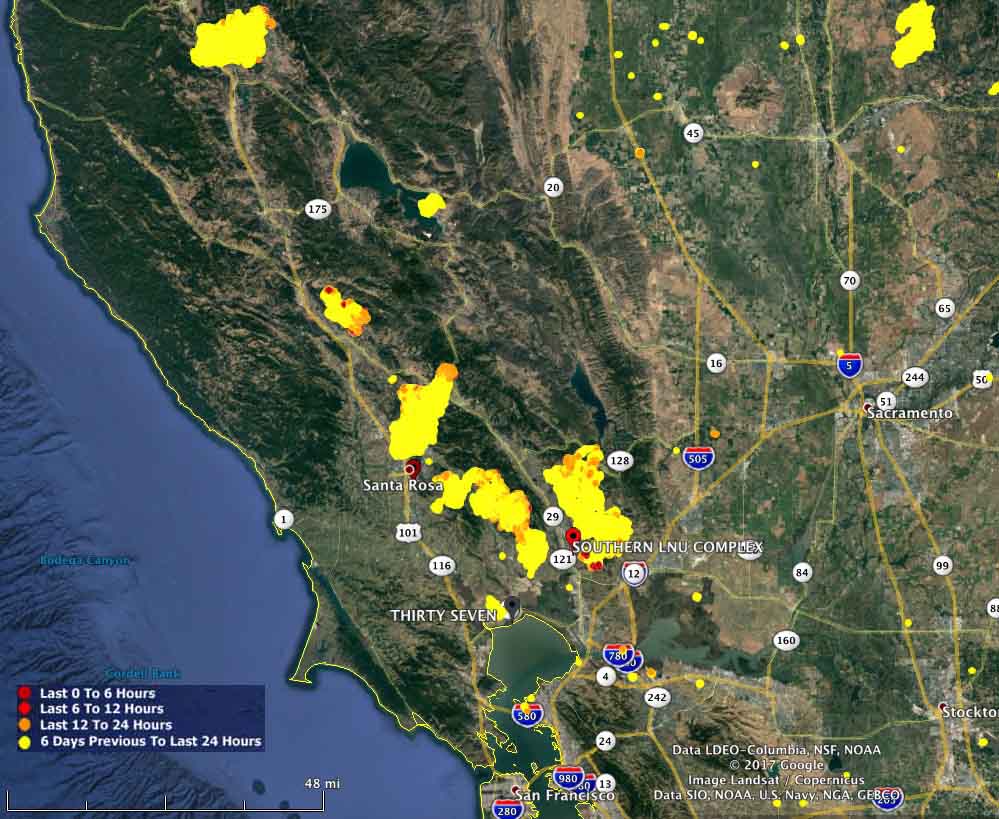
Below is a map showing heat detected on the fires over the last week.

map California wildfires
Map showing heat detected on wildfires in California over the last week. Created at 5:30 p.m. PDT October 12, 2017.

Detwiler Fire spreads quickly, causes evacuation of Mariposa

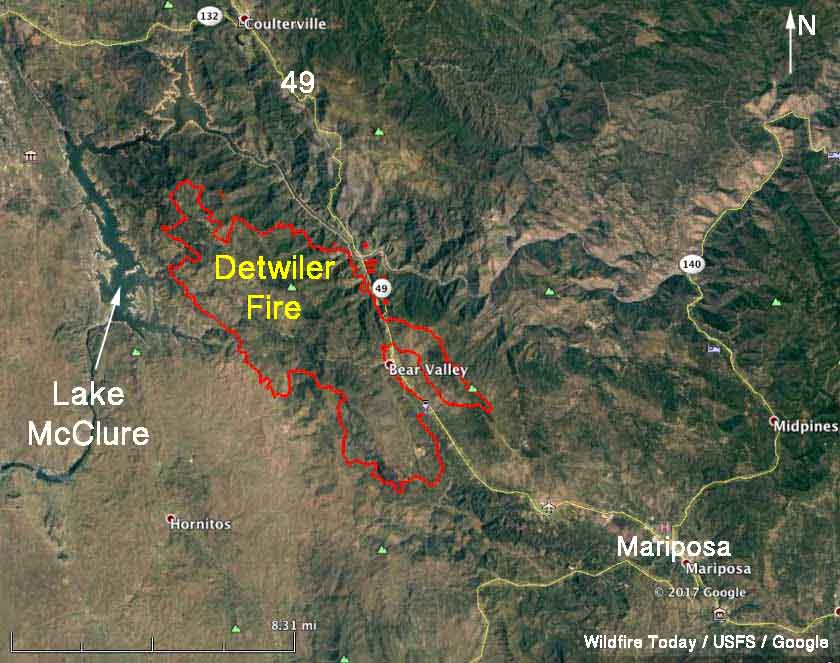
Above: Map of the Detwiler Fire. The yellow line was the perimeter at 1 a.m. PDT Tuesday July 18, 2017. The red dots represent heat detected by a satellite at 1:48 p.m. PDT July 18. The satellite detections can’t be relied upon to be 100 percent accurate. The very intense smoke plume over the fire on Tuesday may have contained enough heat to trip the sensors on the satellite, giving the impression that the fire was larger than it actually was. 

(UPDATED at 9:13 p.m. PDT July 18, 2017)

(All articles on Wildfire Today about the Detwiler Fire are tagged “Detwiler Fire” and can be found here, with the most recent at the top.)

The Detwiler Fire continued to be very active Tuesday afternoon. CAL FIRE, the agency responsible for suppressing the blaze, estimated at 7 p.m. that the size had increased to about 25,000 acres, up from 19,601 at 1 a.m. on Tuesday. They reported that 8 structures have been destroyed, but did not specify if they were residences or outbuildings.

The CAL FIRE web site sometimes has information about evacuations.

The fire spread to the south Tuesday, pushed by a wind out of the north. Winds from the north are expected to continue through the night and into Wednesday morning at 6 to 9 mph, shifting to come out of the west in the afternoon. Wednesday’s temperature in the fire area will top out at 98 degrees, with the relative humidity hitting 14 percent in the afternoon.

(UPDATED at 5:34 p.m. PDT July 18, 2017)

The Detwiler Fire has been very, very active Tuesday afternoon, spreading very quickly and putting up a huge smoke plume. For a while at mid-afternoon at least one air tanker working the fire, a DC-10, was diverted to a new fire 6 miles southeast of Redding. During that time the KCRA live video did not show any air tankers on the Detwiler Fire, but after a while there were two DC-10s, an MD-87, a C-130, and at least one S2T working the fire again.

The camera operator for KCRA has no trouble finding action to film — air tankers dropping, massive flames, or a towering convection column.

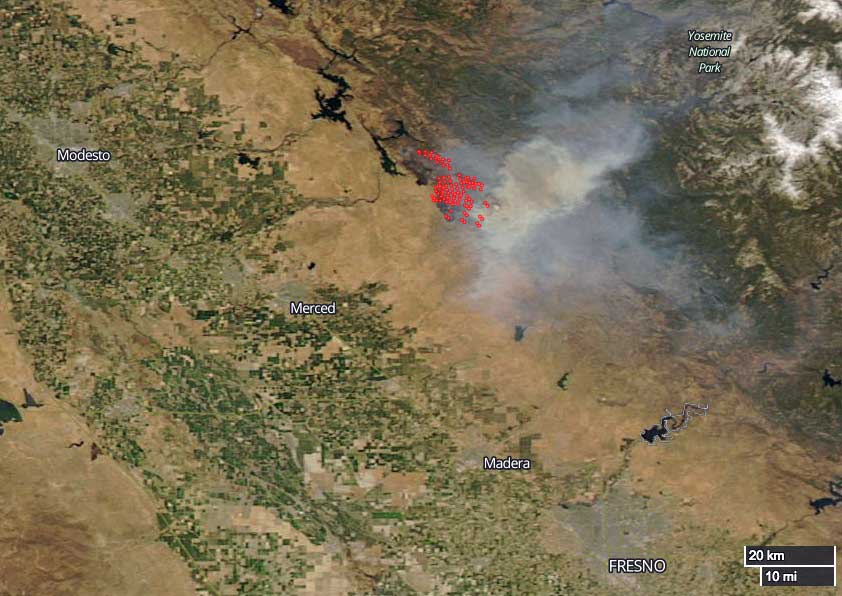
Detwiler Fire satellite photo
Satellite photo of the Detwiler Fire, the afternoon of July 18, 2017. NASA.
Erickson Aero Tanker DC-7
An Erickson Aero Tanker DC-7 dropping on the Detwiller Fire the afternoon of July 18, 2017. Screenshot from KCRA video.

(UPDATED at 1:24 p.m. PDT July 18, 2017)

The Detwiler Fire has grown explosively since it started less than 48 hours ago during the afternoon of July 16. At 1 a.m. PDT on July 18 it was mapped at 19,610 acres, an increase of 16,192 acres over the previous 24 hours.

The fire is 6 miles northwest of Mariposa.

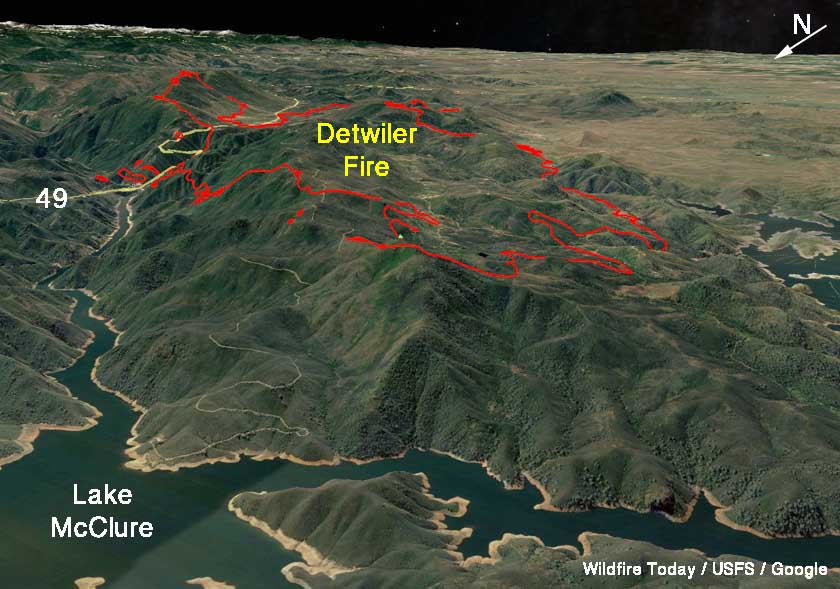
The maps of the Detwiler Fire below were current at 1 a.m. PDT July 18, 2017.

Detwiler Fire
3-D Map of the Detwiler Fire looking southeast, Data from 1 a.m. PDT July 18, 2017.

It is already causing evacuations in areas of Mariposa County, according to the Sheriff’s office. At 12:30 p.m. PDT Tuesday CAL FIRE revised their information about the fire to indicate that the city of Mariposa is being evacuated, but by 1:18 p.m. PDT the Sheriff’s Office had not stated it like that on their web site. However, the Sheriff’s site lists about 19 locations that ARE evacuated, without providing a map, so it can be a little difficult to get the entire picture.

Highway 49 is closed. Power lines that supply electricity to Yosemite National Park, which is 19 air miles to the east, could be impacted.

The time-lapse video below was filmed by Toney Gorham between 7:30 and 8:30 p.m. on Sunday July 16.

Detwiler Fire
Map of the Detwiler Fire at 1 a.m. PDT July 18, 2017.
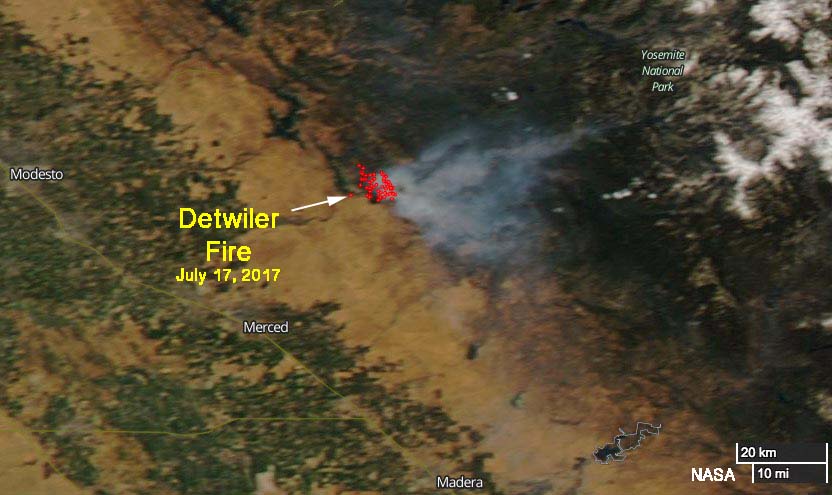
Detwiler Fire satellite photo smoke
Smoke from the Detwiler Fire as seen by a NASA satellite July 17, 2017.

Thanks and a tip of the hat go out to JW.
Typos or errors, report them HERE.

Anderson Creek fire in Oklahoma and Kansas

(UPDATED at 11:30 a.m. March 25, 2016)

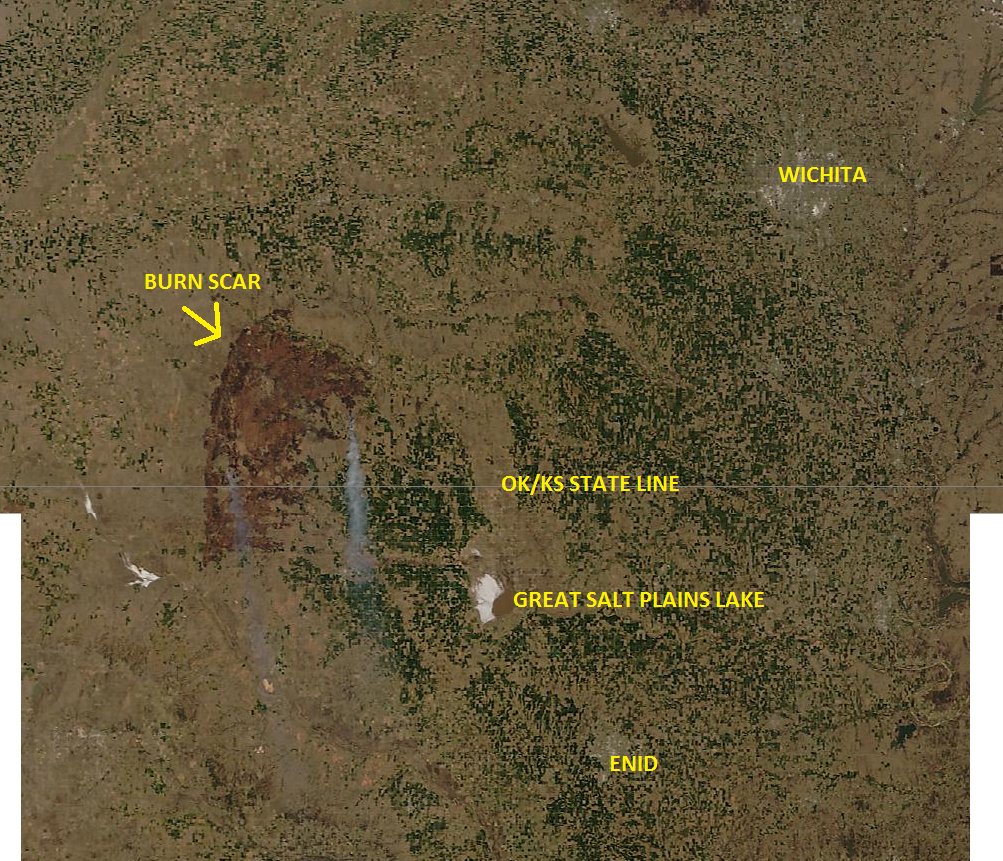
KS-OK fire from space
The Anderson Creek Fire in Oklahoma and Kansas as seen from space. Photo via Damon Lane
@KOCOdamonlane

****

(UPDATED at 12:15 a.m. CDT, March 25, 2016)

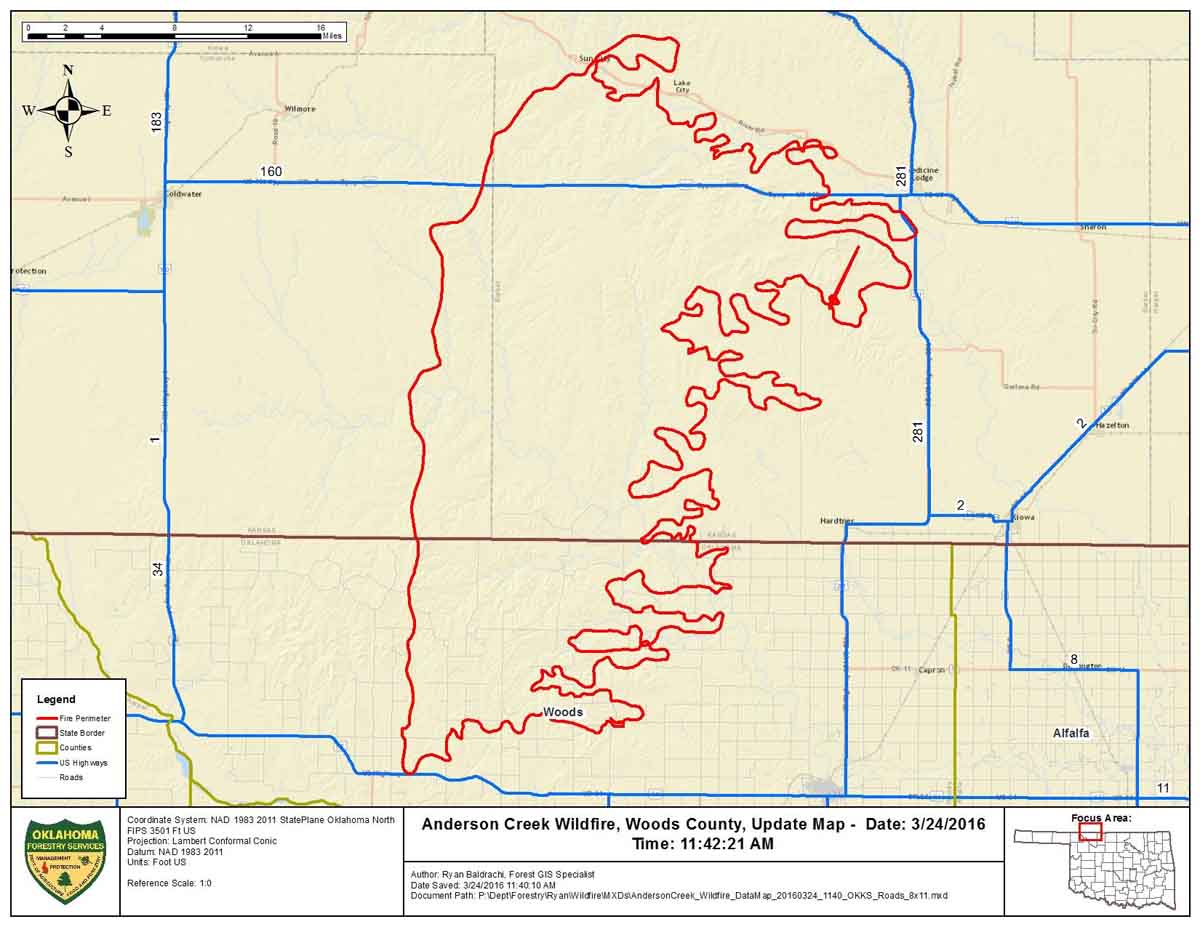
This map was provided by Oklahoma Forestry Services, along with the information that the fire had burned an estimated 397,420 acres and was 0% contained Thursday morning.

Map Anderson Ck Fire 3-24-2016

****

(UPDATED at 6:12 p.m. CDT March 24, 2016)

The video below is a recording of the briefing by public officials of Barber County Kansas the morning of March 24, 2016 about the very large fire insouthern Kansas and northern Oklahoma. It was originally broadcast on Periscope by Amy Bickel, but since recordings there are automatically deleted after 24 hours, we preserved it here. It was recorded off a computer monitor, so we apologize for the low quality.

In the briefing referenced above, the County Attorney said “397,420 acres have burned over the last couple of days”. He did not indicate if that was the size of the very large fire in our maps, or if the acreage includes multiple fires. He also said two homes were destroyed.

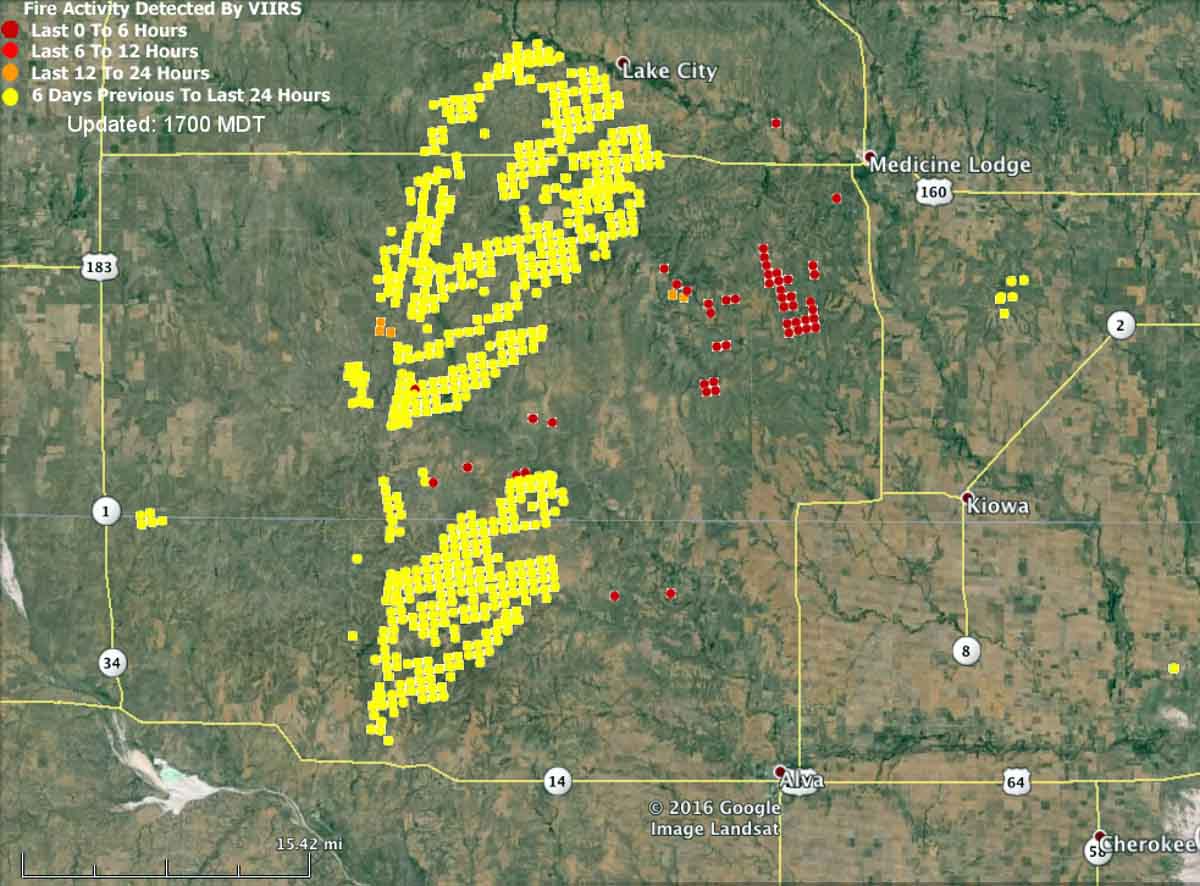
The map below shows heat detected by a satellite at 2:25 p.m. on March 24. The light vegetation in the area may sometimes ignite, burn up completely, and then cool before the next satellite overpass, which can be about 12 hours apart. In this case the mapped data may under-report the true extent of the fire.

map fire wildfire kansas oklahoma medicine lodge
Kansas-Oklahoma fire map at 2:25 p.m. CDT March 24, 2016.

Here is an excerpt from an article at WIBW, dated March 24 at 2:10 p.m.

Strong winds have thwarted efforts to contain a wildfire that has burned 620 square miles of rural land in Oklahoma and Kansas, and it’s now approaching populated areas.

Oklahoma Forestry Services spokesman Mark Goeller said Thursday that strong winds shifted the direction of the fire late Wednesday and overwhelmed existing containment lines.

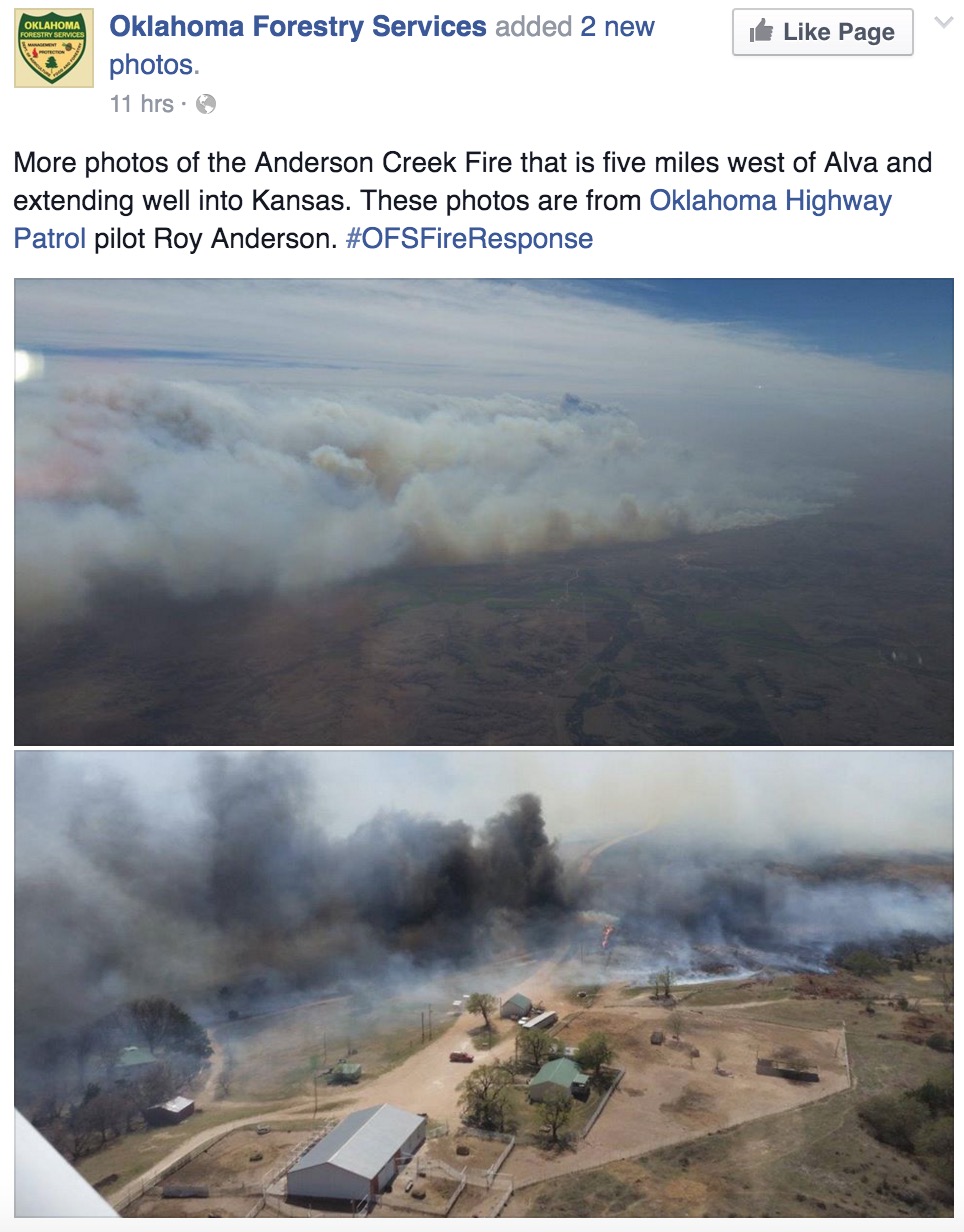
Officials are now monitoring a part of the blaze 5 miles away from Alva, Oklahoma, where about 5,000 people live. No mandatory evacuations have been issued in Oklahoma, though Goeller says officials are forming contingency evacuation plans as crews work to slow the fire’s spread.

Goeller says wind conditions and humidity are expected to improve throughout the day, making progress on containment more likely…

Anderson Creek Fire 3-24-2016

Continue reading “Anderson Creek fire in Oklahoma and Kansas”

Solimar Fire causes evacuations near Ventura, California

(UPDATE at 8 p.m. PST, December 26, 2015)

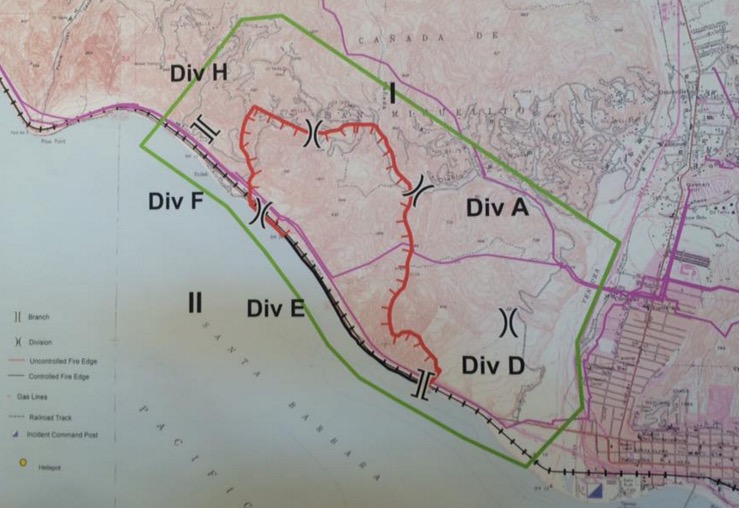
Solimar Fire Map,
Solimar Fire Map, provided by the Ventura County Fire Department at noon, December 26, 2015 (click to enlarge)

The Solimar Fire northwest of Ventura, California as of 5:40 p.m. PST had not grown appreciably since early Saturday morning, and was mapped at 1,236 acres. Approximately 403 firefighters were on scene at that time as well as one helicopter.

The 101 Freeway, which had been closed in both directions is now open and evacuations have been lifted.

The weather has changed from strong gusty winds Friday night to a Saturday night forecast of 7 mph north winds, 37 degrees, with 30 percent humidity.

Photo of Solina Fire courtesy of Ventura County Fire Department.

****

(Originally published at 11:05 a.m. PST, December 26, 2015)

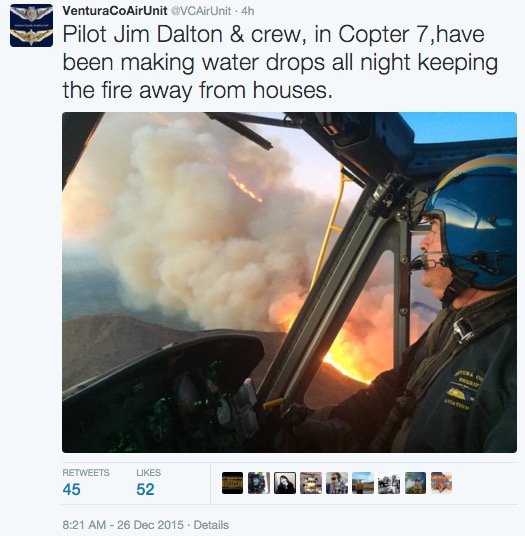
Solimar Fire Ventura County air unitA vegetation fire has burned about 1,200 acres in southern California northwest of the city of Ventura. The Solimar Fire started at about 11 p.m. PST Christmas day and spread quickly, pushed by 50 mph winds.

The fire, burning on both sides of the 101 freeway near the Pacific coast, caused havoc among motorists when some of them made U-turns on the blocked divided highway, fleeing from the fire through opposing traffic, much to the surprise of the unaware oncoming drivers.

The 101 is closed and mandatory evacuations are still in place as this is written at 10:56 a.m. on Saturday.

The good news is that, again, the Pacific Ocean proved its value as a very adequate fuel break.

The video below was a 2 a.m. briefing by the Ventura County Fire Department.