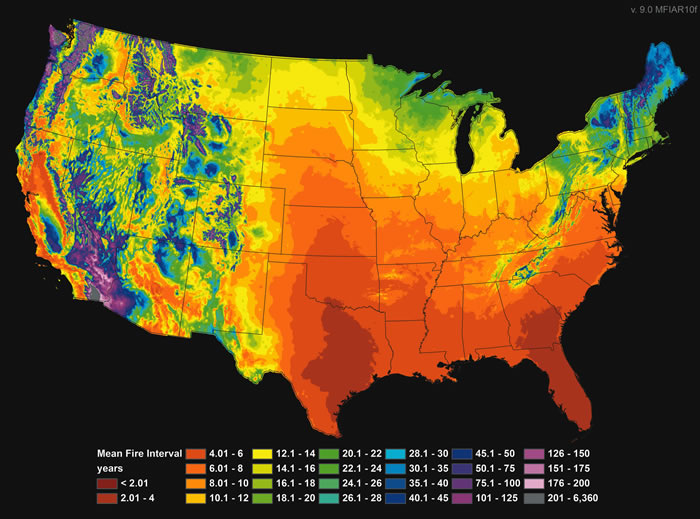
The map (click on it to see a larger version) represents the estimated wildfire frequency for the period 1650-1850, according to research by Daniel Dey, Richard Guyette, and Michael Stambaugh.
Their description of the project:
Knowledge of historic fire frequency is important in guiding restoration of fire dependent ecosystems, but it is often missing or cannot be determined locally due to lack of fire-scar tree records. A Northern Research Station scientist and collaborators have developed a new model called PC2FM that predicts historic fire frequency for the continental United States. The model uses mean maximum temperature, precipitation, their interaction, and estimated reactant concentrations to estimate mean fire intervals. Having science-based estimates of historic fire frequencies for specific project areas is a major advancement in ecosystem restoration. Another important use of the model is in assessing potential changes in climate (temperature and moisture) on the likelihood of wildland fires. The PC2FM model can be used to map large-scale historic fire frequency and assess climate impact on landscape-scale fire regimes.
UPDATE June 5, 2015:
One of the comments from a reader what that they would like to have a poster-sized print of the image. If you go to Fine Art America you can order prints starting at $17, ranging in size from 8″ x 6″ up to 60″ x 44″. Frames are optional for an extra charge. The map can also be printed on cell phone cases, greeting cards, duvet covers, and throw pillows.


We just added this to the article:
One of the comments from a reader what that they would like to have a poster-sized print of the image. If you go to Fine Art America you can order prints starting at $17, ranging in size from 8″ x 6″ up to 60″ x 44″. Frames are optional for an extra charge. The map can also be printed on cell phone cases, greeting cards, duvet covers, and throw pillows.
Thanks, Bill
Excellent work by these researchers. I would like to say that this map is only based on the physical chemistry of fuels and does not take into account anthropogenic lighting of fires. Just some context of why it might not jive with FRIs based on historical accounts and evidence that leave fuels out. “The other side of the coin” you might say. As far as the color scheme goes, I am guessing that the program they used may have limited color schemes to choose from and they simply chose what they felt was the most appropriate one. As I used to make a lot of maps for college courses and jobs, it is as frustrating to the makers of maps as it is to the users.
You can download a PDF of the paper the map appears in at:
http://www.nrs.fs.fed.us/pubs/40218
I picked up one of these at the Northeast Fire Ecology conference in 2014, great placemat!
Cool map. I want a poster for my Office!