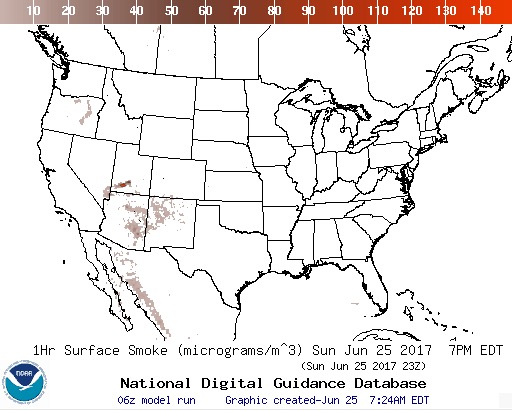
Above: the map above predicts the distribution of wildfire smoke at 5 p.m. MDT June 25, 2017. It is an experimental product from the NOAA’s Earth System Research Laboratory. The red area in southern Utah is very dense smoke from the Brian Head Fire. The map also shows significant smoke impacts in much of Arizona and New Mexico.
The map below is a different smoke prediction from NOAA, for the same time.

