The statistics collected by the National Interagency Coordination Center (NICC) for last year’s fire activity confirm what wildland firefighters in the United States already knew — the fire season in the lower 48 states was much slower than average. Outside of Alaska 2,210,266 acres burned, about 40 percent of the 10-year average of 5,608,376 acres. The 2019 lower 48 total was the least since 2004 when 1,451,902 acres were blackened.
However, the number of acres burned in Alaska, 2,454,098, was almost double the 10-year average for the state and was more than the other 49 states combined. That and the fact that fires in Alaska are managed far differently than those in the rest of the U.S. is why at Wildfire Today we keep the statistics separate.


All other Geographic Areas saw below average acres burned: Southwest (78%), Northern California (48%), Great Basin (42%), Eastern (38%), Southern Area (38%), Northwest (28%), Rocky Mountain (24%), Southern California (20%), and Northern Rockies (15%). Only 27 fires and complexes exceeded 40,000 acres in 2019, which is 21 fewer than 2018.

The eight largest fires in Lower 48 states in 2019
| Name | State | Start Date | Size | Cause | Estimated Suppression Cost |
|---|---|---|---|---|---|
| Woodbury | AZ | June 8 | 123,875 | Unknown | $20,000,000 |
| Sheep | ID | June 22 | 112,106 | Lightning | $710,000 |
| Kincade | CA | Oct. 23 | 77,758 | Unknown | $77,144,000 |
| Pothole | ID | Aug. 6 | 69,704 | Human | $600,000 |
| Walker | CA | Aug. 16 | 54,608 | Unknown | $35,600,000 |
| Williams Flatt | WA | Aug. 2 | 44,446 | Lightning | $19,432,000 |
| Sawgrass | FL | June 23 | 42,000 | Lightning | not reported |
| Cold Creek | WA | July 18 | 41,920 | Unknown | $900,000 |
One reason for the slowdown in wildfire activity was the weather — it was not as hot, dry, and windy across the Western United States as we have been accustomed to in a typical summer. This affected the Preparedness Level (PL), which is the planning and organizational readiness dictated by burning conditions, fire activity, and resource availability. In 2019 the PL never rose above three, with five being the highest possible level of preparedness. On August 6 it was raised to PL 3 where it remained for only nine days. This is the first time PL 4 has a not been reached since 2010. In 2017 and 2018 we were at PL 4 or 5 for a total of 122 days.
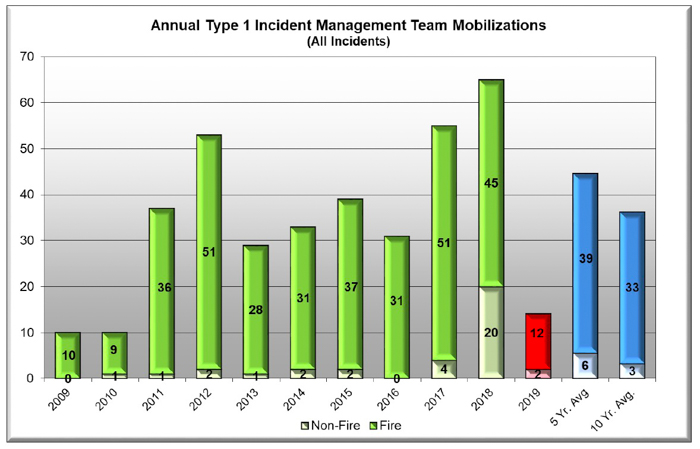
The number of mobilizations of Type 1 Incident Management Teams was about a third of the 10-year average — 12 fires compared to the average of 33. There were no T-1 IMTs deployed during 2019 in the Great Basin, Northern Rockies, or Northwest Geographic Areas.
Between June 5th and July 10th the United States provided 20 crews and 24 individual wildland fire personnel to Alberta, Canada. Between November 14th and December 31st, through the NIFC-Australia Agreement, 85 wildland fire personnel were assigned to support large fires in New South Wales and Victoria, Australia. Support to Australia has continued into 2020.
The number of crews mobilized, 614, was 71 percent of the 10-year average. Nationally the unable to fill rate on crews was 15 percent, but was much higher in Northern California where it was 42 percent.

NICC received 949 engine requests in 2019, which was 61 percent of the 10-year average. Of these requests, 789 were filled, 64 were canceled and 96 (10 percent) were unable to be filled (UTF). There were 13 requests placed to NICC for tactical water tenders, of which 11 were filled, two canceled, and zero UTF.
The number of overhead mobilizations was two-thirds of the 10-year average, with 9 percent UTF.

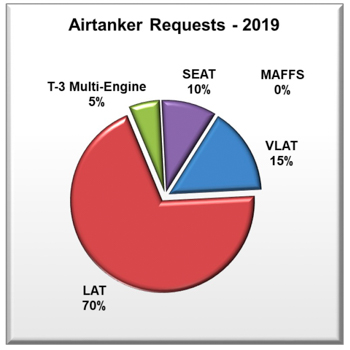
A total of 438 Very Large Air Tanker, Type 1, and Type 2 large airtanker requests were received by NICC in 2019. Of that total, 308 requests were filled, 41 were canceled and 89 (20 percent) were UTF. The NICC received no requests for MAFFS in 2019.
NICC received 78 requests in 2019 for Single Engine Air Tankers and Type 3 Air Tankers, of which 64 were filled, 6 were canceled, and 8 were UTF.

A total of 351 Type 1, 2 and 3 helicopter requests were received by NICC in 2019, 274 were filled, 38 were canceled, and 39 (11 percent) were UTF. Of the 151 Type 1 helicopter requests placed to NICC, 130 were filled, 14 were canceled and 7 (5 percent) were UTF. Of the 100 requests placed to NICC for Type 2 helicopters, 66 were filled, 12 canceled and 22 (33 percent) were UTF. Of the 100 requests placed to NICC for Type 3 helicopters, 78 were filled, 12 canceled and 10 (12 percent) were UTF.
There were no activations of military C-130 aircraft with Modular Airborne FireFighting Systems, MAFFS, for the first time since 2010.
NICC arranged for 5,197 passengers to be transported on large aircraft, mostly on a B737 that was on fire season contract. There were also two additional large aircraft charter flights that were arranged by NICC.
A total of 49 requests for mobile food services were received at NICC in 2019. Of these 47 were filled, two were canceled and zero were UTF. A total of 62 shower units were requested, and all of these were filled (none were canceled or UTF).
The number of shower and food service mobilizations were both 44 percent of the 10-year average.
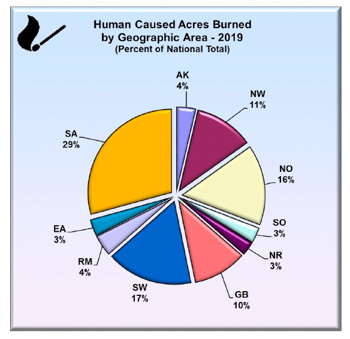
Here is a list of the abbreviations for the Geographic Areas as shown in the reports: AK Alaska, EA Eastern, GB Great Basin, NO Northern California (North Operations), NR Northern Rockies, NW Northwest, RM Rocky Mountains, SA Southern, SO Southern California (South Operations), SW Southwest, ST/OT States/other, and CN Canada.