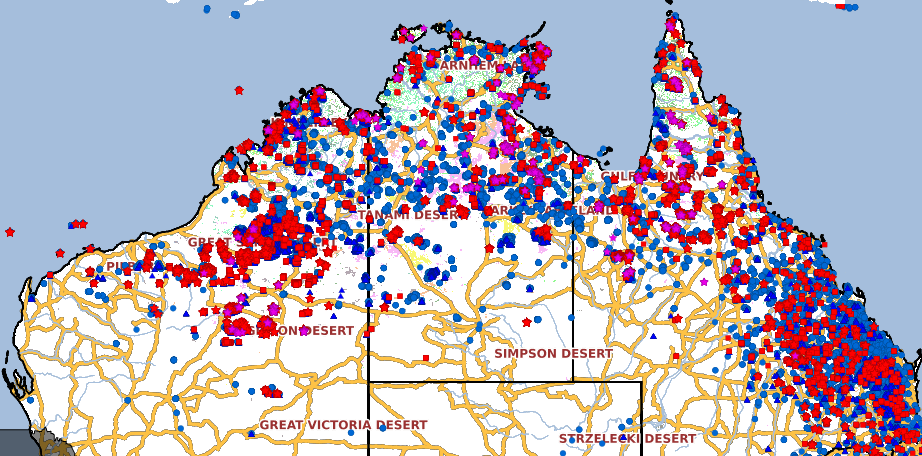
This video created by Kenji Kato using Google Earth, is a “fly-through” showing heat data collected by a satellite for the Chelan Complex of Fires, the Okanogan Complex of Fires, and other fires in north-central Washington state. The fly-through starts above the U.S., then flies in on the Pacific Northwest, then Central Washington, before closing in on the fire areas. The icons represent heat detected by a satellite as late as 3:30 a.m. PDT on August 20, 2015.
The icon color is based on fire activity with red representing heat detected in the last 0-12 hours (at the time data was updated). Orange represents activity in the previous 12 to 24 hours, and yellow is data 1 to 6 days before.