
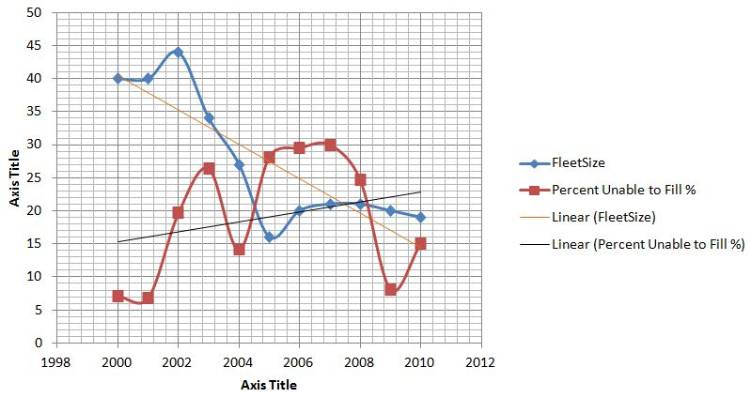
I love charts and graphs, and one of our readers has put together a very interesting one. They found data for the number of large air tankers on contract each year and the number of orders for them that were UTF (unable to be filled).
The person that sent us the data and asked to remain anonymous, sent us this message that along with the data:
Bill,
Great website, I really enjoy reading it. Here is a little flame for the airtanker debate. This is a continuation of my comments posted to the September 26, 2011 page.
I was curious if the number of large air tanker orders that are filled each year have changed with the decreasing fleet size. I came across these data from http://www.nifc.gov/fireInfo/fireInfo_statistics.html. I compiled these in the attached spreadsheet for years 2000-2010.
The percentage of orders that are “unable to fill” have increased as the fleet size has reduced. However, in recent years (2009-2010) with a fleet size of ~ 20 planes, the percent of orders unable to fill were 11.5% on average vs 7% for years (2000-2001) when the fleet size was double at ~ 40 planes. I think this shows that the air tanker fleet size is still meeting demand reasonably well even though it has fewer large tankers available. I’ll be curious to see what this looks like for 2011 and especially 2012 if the fleet continues to reduce.
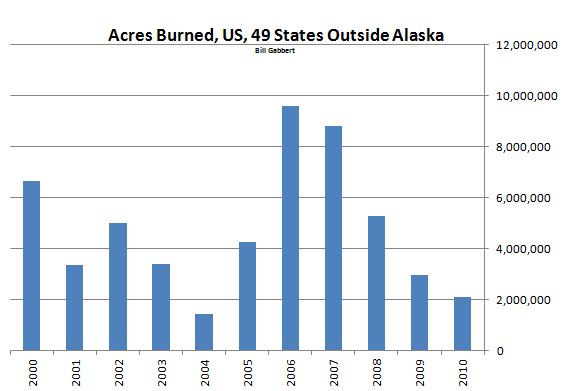
Of course the number of UTFs for air tankers is affected not only by the number of air tankers on contract, but also by the need for them, or, how busy the fire season is. Here is a chart that I put together using data at NIFC showing the number of acres burned in the lower 49 states (which does not include Alaska) 2000 through 2010. I excluded Alaska because in four of the years during this period they burned between 2,000,000 and 6,000,000 acres, which skews the data. Some of their huge fires see little if any suppression activity, so for this purpose, they are largely irrelevant. (Sorry Alaska)
Interpreting this data is very difficult. I would exclude data for 2002 through 2004, because I believe, and someone correct me if I’m wrong, but due to the two fatal mid-air wing failures in 2002, the number of available large air tankers changed dramatically in the middle of the 2002 and 2004 fire seasons as categories of air tankers were grounded, temporarily or permanently.
If you compare UTFs before and after 2002-2004 with similar number of acres burned outside Alaska, sometimes there is a correlation and other times there is none. For example, a similar number of acres burned in 2000 and 2008, and 2008 had more than triple the number of UTFs. But the years 2001 and 2009 with similar acres burned also had similar numbers of UTFs.
Perhaps we can be safe in saying, based on this data, that if more than 4,000,000 acres burn in the lower 49 states as in 2005-2008, having 21 or fewer large air tankers tends to result in 25-30% of the air tanker orders being UTF, which is about triple the UTF rate when fewer acres burn. In 2000 with 40 air tankers on contract, 6,600,000 acres burned, and the UTF rate was 7%.


