Skip to content

Wildfire smoke creates “unhealthy” air in the Northwest U.S. Wednesday

(UPDATED at 4:28 p.m. MDT September 6, 2017)
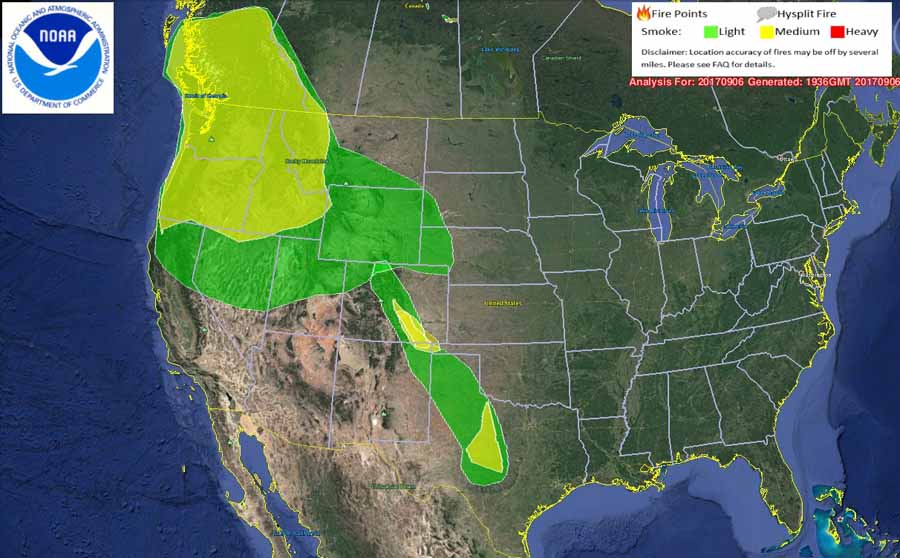
Map wildfire smoke
Map showing the distribution of wildfire smoke. The map was created by NOAA at 1:36 p.m. MDT September 6, 2017.

The map above showing the distribution of wildfire smoke was created at 1:36 p.m. today, Wednesday. You may notice a difference between it and the other maps below that were produced earlier Wednesday morning.

****

(Originally published at 9:40 a.m. MDT September 6, 2017. We will update this information through the day on Wednesday September 6.)
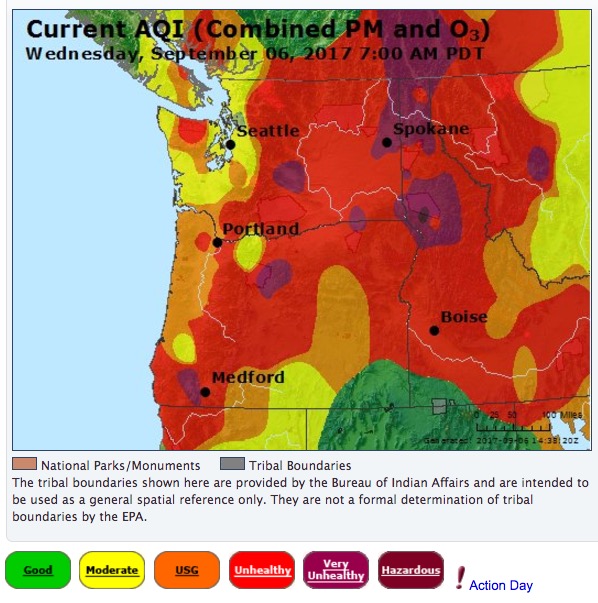
Air Quality Index for the northwestern states
Air Quality Index for the northwestern states at 8 a.m. MDT September 6, 2017. AirNow.

The siege of wildfires in the Northwestern United States that has persisted for several weeks continues to produce air that humans and other animals should not breathe. On Wednesday air quality classified as “unhealthy”, “very unhealthy”, or “hazardous” exists in some areas of California, Oregon, Washington, Idaho and Montana.

More detailed information about locations in the following states is available from Airnow.gov:
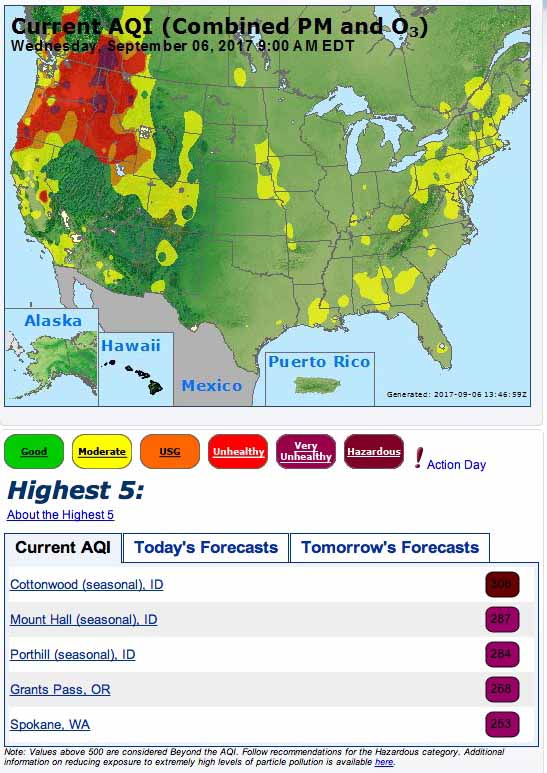
Air Quality Index
Air Quality Index at 7 a.m. MDT September 6, 2017. AirNow.
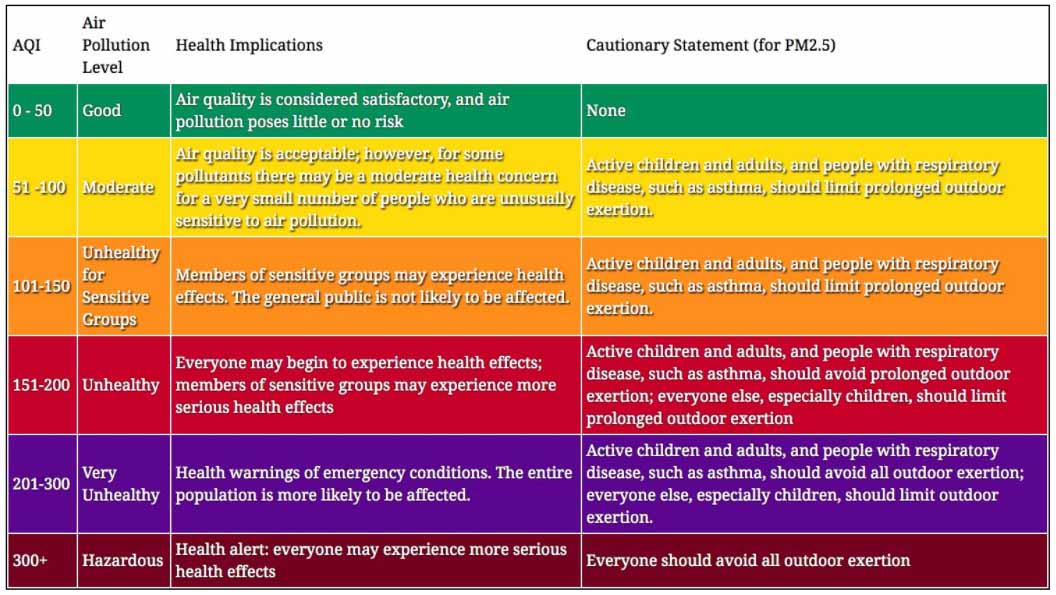
Description of Air Quality Index (AQI) categories
Description of Air Quality Index (AQI) categories. The colors may not match those used on all maps and systems, but the category names and the actual AQI numbers should hopefully be the same.
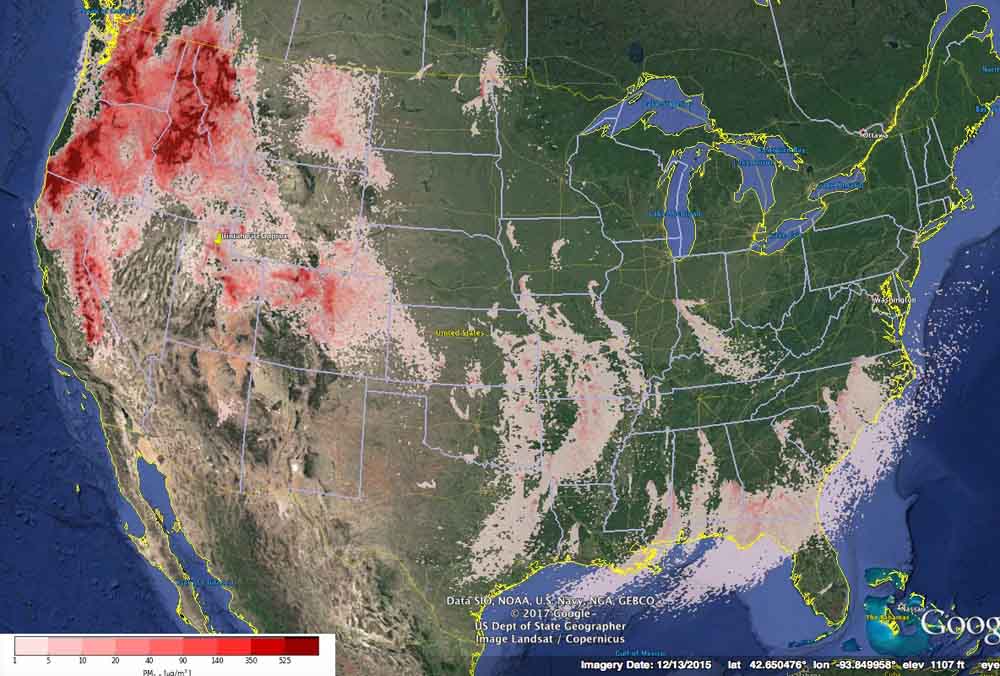
smoke forecast pm2.5
Forecast for maximum concentrations of small particles (PM 2.5) such as those found in wildfire smoke, for September 6, 2017. BlueSky.

The image below is the forecast for small particles (PM 2.5) such as those found in wildfire smoke, for September 8, 2017.
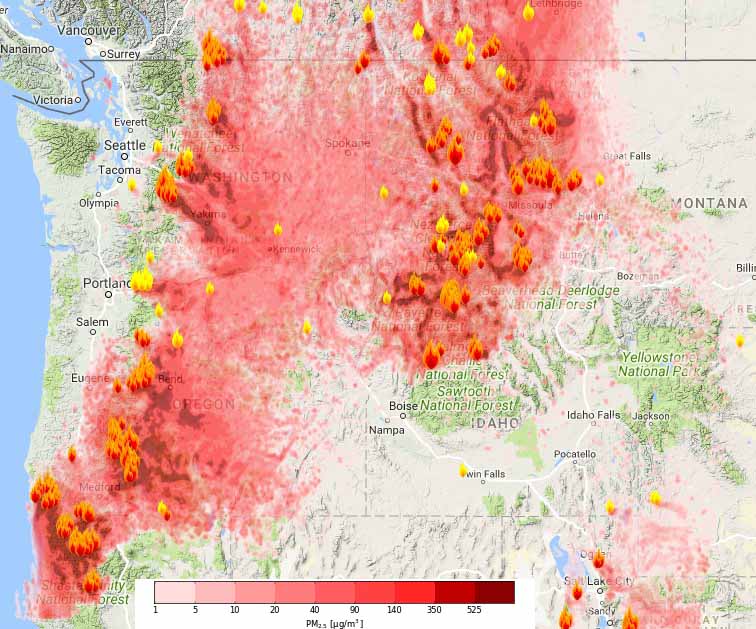
smoke forecast
Forecast for small particles (PM 2.5) such as those found in wildfire smoke, for the Northwest at 2 p.m. PDT September 8, 2017. BlueSky.

Comments

More in Reports