Regular readers of Wildfire Today know that I like to present statistics, charts, and graphs about wildland fire size and occurrence. The first article on Wildfire Today on this topic was in January 19, 2008, and the last time was December 10, 2010. The final numbers for the 2010 calendar year for the United States are available, and I found a new source for crunching data, Many Eyes. So, there’s a new excuse reason for writing another article.
One statistic I concentrate on is the average size of fires, not so much the number of fires or the total acres burned each year, two stats that the mainstream media harps on. The average size is affected not only by the weather, but also by the fuel condition and age, how many fires were burning at the same time, the short-term availability of firefighting resources, the skill and efficiency of the firefighting effort, strategy used on fires, and the number of firefighting resources on the payroll of the firefighting agencies.
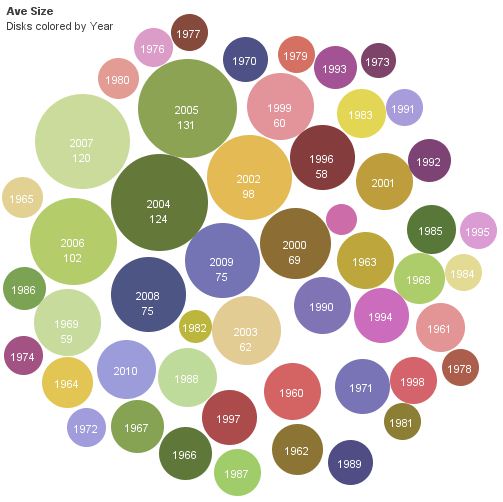
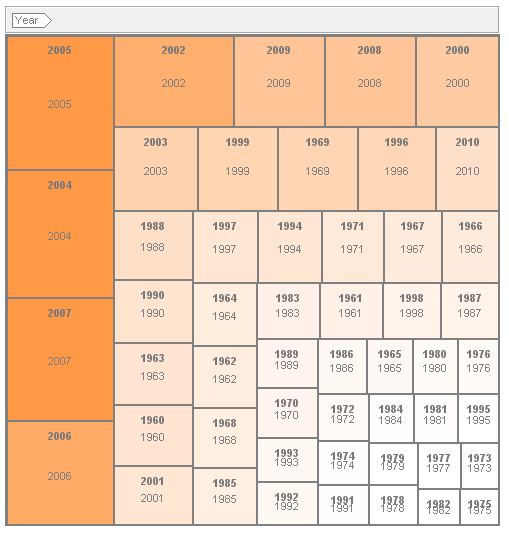
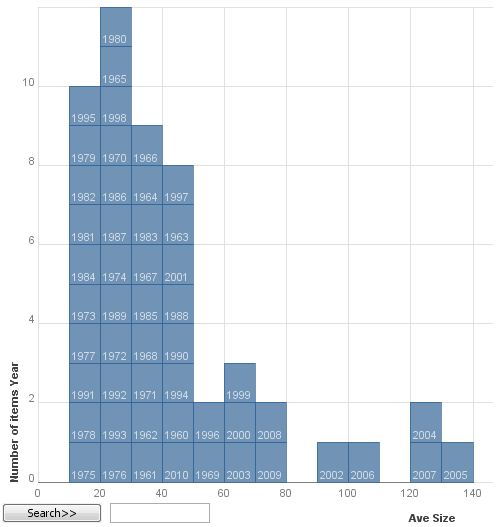
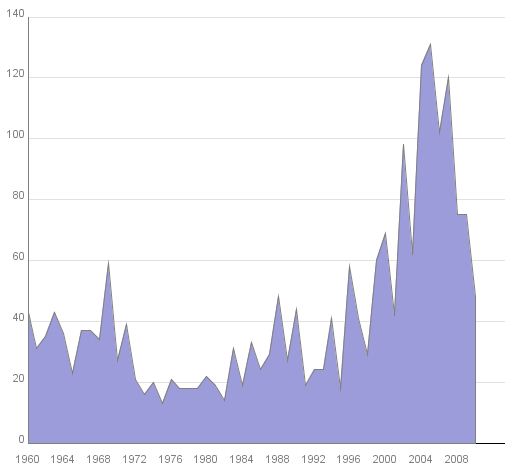
Here are a few new ways of visualizing the average size of wildland fires, in acres, in the United States, from 1960 through 2010. The data for the number of fires and acres burned each year came from NIFC. Then I spent some time with Excel and Many Eyes to develop these products.


And the standard stack graph:

The average fire size in 2010 was 48 acres, compared to the average between 1960 and 2010 which was 37.
The chart below shows the average size of wildfires in the United States by decade.


I did wildfire suppression for a couple years. Coldwater is semi-correct. There is no policy to see if the fire “Will go out by itself”, as this is very unlikely. However, it is often the case that fires are left to burn more, as fire can be good for environments. When possible, fires are left to burn through as much land as is safe. This is particularly the case that have an over-abundance of un-burned fuel from the last 80 years of terrible fire-fighting strategies.
I like the bubble graph to check my color identification ability.
I wonder if there is a connection between (air tankers and acres) 1960’s fixed-wing medium and heavy airtankers (44) on contract and the continuing reduction of air tankers to a about nine available today nation wide, and those nine are probably committed on fires who knows where. Or is there a policy change (Federal lands) to wait and see if a fire will go out by itself, like the Station fire?
Johnny – how is it possible to “wait and see if a fire will go out by itself, like the Station Fire” and still spend more than $96 million in suppression costs?
Some other questions to be asked might include: where were the fires occurring by GACC; how much was the average daily temperature changing in specific areas by decade since 1960;what was the influence of the WUI on final fire sizes; were Alaska acres included in the numbers; were the acres Fed or State, and if Fed, whick USDA and USDI agencies had acres burned;and would any number of air tankers or helicopters really made a difference when old Mother Nature decides it’s time to burn (i.e. NorCal in 1987, Yellowstone in 1988, Montana in 2000, or SoCal when the Santa Ana winds blow?
There’s an old saying that “liars can figure and figures can lie.” Does it fit here?
Johnny,
Currently all remaining federal airtankers (including the P-3s) are available… for now.
In regards to your comment about Station Fire ‘going out by itself’, were you there? Have you talked to any of us that WERE there? I’ll leave it at that.
Did the unusually large fires skew the actual “avg fire size”?
As an “absolute average” the figures would be deemed as correct.
As a “statistical average”, the average number of acres per fire is flawed unless some sort of weighted average is used, or if you throw out the anomalies at both ends of the spectrum… ie – the .10 acre fires (hundreds) and 50,000+ acre fires (few) per fire season for example.
It’s kinda like the difference between “average income” vs. the “median income” per se.
Just my $0.02 as a HSU nerd.
OK, let’s call it an “absolute average”. Tough crowd.