What a wet West Coast winter foretells for fire season 2023

The above-normal winter precipitation in California and over parts of the American West has already raised the question — even before the floodwaters have receded — of how this winter precip might either dampen the fuel beds or spawn a monster crop of fine fuels come spring and summer of 2023.

There’s a lot of winter and spring to come, and the first-of-the-month fire outlooks are 10 days out, but many are sensing that fire season in wetter locales will begin later. This delay is more likely in California, which is coping with a walloping by deep and repeated atmospheric rivers, resulting in near-record snowpack and flooding that may be familiar historically but not during the most recent drought decades.

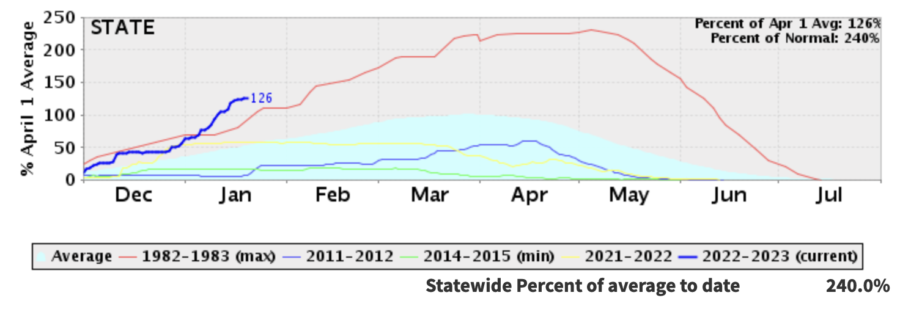
Consider the California snowpack as of Jan. 20, 2023. Whether by graph or map, the message is clear: the snowpack is significant and snowmelt periods will likely be extended. Statewide the snowpack is at 126% of the April 1 normal, but 240% for the current water year-to-date.

Calif Statewide Snowpack years 2023-01-20
California Statewide Snowpack as of Jan. 20, 2023. https://cdec.water.ca.gov/snowapp/swcchart.action

With a focus on California’s rapid switch from drought to flood, it’s clearly a banner water year to analyze — which is too painfully clear to the many who are working through a long recovery from flood damages estimated to exceed $1 billion. As CNN reported, at one point an estimated 90% of California’s population was under some form of flood watch, which equates to 10% of the US population.

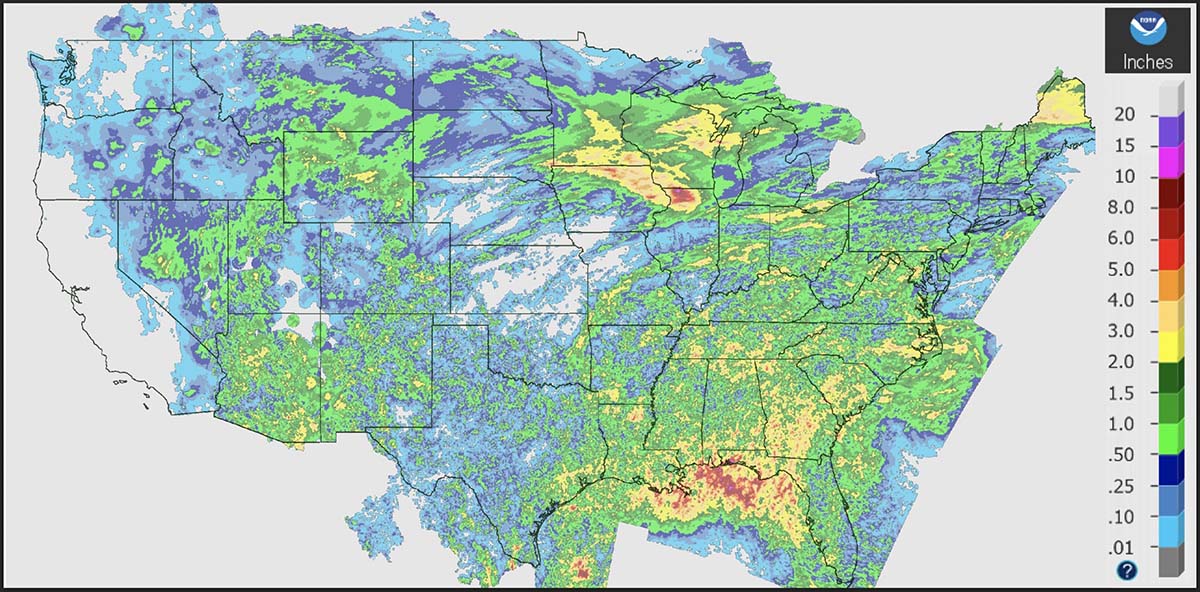
Per California Water Watch, the state is at 167% of average precipitation for this date, but storms aren’t a universal event. While the map for accumulated water year precipitation beginning Oct. 1 shows higher departure from average over most of the state, the most-intense  “purple” is being collected in the higher elevations in the central and northern mountains, and sopping the lower coastal regions that were hit full-force by the atmospheric rivers.

See California WaterWatch for regular updates.
See California WaterWatch for regular updates: https://cww.water.ca.gov

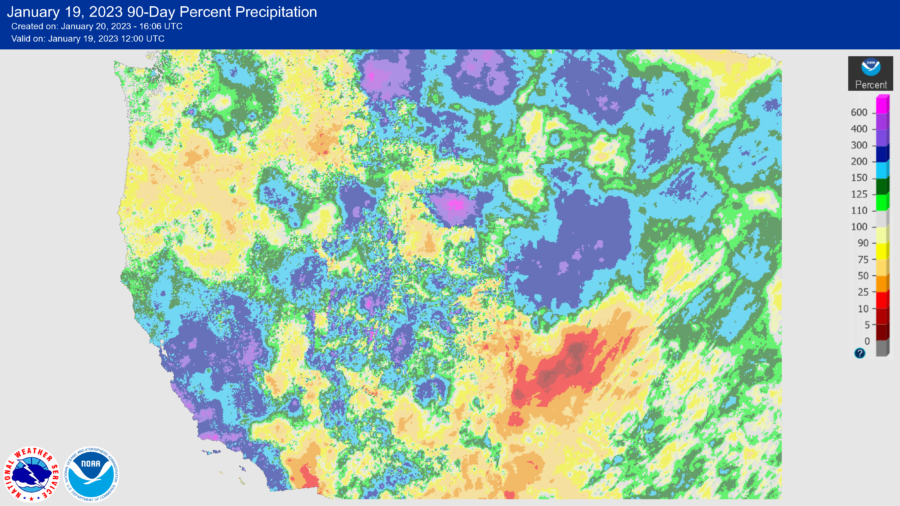
As damaging as the storms have been for so many communities, much of the West continues to feel the effects of long-term drought. A broader west-wide map of  precipitation of the past three months shows the patchiness of these bomb cyclones.

January 19, 2023 90-Day Percent Precipitation
Precipitation for the past 3 months.

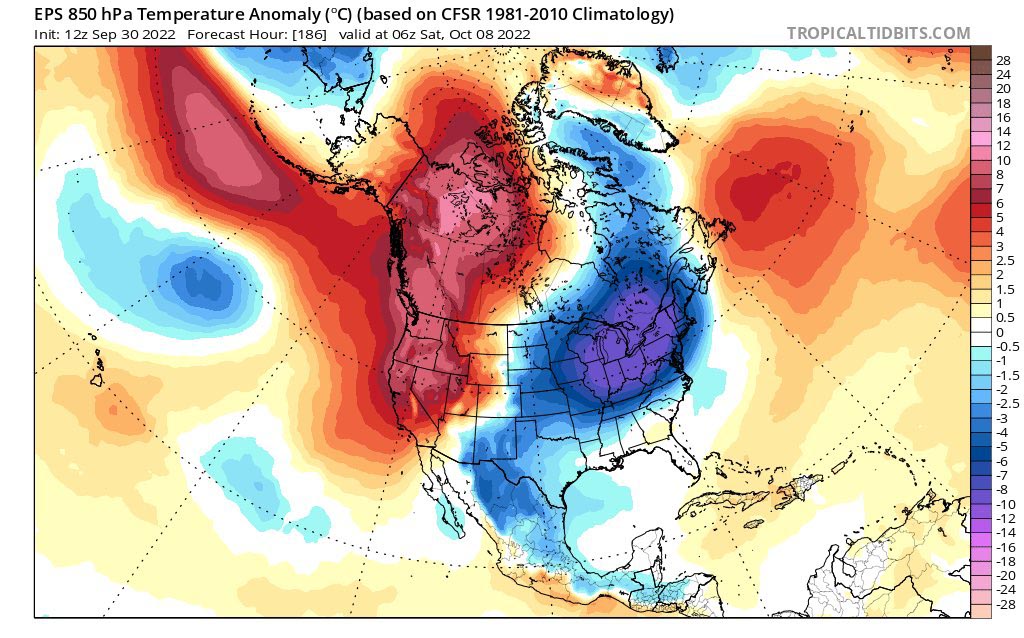
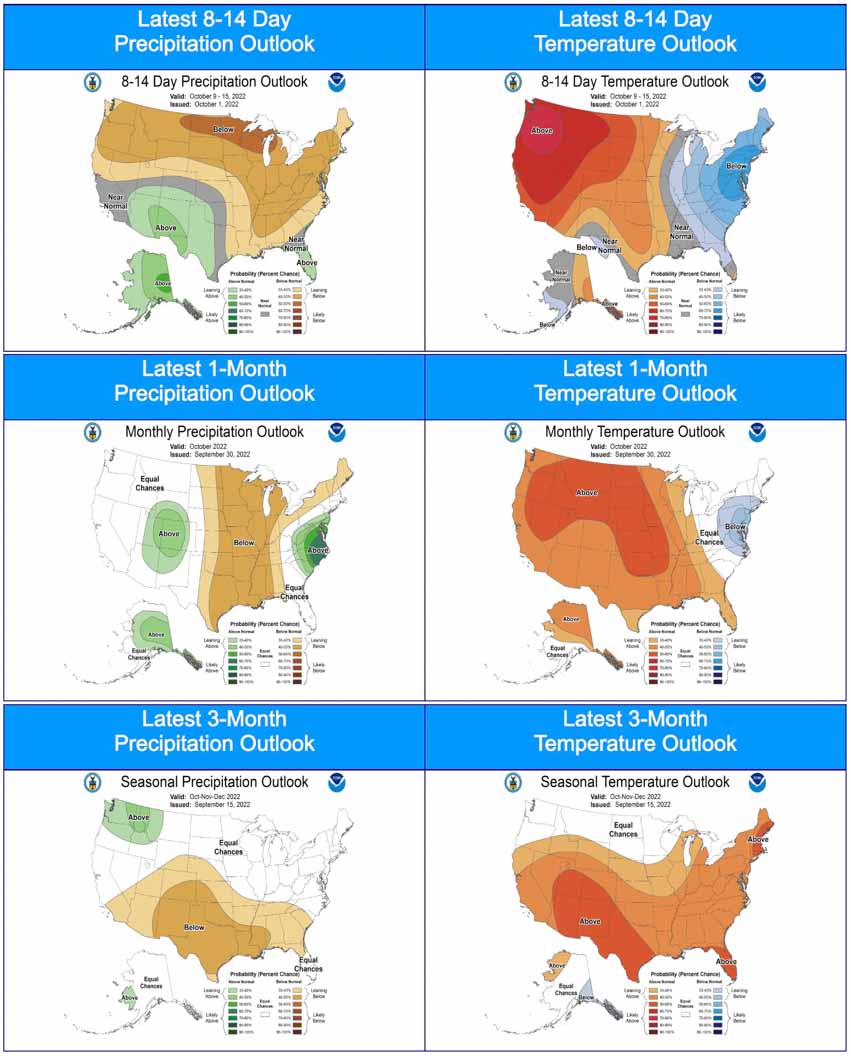
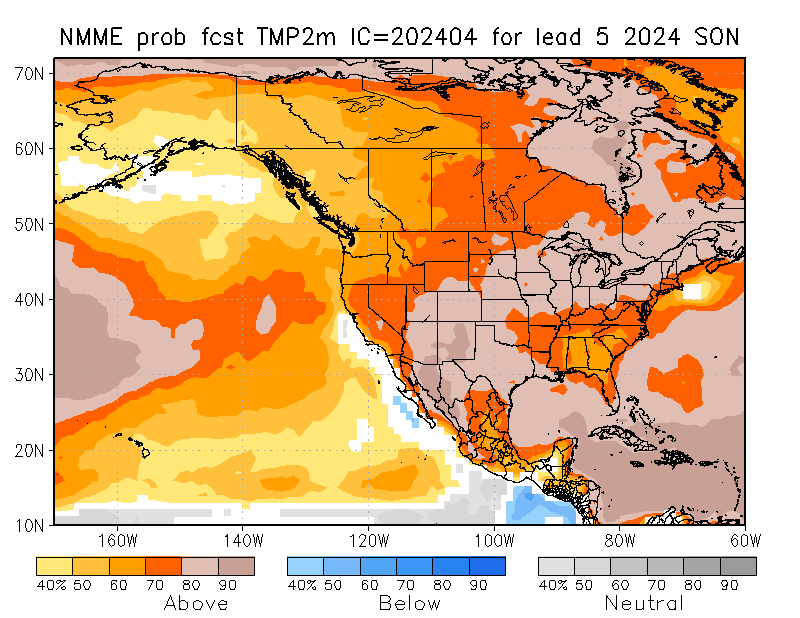
Looking ahead, a range of analysis tools foretell the potential of a warm summer and the likely impacts of long-term drought returning. The five-month lead for June-July-August (JJA), from the North American Multi-Modal Ensemble (or NMME), paints a warm picture for North America, with most of the U.S. West at 70% or higher likelihood for warmer than normal temps. Which will in turn elevate the evaporation potential during growing (and curing) season.

NMME ensemble temperature forecast for JJA 2023.
NMME ensemble temperature forecast for JJA 2023. https://www.cpc.ncep.noaa.gov/products/NMME/prob/images/prob_ensemble_tmp2m_us_season5.png

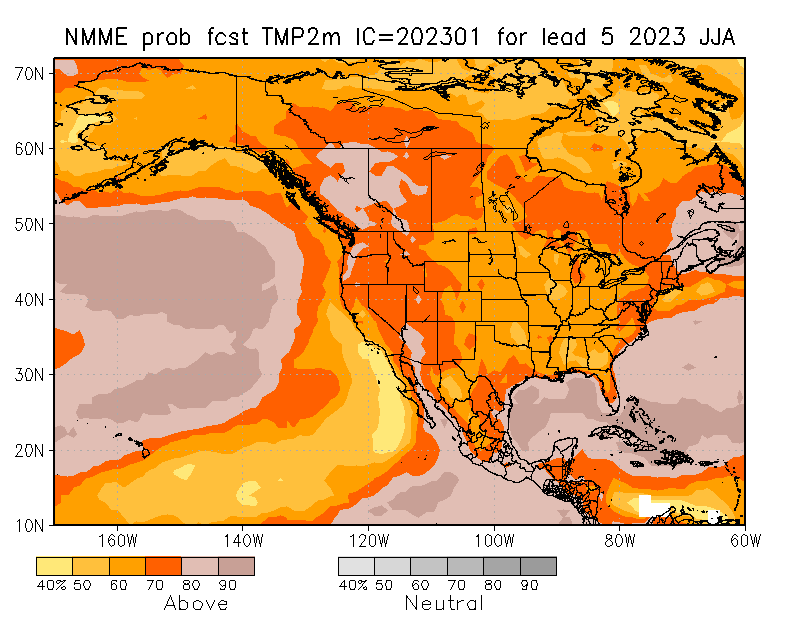
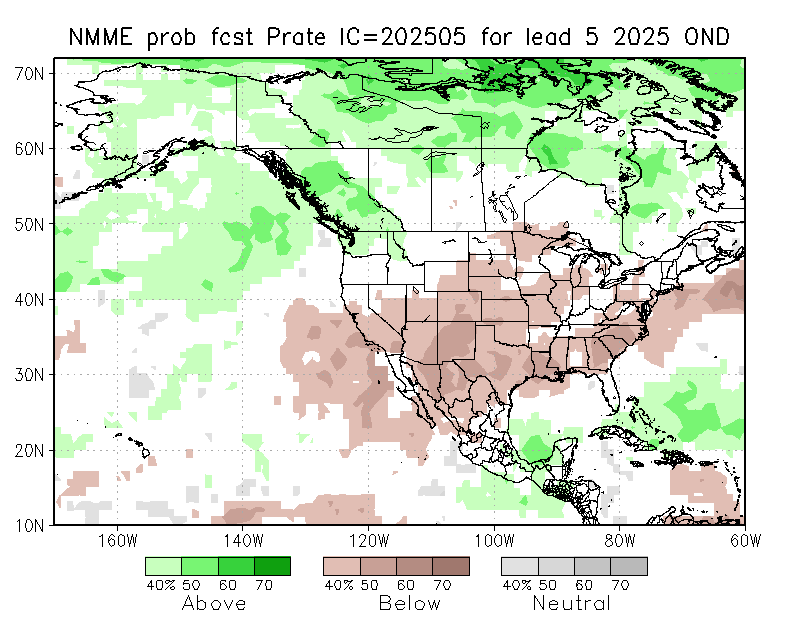
The same JJA outlook indicates a potential for most of North America to receive normal summer precip (though normal is often quite dry for much of the Western regions), with wetter likelihood for Alaska and drier than normal for western and northern Canada, the Pacific Northwest, the lower Mississippi Valley into Texas and south to Mexico and Central America.

NMME ensemble precipitation for JJA 2023. https://www.cpc.ncep.noaa.gov/products/NMME/prob/images/prob_ensemble_prate_us_season5.png

How these ensemble outlooks play out will depend in part on a projected switch from La Niña to neutral or potentially El Niño conditions. And the impact of the winter’s snowpack will depend on how early and warm the spring temperatures rise. More on that potential when we look at the February outlooks.

Thanks to the Analysts … Many of these resources are digested from the outlooks and links prepared and shared by National and Geographic Area analysts. So a thanks for the work these folks do, season in and season out. This update owes much to the analysts who produced the January outlooks for Northern California and Southern California.

Outlook for January 2023 – normal, with potential for Texas, Florida

It wouldn’t be a new year (or a new month) for US firefighters without the release of the monthly National Significant Wildland Fire Potential Outlook. For January 2023, from winter into spring, the outlook reflects the series of strong winter storms that have crossed the country west to east and a resulting reduction in fire potential. And with La Niña conditions continuing as the dominant weather influence through February, we will likely see a stormy winter and some moderation of drought … though a transition to neutral El Niño-Southern Oscillation (ENSO) conditions are expected to return in spring (with a 71% chance for neutral), when we may see other teleconnection patterns shaping spring and summer. 

For January 2023, significant fire activity is limited to far southern Texas, northeast Florida and southeast Georgia.

Significant Wildland Fire Potential - January 2023.


Significant fire activity for February and March is expected to expand from these areas … but by April, with typical spring green-up expected, the entire US can look for normal fire activity.

Significant Wildland Fire Potential - April 2023.

What is normal for January? While the Outlook doesn’t infer fire size or intensity in these outlook-maps, the monthly fire density maps do convey the expansion of what we often think of as prescribed-fire season — with normal fire activity typically focused in the south and southeast in mid-winter and expanding west and north as we move into April.

Normal Fire Season Progression - January.
Normal Fire Season Progression - April.

Here’s a permalink to the January 2023 Outlook.


Western states drought continues, but wildfire threat eases

Wildfire outlook, November, 2022

The wildland fire potential released today by the National Interagency Fire Center predicts no above average wildfire potential for the 11 western states for the next four months through February, 2023. However the Gulf and Southeast coasts will remain high during the entire period. It will also be high in the Southeast and the Mississippi Valley in November.

The fire potential text and maps from NIFC shown here represent the cumulative forecasts of the ten Geographic Area Predictive Services Units and the National Predictive Services Unit. Additional graphics are included from other sources.

Below:

  • Excerpts from the NIFC narrative report for the next four months;
  • Additional NIFC monthly graphical outlooks;
  • NOAA’s temperature and precipitation forecasts;
  • Drought Monitor;
  • Keetch-Byram Drought Index;
  • Soil moisture.

“Drought now covers nearly two-thirds of the contiguous US. Drought continues in much of the West, with expanding and intensifying drought in portions of the Northwest due to warmer and drier than normal conditions in October, including record setting temperatures.

“Near to below normal temperatures and near to above normal precipitation are forecast from the Northwest through the northern Plains into the Great Lakes. Below normal precipitation is likely from southern California and the Southwest through the southern Plains to the Gulf and Southeast Coasts through winter. Above normal temperatures through the winter are likely across California, the southern Rockies into Texas, and along the Gulf and East Coasts.

“Above normal significant potential is forecast for the Hawai’ian Islands for November before returning to normal potential through winter. The Texas Panhandle, western Oklahoma, and western Mid-Mississippi Valley to the southern Appalachians and northern Gulf Coast are forecast to have above normal potential in November before mostly returning to normal for winter as well.

“In December, above normal significant fire potential will remain across the Lower Mississippi Valley and northern Gulf Coast, with above normal potential remaining near the northern Gulf Coast in January. Above normal significant fire potential is then forecast to expand into southeast New Mexico, south and west Texas, southwest Florida, and the Southeast coastal plain in February.”


Wildfire Outlook, December through February

90- day Precip - Temperature forecast, issued Oct 20, 2022
90- day Precip – Temperature forecast, issued Oct 20, 2022

Drought monitor, Oct. 25, 2022

Drought Outlook, Oct. 31, 2022

KBDI Oct. 31, 2022

Soil moisture, calculated anomaly, Oct. 31, 2022

Wildfire potential shifts to the south-central states

wildfire potential map

The forecast for wildland fire potential issued October 1 by the National Interagency Fire Center predicts that the wildfire potential shifts to the south-central United States over the next several months. Most of California has received more than the average amount of rain recently.

However some of the Southern California mountain areas have not received much wetting rain, therefore the prediction there is for above normal fire potential in October and November, possibly into December. The first widespread wetting rain this fall will likely follow two to three offshore wind events in Southern California.

NIFC’s monthly forecasts are for the next four months, but in the shorter term, by the end of this week temperatures in the western US and Canada are expected to be 5C to 10C degrees above average for the date.

Temperatures week of Oct 2, 2022
Temperature anomaly October 9, 2022.

The fire potential text and maps from NIFC shown here represent the cumulative forecasts of the ten Geographic Area Predictive Services Units and the National Predictive Services Unit. Additional graphics are included from other sources.

Below:

  • Excerpts from the NIFC narrative report for the next four months;
  • Additional NIFC monthly graphical outlooks;
  • NOAA’s temperature and precipitation forecasts;
  • Drought Monitor;
  • Keetch-Byram Drought Index;
  • Soil moisture.

“Drought continues in much of the West, with expanding and intensifying drought in portions of the Northwest, Idaho, and Montana due to warmer and drier than normal conditions in September. Most of California received well above normal rainfall for the month and much of the Northeast did as well, helping to reduce drought in New England. Warmer and drier than normal conditions also occurred in much of the southern and northern Plains into parts of the Southeast, Texas, and Midwest.

“Near normal temperatures and near to above normal precipitation are likely for portions of the Pacific Northwest and northern Rockies into early winter. Near to below normal precipitation is forecast for the rest of the West through the southern and central Plains into the Gulf Coast and Southeast, barring any landfalling tropical cyclones on the Gulf and Atlantic Coasts. Near to above normal temperatures and near normal precipitation are forecast for the Midwest through the Mid-Atlantic and Northeast.

“Above normal significant potential is forecast for much of Oklahoma, Texas, the Lower Mississippi Valley, and central Gulf Coast into December. Above normal potential is likely for much of the Mississippi Valley in October and the western Ohio Valley through the Ozarks into November. Southern Area is forecast to return to near normal significant fire potential during January.

“The Transverse and Peninsular Ranges of southern California to the coast, areas prone to Santa Ana winds, will have above normal significant potential October through November, before returning to normal potential in December. The Hawai’ian Islands will continue to have above normal potential, especially lee sides, through November before returning to normal potential in December. All the US is forecast to have near normal significant fire potential during January.”


wildfire potential map wildfire potential map wildfire potential map

NOAA temperature and precipitation outlooks Drought Monitor, Sept. 27, 2022 KBDI October 1, 2022

Soil Moisture, October 1, 2022

Wildfire acres burned to date in United States (outside Alaska) is lower than average

Precipitation, 7 days
Precipitation, during the seven days ending at 11 a.m. MDT August 13, 2022.

It seemed to me that over the last few weeks the wildfire activity has been slower than typical for this time of the year, so I did a little digging. Using historical data from the National Interagency Fire Center and acres burned to date from the August 13 national Situation Report, it turns out that Alaska has burned nearly three times their 10-year to-date average while the other 49 states combined are running 12 percent below the to-date average.

Over the last 10 years Alaska’s average acres burned in a full year is 1.1 million. This year they are at 3.1 million, more than the other 49 states combined. There has been a major increase in Alaska acres burned after mid-August in only 2 of the last 18 years. And it has been fairly quiet there, fire wise, for the last four weeks.

So far this year, fires in the other 49 states have blackened about 2.8 million acres, 12 percent below the to-date 10-year average of 3.2 million. The 49 states typically burn 6.2 million in a full year, so if this year turns out like the average of the last 10, we’re about half done.

The Situation Report does not break out data for Alaska and the other 49 states, so just looking at their 50-state numbers a person would see that the 5.9 million acres burned to date is 27 percent higher than the average of 4.3 million, when actually the +27 percent figure is very wrong for both Alaska and the lower 49 states.

We usually separate Alaska stats because fires in that huge state are managed far differently from the other 49. Most of them are not fully suppressed since they are less likely to endanger people or private property than in the lower 49 states. The second reason is that the fire occurrence is extremely variable, with the acres burned since 1990 ranging, for example, from 43,965 acres in 1995 to 6,645,978 in 2004. Including the Alaska numbers in the total would skew the data for the other 49 states making it more difficult to spot trends.

Wildland fire potential for September, 2022
Wildland fire potential for September, 2022. NIFC.

Wildland fire potential for August, 2022
Wildland fire potential for August, 2022. NIFC.

Researchers find that nearly half of lightning down strikes in California occur with little or no rain

Researchers studied the climatology of dry lightning in California

Dry Lightning, California
(B) Total number of dry lightning flashes across three elevation zones (<1000 m, 1000–2000 m, >2000 m) within the domain for each month between 1987–2020. Text indicates the area of each elevation zone, and inset map shows the geographic distribution of the elevation zones and major mountain ranges. (D) The three elevation zones for each month (bars). Dashed lines in (D) indicate the dry lightning fraction averaged across all months for each zone. Blue dashes in (D) represent the dry lightning fraction computed from all months and elevation zones. (From the paper)

A group of six researchers who studied the occurrence and characteristics of cloud to ground lightning in Central and Northern California found that nearly half, 46 percent, was dry, accompanied by less than 0.1 inch of precipitation.

Of course dry lightning is the bane of land managers and is much more likely to ignite a wildfire than a wet thunderstorm. And on the occasions when there are thousands of down strikes, it can overwhelm the capacity to suppress what can be hundreds of fires.

The six scientists used daily gridded lightning and precipitation observations (1987–2020) in combination with atmospheric reanalyses, to characterize the climatology of dry lightning and the associated meteorological conditions during the warm season (May–October) when wildfire risk is highest.

The paper the group produced is available as open source: “Meteorological and geographical factors associated with dry lightning in central and northern California.”

Daniel Swain, a prolific user of Twitter, used the platform today to highlight some of the group’s findings. In the tweet below, click on “read reply” to see more discussion and illustrations.

The six researchers who participated in the project were Dmitri A. Kalashnikov, John T. Abatzoglou, Nicholas J. Nauslar, Daniel L. Swain, Danielle Touma, and Deepti Singh.