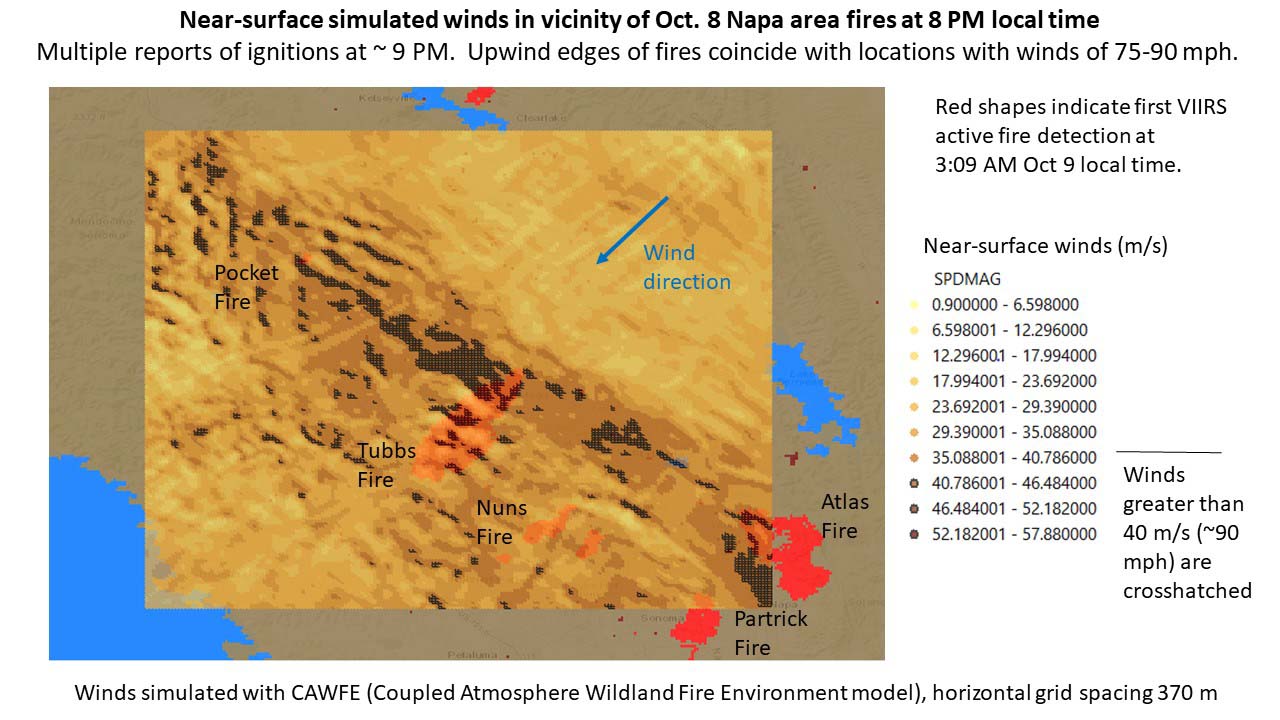
Above: Fine-scale weather model simulation (horizontal grid spacing of 370 meters) analyzing the surface wind when the Northern California fires started, 8 p.m. local time October 8, 2017. The darkest brown areas (with cross-hatching) indicate wind speeds greater than 40 m/s (~90 mph). The red shapes indicate heat from active fires first detected by a satellite (VIIRS) at 3:09 a.m. local time October 9, 2017. Simulation by Dr. Janice Coen, a Project Scientist at the National Center for Atmospheric Research in Boulder, Colorado. Simulated with the Coupled Atmosphere Wildland Fire Environment model.
(Originally published at 10:40 a.m. MDT October 30, 2017.)
More research into the weather conditions when the devastating October 8 wildfires started in Northern California indicates that hurricane force wind was one of the factors responsible for the extremely rapid spread of the fires that killed at least 43 people and destroyed more than 8,900 structures.
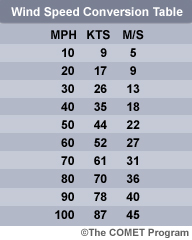
Dr. Janice Coen, a Project Scientist at the National Center for Atmospheric Research in Boulder, Colorado ran fine-scale weather model simulations (horizontal grid spacing of 370 meters) analyzing the wind during the time the fires started. Her research (see chart above) showed significantly higher surface wind speeds than previously thought — 75 to 90 mph just upwind of the major fires.
CAL FIRE has not released the causes of the October 8 conflagrations, but at about the same time firefighters were first responding to numerous fires, they also received multiple calls about fallen power lines and electrical transformers exploding.
California law dictates that power lines are supposed to be able to withstand 56 mph.
In an email Dr. Coen told us more about the October 8 wind simulation and her research related to fire weather:
“These early simulations suggest that within a wide area of strong winds, these small, local bands of extreme winds occurred where winds were perpendicular to the local ridge. And, that the location of the peaks and their peak speeds evolved throughout the event as the wind direction changed, in part due to the high pressure over the Great Basin moving along.
“I don’t have a lot of confidence that we’d be able to find evidence to prove or disprove if/when a particular simulated wind speed maximum occurred. And, although there is a lot of theoretical and laboratory work on stably stratified flow over objects, this three-dimensional terrain is too complicated to apply much of that.
“We’ve seen a sequence of devastatingly destructive fire events each driven by strong wind events – 2007 fires in southern California driven by Santa Anas, surprising destruction from a mountain downslope wind-driven fire in Gatlinburg, TN, and now this – yet fine-scale investigations of the mechanisms producing the peak winds and how they are distributed, particularly in relation to potential ignition sources, don’t really exist. And, though our forecast models may indicate strong gusty winds are possible, explicitly predicting how extreme the winds might be and where the most dangerous spots are with the detail shown here is beyond their capabilities.
“I hope to learn and share more about the mechanics of these events by visualizing these simulations, so we can see inside these events, prepare and anticipate, contribute to firefighter awareness and safety (as Diablo winds in general are a regional fire issue), and perhaps help potential ignition sources such as utilities manage the risk.”


