Global greening: another long term effect on wildfires

The predictions that climate change will result in higher temperatures leading to more wildfires has received a lot of attention in the last few years. But one effect that is under the radar is the effect that higher levels of carbon dioxide in the atmosphere will have on wildfires. Your first thought might be that oxygen is an important leg of the heat/fuel/oxygen fire triangle. Higher levels of CO2 might mean lower levels of oxygen which could affect the rate of spread of a fire.

The amount of CO2 in the atmosphere has received some notice recently as the level has approached 400 parts per million, up nearly 22 points from a decade ago, according to NOAA. Here is an excerpt from an article in the LA Times:

Current ratios of carbon dioxide in the Earth’s atmosphere remain at levels not seen in more than 3 million years, when sea levels were as much as 80 feet higher than current levels.

The article I just read at science.nbcnews.com did not mention if oxygen levels will be lower or what that effect may be. But it does say that higher CO2  levels will promote plant growth even in arid areas, which could mean more fuel available for fires and a higher resistance to control.

Analyzing only three decades of data makes it is difficult to attribute increased foliage to higher CO2 levels, but the 11 percent change that the researchers found is pretty interesting.

Below are some excerpts from the article about research by Randall Donohue, an environmental scientist at Australia’s Commonwealth Scientific and Industrial Research Organization:

Increases in CO2 also fertilize plant growth by making more carbon available to plants and allowing plants to lose less water to the air during the process of photosynthesis. Plants need carbon and water for growth. More of both, means more growth, Donohue explained.

To detect the effect in nature, he and colleagues focused on satellite imagery of warm and dry environments around the world where rainfall — the biggest factor in plant growth — is limited. This makes it easier to see vegetation growth in satellite imagery and account for the effect of rainfall.

The greening effect of increased CO2 is a global phenomenon. It is even seen in areas that are getting drier due to reduced rainfall and warmer temperatures as a result of global climate change, the researchers noted.

“If a brown place is getting drier, we can expect that the ‘browning’ won’t be as severe as it would have been if CO2 levels were unchanged,” Donohue explained. “Similarly, we can expect that the greening that would occur when a dry place gets wetter will be greater now because of higher CO2 levels.”

The implications of the findings are potentially significant, he added. For example, it could change how much carbon is soaked up by plants and the amount of woody fuel available for forest fires.

“It needs to be considered as an important piece of the overall global-change puzzle that we are still trying to figure out.”

How climate change may affect wildfires

Changes in area burned w-1 degree C increase in global temp
From National Academy of Sciences. Map of changes in area burned for a 1ºC increase in global average temperature, shown as the percentage change relative to the median annual area burned during 1950-2003. Results are aggregated to ecoprovinces (Bailey, 1995) of the West. Changes in temperature and precipitation were aggregated to the ecoprovince level. Climate-fire models were derived from NCDC climate division records and observed area burned data following methods described in Littell et al. (2009). Source: Figure from Rob Norheim.

Most of us have heard the predictions that climate change and higher temperatures will increase the number of acres burned in wildfires. But I experienced a Holy Crap moment when I saw the map above that illustrates where those changes will occur and by how much. According to a National Academy of Sciences paper titled Climate stabilization targets: emissions, concentrations, and impacts over decades to millennia, a 1°C increase in global average temperature will cause the annual area burned in the western United States to rise from 74 percent to 656 percent relative to the median annual area burned during 1950-2003.

Climate change is happening now, as we told you on January 8, 2013 (and in other articles tagged “climate change”):

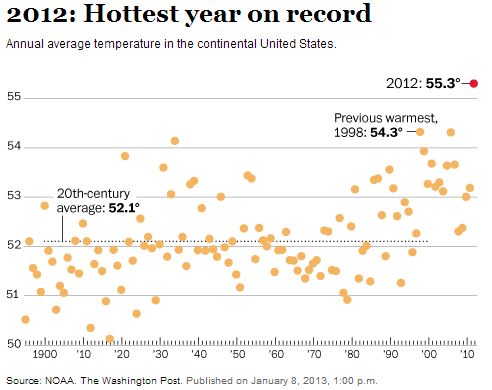
The National Oceanic and Atmospheric Administration (NOAA) is reporting that last year was the hottest on record for the contiguous United States, shattering CRUSHING by a wide margin the previous record set in 1998. The average temperature of 55.3 degrees Fahrenheit was 1 degree above the previous record and 3.2 degrees higher than the average for the 20th century. That is a huge difference.

Average size of wildfires by decadeWhat is wrong with this picture: fires are getting larger, and budgets for fire suppression are decreasing. If the predictions are correct, the number of acres burned will continue to increase even more. The people that beg for our votes and then get sent to congress need to not just write strongly-worded letters about the shortage of fire suppression resources, they need to realize that they hold the purse strings and it is their job to actually take action by approving budgets and passing legislation, instead of what happened in December. Letters are meaningless, meant to be a smoke screen to obscure the reality that little is being accomplished.

****

Below is a brief version of the paper referenced above:

Climate Stabilization Targets, Report in Brief


Record heat in northern and southern hemisphere

If you are one of the 18 remaining climate change deniers, you should stop reading now, because what follows will make you uncomfortable.

Northern Hemisphere:

Average temperatures, United StatesThe National Oceanic and Atmospheric Administration (NOAA) is reporting that last year was the hottest on record for the contiguous United States, shattering CRUSHING by a wide margin the previous record set in 1998. The average temperature of 55.3 degrees Fahrenheit was 1 degree above the previous record and 3.2 degrees higher than the average for the 20th century. That is a huge difference.

From the Washington Post:

Last year’s record temperature is “clearly symptomatic of a changing climate,” said Thomas R. Karl, who directs NOAA’s National Climatic Data Center. Americans can now see the sustained warmth over the course of their own lifetimes — “something we haven’t seen before.” He added, “That doesn’t mean every season and every year is going to be breaking all-time records, but you’re going to see this with increasing frequency.”

Southern Hemisphere:

Extremely high record-breaking temperatures and “catastrophic” fire danger ratings in Australia are not only contributing to the rapid spread of numerous bush fires, but they may cause some electronic gadgets to stop working. According to Wired, Apple advises that an iPhone should not be used when temperatures reach 95F (35C). In Sydney yesterday the high was 108F (42C).

The extreme weather is also causing problems for meteorologists when they attempt to display the highest ever recorded temperatures on their standard maps.

From Wired:

Australia’s Bureau of Meteorology had to add new colors to its weather map. Now, those unfortunate parts of Australia that achieve temperatures above 122ºF (50ºC) — temperatures that were, until recently, literally off the scale — will be marked in deep purple and terrifying hot pink. It is an interesting moment in data visualization history when climate scientists find themselves in the position of revising the upper bounds of temperatures they ever expected to depict.

It is possible that our electronics and our infrastructure were designed for a climate that we no longer have. When the streets and buildings of lower Manhattan were built, no one expected that they would be flooded by a hurricane. Apple did not design the iPhone for the recent weather in Australia.


Thanks go out to Clyde, Kelly, and Dick

Carbon emissions from fires doubles

Fire, Cascade, South Dakota
Lightning strikes near the Stage Hill Fire, Cascade, South Dakota, July 16, 2012. Photo by Bill Gabbert

NASA has analyzed the the effects of rising temperatures and wildland fire occurrence since 1984 and discovered an impressive fact:

Carbon emissions from [worldwide] fires have grown from an average of 8 teragrams (8.8 million tons) per year from 1984 to 1995 to an average of 20 teragrams (22 million tons) per year from 1996 to 2008, increasing 2.4 times in the latter period.

This is interesting. It documents the rising trend of wildland fire occurrence worldwide that we are are also experiencing in the United States. And since NASA predicts “increased fire activity across the United States in coming decades” it makes a person wonder how we are going to deal with more wildfires when we can’t handle the ones we are currently having.

Below is a news release from NASA:

==================================================

December 4, 2012

Climate Models Project Increase in U.S. Wildfire Risk

WASHINGTON — Scientists using NASA satellite data and climate models have projected drier conditions likely will cause increased fire activity across the United States in coming decades. Other findings about U.S. wildfires, including their amount of carbon emissions and how the length and strength of fire seasons are expected to change under future climate conditions, were also presented Tuesday at the annual meeting of the American Geophysical Union in San Francisco.

Doug Morton of NASA’s Goddard Space Flight Center in Greenbelt, Md., presented the new analysis of future U.S. fire activity. The analysis was based on current fire trends and predicted greenhouse gas emissions.

“Climate models project an increase in fire risk across the U.S. by 2050, based on a trend toward drier conditions that favor fire activity and an increase in the frequency of extreme events,” Morton said.
Continue reading “Carbon emissions from fires doubles”

12 years of fires on one map

Wildland fires, 2001 through July 13, 2012, IDVSolutions

IDV Solutions compiled data from the Moderate-resolution Imaging Spectroradiometer (MODIS) satellite to make this map showing heat produced by fires between 2001 and July 13, 2012 in the United States.  A high resolution version of the map can be found HERE.

IDV Solutions describes the map:

Each dot represents a moment of pretty extreme heat, down to the one square kilometer level (I only retained fires greater than 100KW MW and of those only fires that the system was more than 50% confident of). They’ve been colored and scaled by “units” of the typical American nuclear power plant’s summertime capacity to provide some sort of baseline of the fires’ magnitude.

There are a couple temporal charts in there, too. The seasonal curve I would expect, but the overall upwards trend was interesting (and 2012 is only half through). Is it related to a lag-offset El Niño or La Niña effect?

State of the global climate, 2012

The World Meteorological Orgnaization (WMO) has issued a “Provisional Statement on the State of Global Climate in 2012”. Some of their conclusions about the number of fires differ slightly from the stats we assembled on November 23, 2012.

The WMO’s document is lengthy, but below are some excerpts.

=====================================================

Global average temperature anomaly
Global average temperature anomaly. Credit WMO
Land and water temperature anomalies
Land and water temperature anomalies with respect ro 1961-1990 base period. Credit WMO

Wildfires 

Dry conditions, combined with the heat in the Northern Hemisphere during most of spring and summer 2012, contributed to devastating wildfires. Across the contiguous United States, the number of wildfires throughout the year was the least since 2000; however, the amount of acres burned per fire event during the same period was the largest on record.

Significant wildfires also developed in the Eurasian Continent. In Spain, over 184,000 hectares of land had been scorched by wildfires between January 1st and September 15th, the highest in a decade. The most notable wildfire ignited on September 24th in Valencia, forcing nearly 2,000 people to evacuate. In August 2012, southern parts of Bosnia and Herzegovina recorded a wildfire that burned nearly 5,000 hectares of land, causing nearly 83 million U.S. dollars in damage.

Drought

2012 began with severe to exceptional drought, as defined by the North American Drought Monitor (NADM), across the south central and southeastern contiguous United States and the northern half of Mexico. In the southern Plains of the U.S., the 2012 drought was a continuation of severe drought conditions which developed in 2011. Throughout 2012, drought conditions evolved across the United States, improving in some areas while deteriorating in others.
Continue reading “State of the global climate, 2012”