National MAC Group encourages use of Area Command Teams

Some members of the teams may lose currency due to a lack of assignments

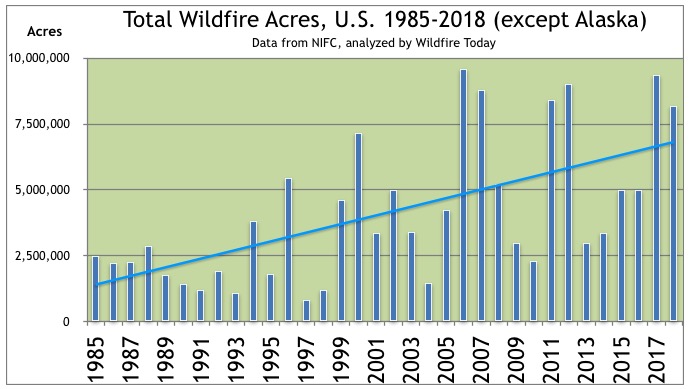
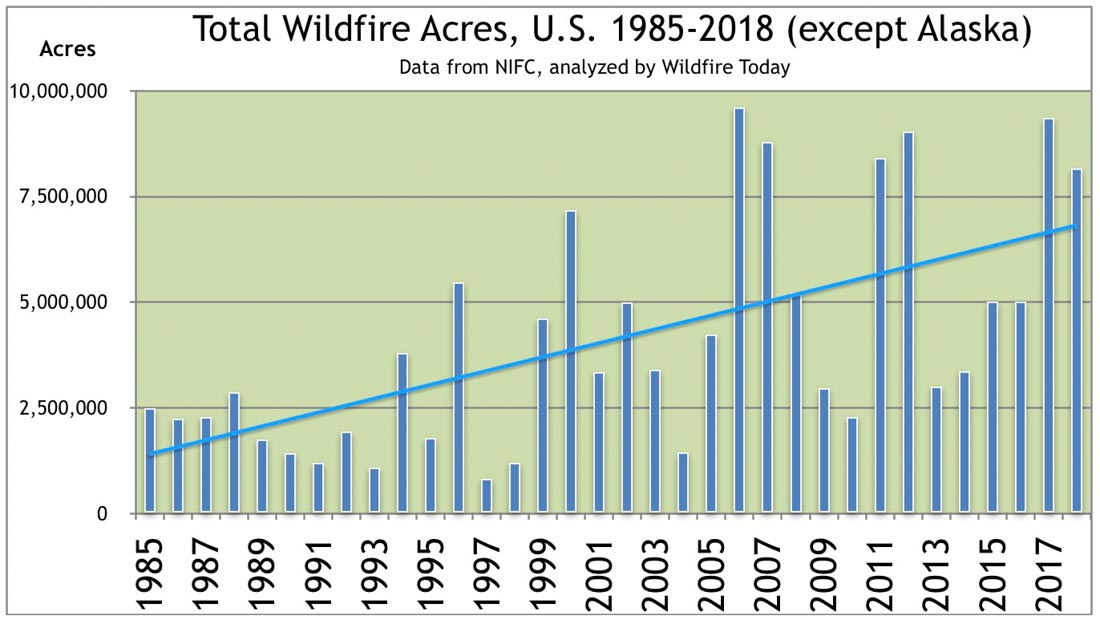
Total wildfire Acres Burned 1985-2018The use of Area Command Teams has been declining in recent years in spite of the trend of more acres burned nationwide and increasing average size.

In two of the last three years, 2016 and 2018, there were no assignments for Area Command Teams. In 2017 there were a total of five: Joe Stutler-2, Tim Sexton-1, and Rowdy Muir-2.  The number of ACTs was reduced from four to three in 2015.

The National Multiagency Coordinating Group (NMAC) which manages the ACTs, is concerned that if the teams do not receive assignments some individuals on the teams may lose currency in 2020.

Below is an excerpt from a letter sent by the NMAC on May 17, 2019 to Federal and State Agency Administrators:

NMAC is requesting your support with maintaining currency of the three federally sponsored Area Command Teams (ACT). These teams are a valuable part of our large fire management organization and have been underutilized during some of our most complex incident management situations.

Currently, within federal agencies (excluding Coast Guard), there are only three fully qualified Area Commanders (ACDRs) in the system. While the Area Command course, S-620 has been delivered this year, the lack of assignments may cause loss of currency of the ACTs in 2020.

ACTs provide strategic leadership to large theaters of operation while significantly reducing the workload for agency administrators and fire management staff. Common roles of ACTs typically include facilitating Incident Management Team (IMT) transitions, in-briefings, and closeouts. Additionally, ACTs coordinate with agency administrators, fire staffs, geographic areas, and MAC groups on complexity analysis, implementation of objectives and strategies, setting priorities for the allocation of critical resources, and facilitating the effective use of resources within the area.

We are concerned perceptions exist that ACTs can be barriers to direct communications between agencies and IMTs. As agency administrator, through your delegation of authority communicating your expectations to ACDRs, you have the opportunity to determine the role in which ACTs can best serve your needs. ACTs are committed to ensuring enhanced communications between agency administrators, fire managers, and IMTs.

NMAC request the support of agency administrators to exercise current ACTs in 2019 if and when appropriate.

It is surprising how many large complex incidents do not get a chance to benefit from the help that an ACT can provide. Even in 2016 when there were many large fires burning in Georgia, Tennessee, North Carolina, and South Carolina at the same time, no ACTs were mobilized. You might wonder if any of the fires, including the one that burned into Gatlinburg, Tennessee, would have turned out differently if there had been a group of highly skilled personnel looking at the big picture, helping to obtain resources, analyzing the weather forecast, and utilizing short and long range fire behavior predictions.

An ACT may be used to oversee the management of large incidents or those to which multiple Incident Management Teams have been assigned. They can take some of the workload off the local administrative unit when they have multiple incidents going at the same time. Your typical Forest or Park is not usually staffed to supervise two or more Incident Management Teams fighting fire in their area. An ACT can provide decision support to Multi-Agency Coordination Groups for allocating scarce resources and help mitigate the span of control for the local Agency Administrator. They also ensure that incidents are properly managed, coordinate team transitions, and evaluate Incident Management Teams.

National ACTs are comprised of the following:

  • Area Commander (ACDR);
  • Assistant Area Commander, Planning (AAPC);
  • Assistant Area Commander, Logistics (AALC);
  • Area Command Aviation Coordinator (ACAC); and
  • Two trainees.

They usually have an additional 2 to 15 specialists, including Fire Information, Situation Unit Leader, Resource Unit Leader, and sometimes others such as Safety, Long Term Planning, or assistants in Planning, Logistics, or Aviation.
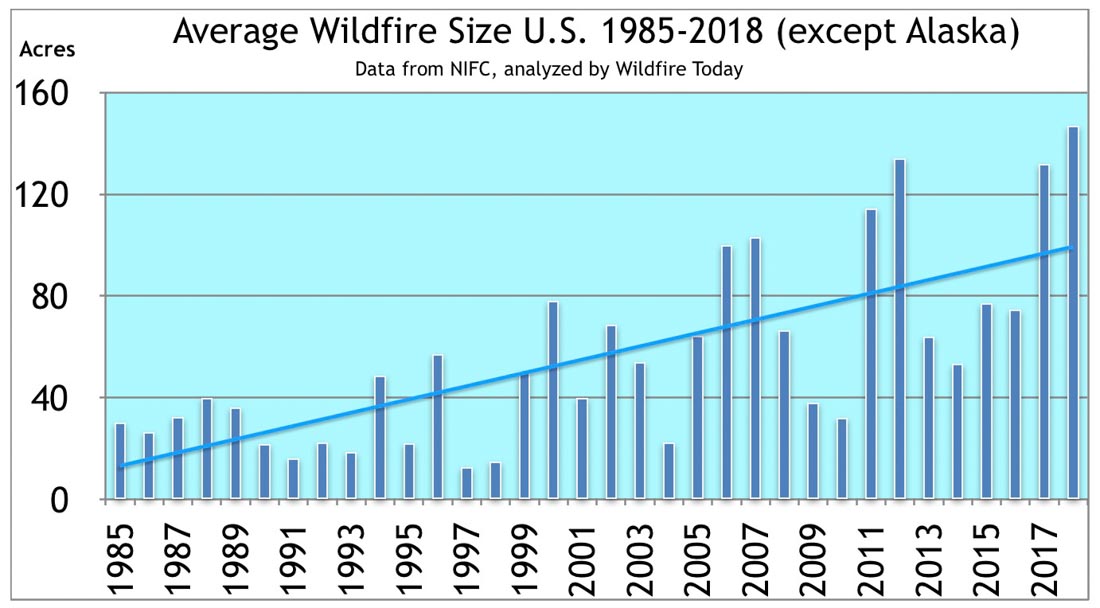
Average Wildland Fire Size, United States, 1985-2018
Average Wildland Fire Size, United States, 1985-2018.

Analysis of 865 fatalities on wildfires in Southern Europe

fatalities wildfires southern Europe

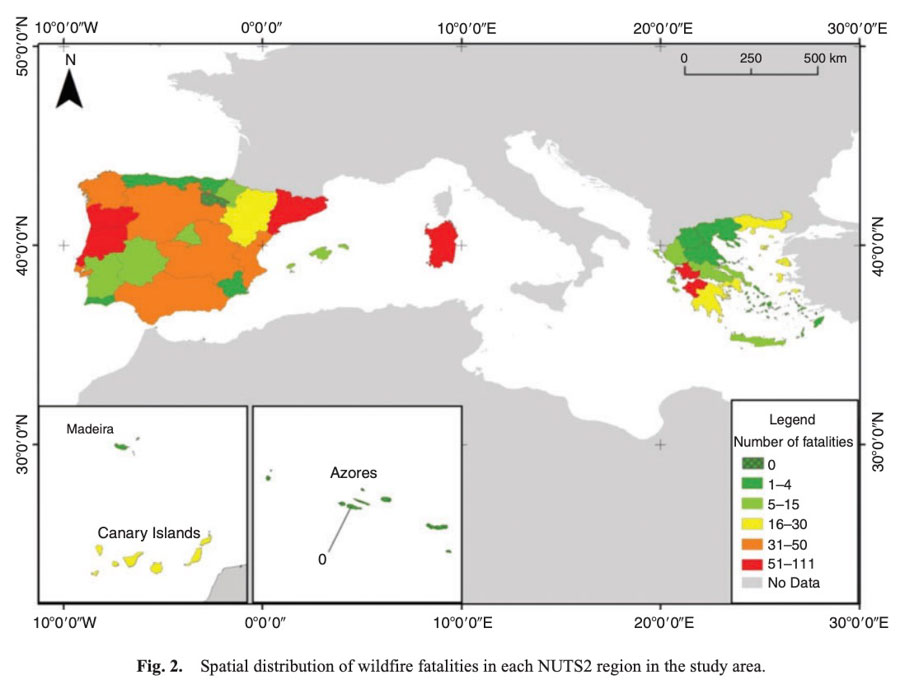
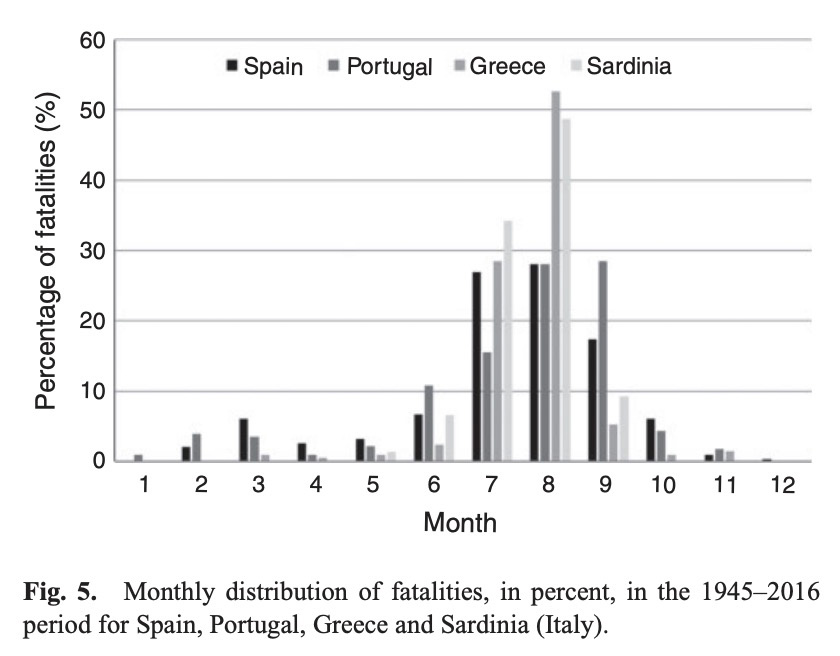
A paper published in January describes an analysis of 865  civilian and firefighter fatalities in Spain, Portugal, Greece, and Sardinia (Italy) from 1945 through 2016. They found that 77 percent of the fatalities occurred in the months of July, August, and September, and that Sardinia (a large Italian island in the Mediterranean Sea) had the highest rate of fatalities based on their population, 10.01 per million inhabitants.

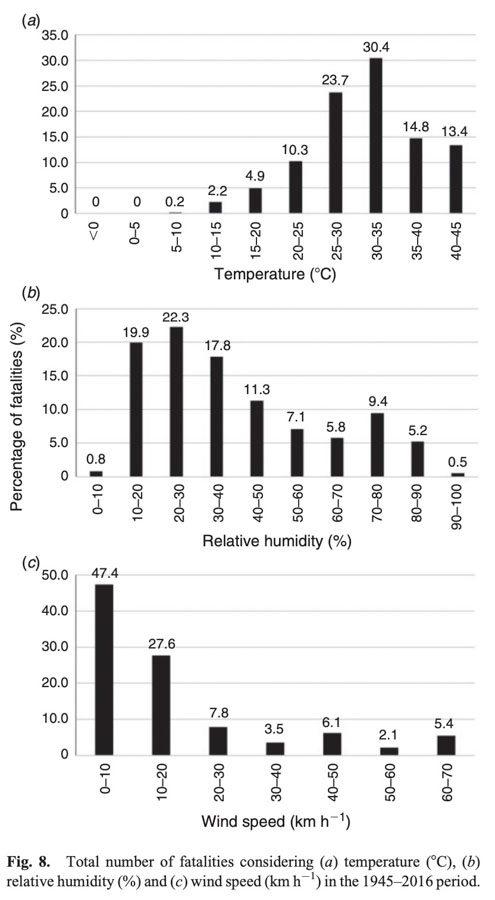
The leading cause of death was burns and suffocation, followed by health problems including heart attacks, physical trauma, respiratory problems, and exhaustion. Next was aviation accidents and then terrestrial accidents.

All of the images shown here are from the research paper.

fatalities wildfires southern Europe


fatalities wildfires southern Europe


A surprisingly high number of fatalities were the result of aviation accidents. Here is an excerpt from the document:

Aircraft-crew fatalities are not negligible, particularly in Spain, where 72 out of the total 96 fatalities reported occurred. This is alarming, although it can be explained to some extent by the heavy use of aerial-firefighting resources in Spain when compared, for example, to Portugal. Aerial firefighting is also heavily applied in Greece, although fatalities in this country are not just the result of the number of flying hours, but also of a host of other parameters still to be investigated and described by specialists. Indeed, an evaluation and a comparison between countries of these other parameters and operational protocols are needed.


fatalities wildfires southern Europe


fatalities wildfires southern Europe

Authors of the paper: Domingo M. Molina-Terre´n, Gavriil Xanthopoulos, Michalis Diakakis, Luis Ribeiro, David Caballero, Giuseppe M. Delogu, Domingos X. Viegas, Carlos A. Silva, and Adria´n Cardil.

Average size of wildfires continued to increase in 2018

The number of acres burned and the total number of fires decreased in 2018 from 2017

 1985-2018 wildfires average size decade

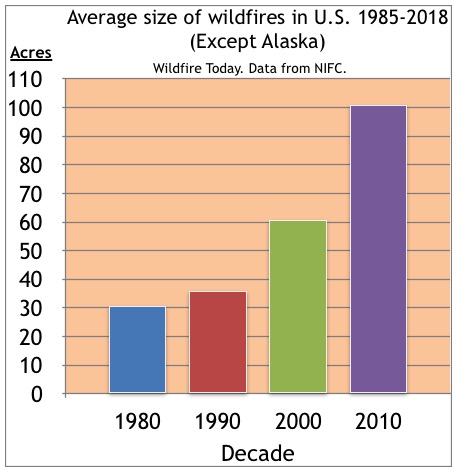
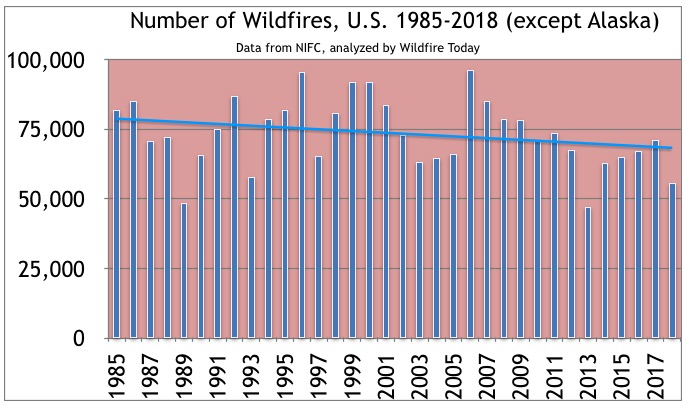
While the number of wildfires and the total acres burned both declined in 2018 the average size continued to increase. The number of wildfires has been trending down since at least 1985 and the average size has been increasing. There are variations in the number of acres burned from year to year roughly in five to six-year cycles, but in the late 1980s the average size of a wildfire in the U.S. was 30 acres. That number has increased every decade since, bringing the average for this decade (to date) up to 101 acres.

The number of acres burned and the total number of fires decreased in 2018 from 2017 by 13 and 22 percent respectively, while the acres burned was sixth highest since records have been kept.

If the five to six-year cycle for burned acres that we noticed in the data is real, and continues, we could expect lower numbers for the next three to four years beginning in 2019 compared to 2017 and 2018.

The raw data we used to construct these charts is from the National Interagency Fire Center, current as of December 21, 2018. The historical data for Alaska before 1990 which we used to determine the numbers for the other 49 states is from a paper published by the University of Alaska.

Wildfire Acres Burned 1985-2018

 1985-2018 wildfires total number

 1985-2018 wildfires average size

Forest Service now offers one-year contracts for air tankers

This may be a result of inadequate funding for firefighting by the Administration and Congress

(Originally published at Fire Aviation.)

number of large air tankers under exclusive use contract
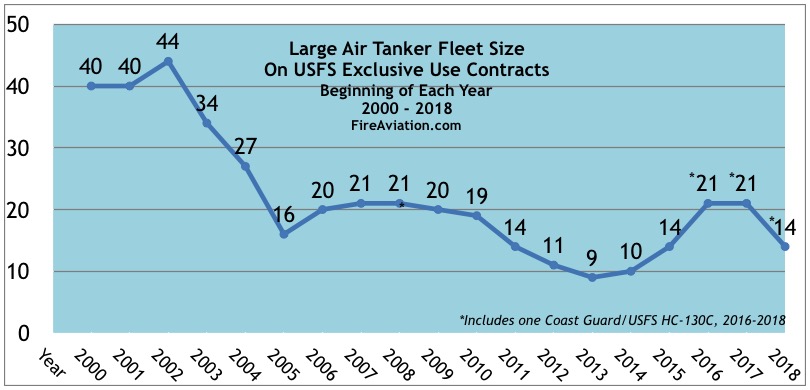
The number of large air tankers under exclusive use contract by the U.S. federal government, 2000 through 2018, at the beginning of the wildfire season.

The U.S. federal government has taken steps over the last 16 years that have reduced the number of large air tankers on exclusive use contracts from 44 in 2002 to 13 in 2018. After the wings fell off two air tankers in 2002 killing five crew members, the Forest Service, the agency responsible for managing the program, began cancelling contracts for World War II and eventually Korean War vintage aircraft that had been converted to fight fire.

BAe-146 dropping on the Bryant Fire
BAe-146 dropping on the Bryant Fire in Oregon, June 21, 2014. Photo by Chris Friend, ODF.

There was no substantial effort to rebuild the fleet until 11 years later when the USFS began awarding contracts for “next generation” air tankers. A few years after that the last of the 50-year old P2V tankers were retired. Following the half-hearted attempt at rebuilding the program, the total number of tankers on contract rose to 20 in 2016 and 2017, but by 2018 had dropped to 13.

The policies being implemented recently could further reduce the number in the coming years.

In 2016 the USFS awarded a one-year exclusive use contract for two water scoopers, with the option for adding four additional years. In 2017 at the end of the second year the USFS decided to not extend the contract for 2018. But during the 2018 fire season they hired the scoopers on a Call When Needed (CWN) basis. An analysis Fire Aviation completed in February, 2018 found that the average cost to the government for CWN large air tankers is much more than Exclusive Use aircraft that work for an entire fire season. The daily rate is 54 percent higher while the hourly rate is 18 percent higher.

The practice of advertising one-year contracts is now metastasizing, with the solicitation issued by the USFS on December 3 for one-year contracts for “up to five” large air tankers. These potential contracts also have options for four additional years, but could, like the scoopers, be cancelled or not extended at the discretion of the USFS. If the agency decides to award contracts for five aircraft, it would bring the total up to 18.

Earlier this year the USFS shut down the program that was focused on converting seven former U.S. Coast Guard HC-130H aircraft into air tankers. Now they are being moved to the aircraft boneyard in Arizona until the planes can be transferred to the California Department of Forestry and Fire Protection as required in legislation in August. From 2016 to the summer of 2018 one of the HC-130H’s was used occasionally on fires with a borrowed retardant tank temporarily installed.

Air tankers are very expensive to purchase and retrofit. Most of the jet-powered tankers being used today before being converted were retired from their original mission and are decades old, but two models of scooper or large air tankers can be purchased new. The CL-415 amphibious scooper cost about $37 million in 2014 but Bombardier stopped building them in 2015, and the new owner of the business, Viking, has not resumed manufacturing the aircraft. A new Q400 can be ordered from Bombardier with an external retardant tank for around $34 million.

Most air tanker operators in the United States prefer to buy retired airliners like the BAe-146,  DC-10, or variants of the C-130 and convert them to carry and dispense retardant. Retrofitting alone runs into the millions. Few if any vendors can simply write a check to purchase and convert an air tanker, so they have to convince a lender to give them large sums of money usually even before they have a contract with the USFS. With this new one-year contract policy, obtaining those funds could be even more difficult.

Below is an excerpt from the Missoulian:

“They’re only offering a one-year contract,” said Ron Hooper, president of Missoula-based Neptune Aviation. “We can’t go to the bank with a one-year contract to finance airplanes. They just laugh at us.”

Even if a vendor received a guaranteed five-year contract it can be difficult to establish and implement a long-term business plan that would make sense to their banker and the solvency of the company.

The province of Manitoba just awarded a 10-year contract for the management, maintenance, and operation of their fleet of seven water-scooping air tankers (four CL-415s and three CL-215s), supported by three Twin Commander “bird-dog” aircraft.

If the occurrence of wildfires was rapidly declining, reducing the air tanker fleet would make sense. However everyone knows the opposite is happening.

(The two charts below were updated February 2, 2019)

Wildfire Acres Burned 1985-2018

In the late 1980s the average size of a wildfire in the U.S. was 30 acres. That has increased every decade since, bringing the average in the 2010s up to 101 acres.

1985-2018 wildfires average size decade

More acres are burning and the fires are growing much larger while the Administration and Congress reduces the capability of the federal agencies to fight fires.

For the last several years Congress has appropriated the same amount of funds for the U.S. Forest Service, for example. But meanwhile, it costs more to pay for wages, fire trucks, office expenses, travel, and more expensive but safer more reliable air tankers. This leaves less money for everything including vegetation management, prescribed burning, fire prevention, salaries, and firefighting aircraft.

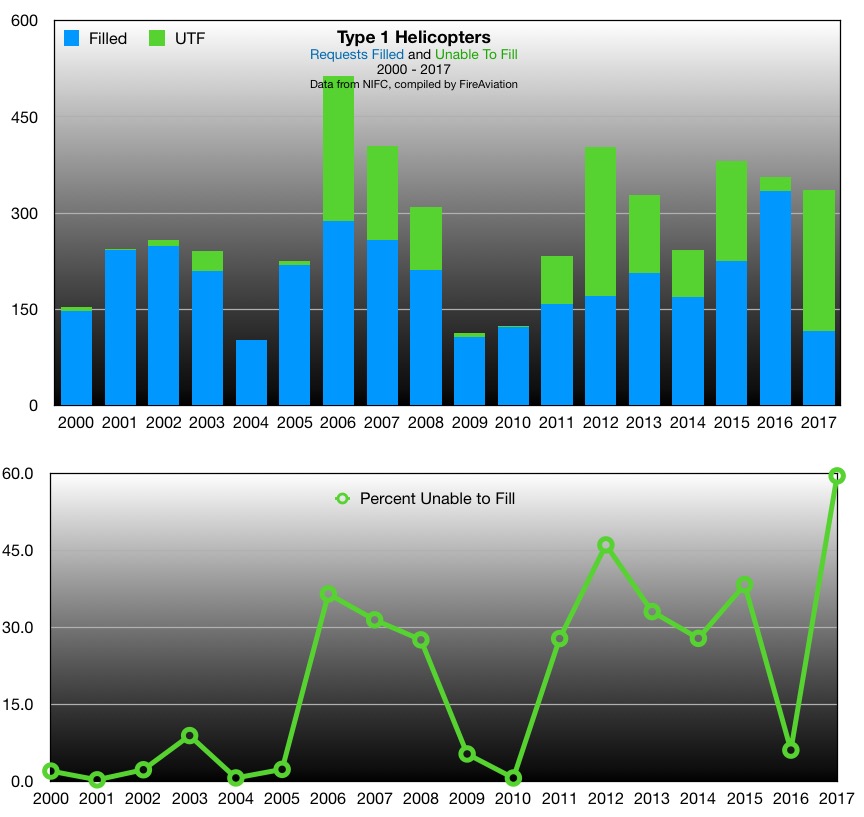
In addition to the reduction in air tankers, the largest and most efficient helicopters, Type 1’s such as the Air Crane, were cut two years ago by 18 percent, from 34 to 28.

In 2017 the number of requests for Type 1 helicopters on fires was close to average, but the number of orders that were Unable To be Filled (UTF) was almost double the number of filled orders. In 2017, 60 percent of the requests were not filled — 220 of the 370 that were needed. That is by far the highest percentage of UTFs in the last 18 years. The second highest was 46 percent in 2012.

number type 1 helicopters firefighting order requests filled
Aircraft can’t put out fires, but under ideal conditions they can slow the spread of a fire enough to allow firefighters on the ground to move in and put them out.

It might be easy to blame the USFS for the cutbacks in fire suppression capability, but a person in the agency’s Washington headquarters who prefers to not have their name mentioned said it is a result of a shortage of funds appropriated by Congress. The Administration’s request for firefighting in the FY 2019 budget calls for 18 large air tankers and intends to maintain the 18 percent reduction in Type 1 helicopters, keeping that number at only 28 for the third year in a row.

What can be done?

These one-year firefighting aircraft contracts need to be converted to 10-year contracts, and the number of Type 1 helicopters must be restored to at least the 34 we had for years.

In addition to aircraft, the federal agencies need to have much more funding for activities that can prevent fires from starting and also keep them from turning into megafires that threaten lives, communities, and private land. More prescribed burning and other fuel treatments are absolutely necessary.

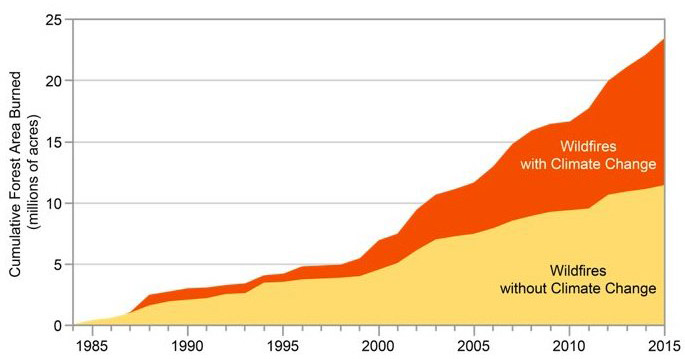
The only way this will happen is if the President and Congress realize the urgency and pass and sign the legislation. The longer we put this off the worse the situation will become as the effects of climate change become even more profound.

wildfires climate change
The cumulative forest area burned by wildfires has greatly increased between 1984 and 2015, with analyses estimating that the area burned by wildfire across the western United States over that period was twice what would have burned had climate change not occurred. Source: adapted from Abatzoglou and Williams 2016.

Visualizing California fires over the last 18 years

I love well designed graphics, and this one from Axios certainly falls into that category. It shows the time of the year wildfires larger than 300 acres occurred in California.

Click on the chart a couple of times to see a larger version.

Nearly a record breaking year for acres burned in the U.S.

Wildfires consumed 9.7 million acres in the United States in 2017

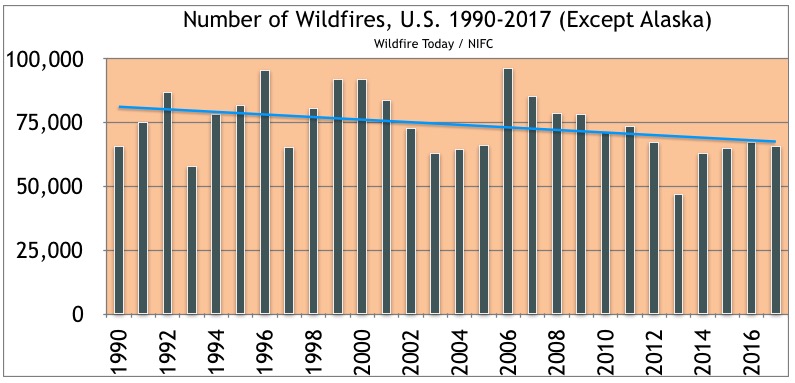
It will probably not come as a surprise to many, but the number of acres burned in the United States in 2017 came close to breaking a record. The numbers are preliminary and could change over the next few weeks as the data is finalized but the acres burned in the 50 states, 9,781,062, was the second highest since reliable records have been kept. That is 49 percent higher than the average over the last 10 years. Even as the trend line for the acres burned has increased dramatically since 1990 the total number of fires has generally been slowly decreasing. In 2017, 66,131 fires were reported, which was 4 percent lower than the 10-year average.


number of wildfires United States 1990-2017

But to look at the big picture, at Wildfire Today we like to analyze the national trends without the stats from Alaska, and there are two reasons why. Fires in that huge state are managed far differently from the other 49 states. Most of them are not fully suppressed since they are less likely to endanger people or private property than in the lower 49 states. The second reason is that the fire occurrence is extremely variable, with the acres burned since 1990 ranging, for example, from 43,965 acres in 1995 to 6,645,978 in 2004. Including the Alaska numbers would skew the data for the other 49 states making it more difficult to spot trends.

In case you are wondering why our charts only go back as far as 1990, we are not convinced that the information before that is reliable. In the data provided by the National Interagency Fire Center there was a very sudden, long lasting major shift in the numbers beginning in the early 1980s.

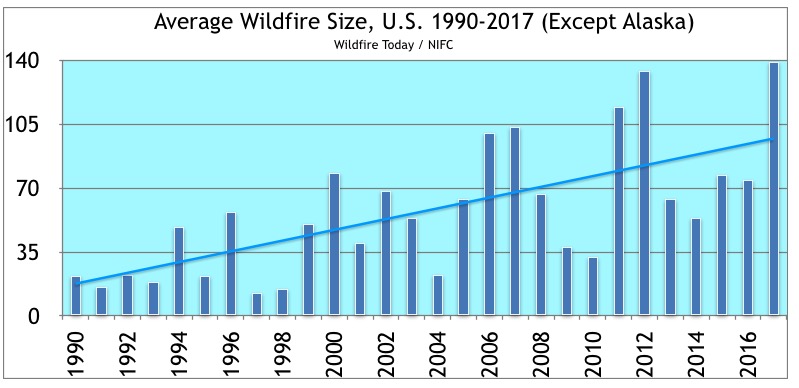
The sloping horizontal lines in the charts represent the statistical linear trend.

average size acres wildfires United States 1990-2017

A statistic that is quite interesting is the average size. The linear trend line starts at about 22 acres in 1990 and reaches close to 100 acres by 2017. In fact, the average size in 2017 was 139 acres. There could be a number of reasons for this huge increase:

  • Weather that is warmer and drier making fires more difficult to suppress.
  • One hundred years of fire suppression has led to forests that are more dense and fires that burn with greater intensity.
  • A less aggressive strategy is being used on large fires more often for safety reasons.
  • More fires are allowed to burn naturally without full suppression for environmental concerns.
  • There may have been a change in the initial attack of new fires, responding with less equipment and personnel.

Another factor to consider is that there was a gradual 30 to 70 percent reduction in the number of large air tankers on exclusive use contracts from 2002 until 2014 when the fleet began to be partially restored.