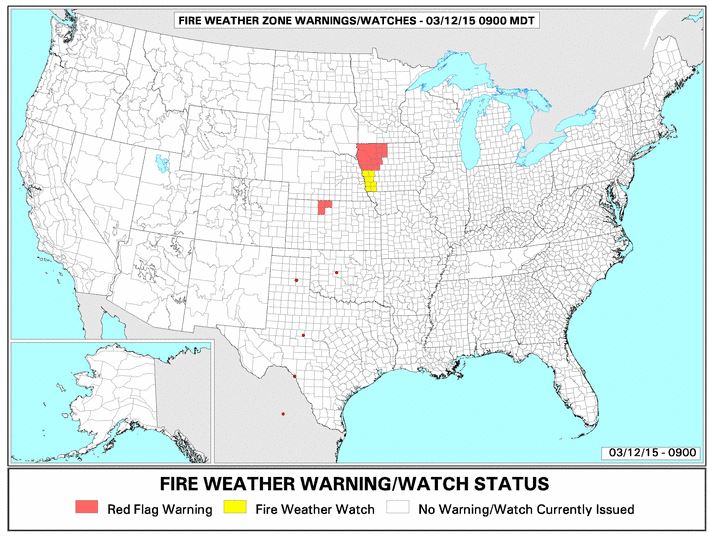
Today we have two very different versions of maps showing the location of Red Flag Warnings in the United States. Both of them were produced by NOAA and the screen grabs were acquired at about 9:35 a.m. on March 12, but one has Red Flag Warnings only in Iowa and Kansas, while the other also includes areas in Nebraska, Minnesota, and South Dakota.
When you go to the site of the first one as seen below, it is possible to click on an area which pulls up a window with a link to the actual text of the Red Flag Warning for that location. Some, but not all of the detailed forecasts for the three questionable states say the Warning will not begin until this afternoon, which may be part of the reason the second one does not include those areas. One feature I like about the second one is that it includes a date and time, something the first one does not have on the main map. It also may be significant that the second one is labeled “experimental”.
Other than the differences in identifying which areas are under a Red Flag Warning, which graphic image of the map do you prefer? We had been preferring the second one lately, because it is cleaner and has a higher resolution. But if it does not include all of the Warning areas for that day, the designers of NOAA’s “experiment” need to go back to the drawing board.


I can’t speak for the rest of the country but in Missouri the lines are county boundary lines. I think the rest of the states are the same.
I like the second map, but being in southern MN it is windy and dry.
Looking at the states I am familiar with, the gray lines that seem to be counties don’t correspond exactly with county boundaries. I don’t find any note on either map saying how they divide the states and what those areas represent.
They look like Fire Weather Forecast Zones.
I believe I saw the same issue last year, as Red Flag Warnings came into effect throughout the day. I agree, I like the resolution better on the second map. I would like to see something that shows predicted Red Flags, too, though. Maybe if the were crosshatched for a Warning or Watch that is predicted to become effective?