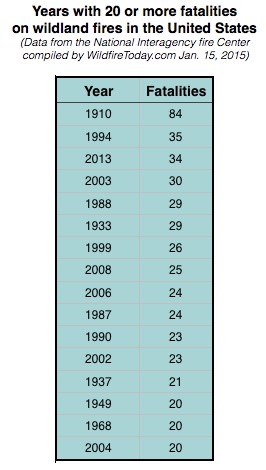
Last week Secretary of Agriculture Tom Vilsack reported that 13 wildland firefighters lost their lives in the line of duty in 2015. That was an increase from 2014 when there were 10 fatalities, and was about a third of the 34 that were killed in 2013 — that year included the deaths of 19 members of the Granite Mountain Hotshots near Yarnell, Arizona.
The National Interagency Fire Center has statistics about line of duty deaths going back to 1910. During that time, according to their numbers, 1,099 firefighters died.
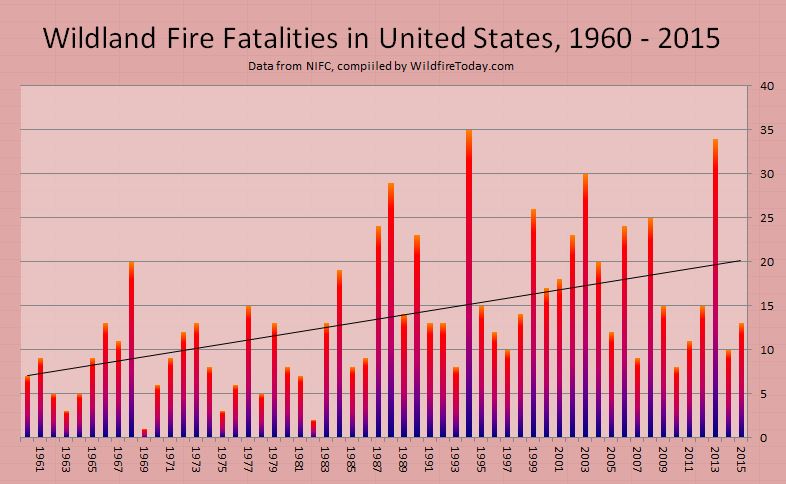
In looking at the 105 years of NIFC data there appears to be an increasing trend. The figures below are the average number of fatalities each year for the indicated time periods:
1910-2015: 10.5
1910-1959: 6.9
1960-1989: 10.2
1990-2015: 17.0
One likely explanation for the apparent increase is that 80 to 105 years ago probably not all fatalities were reported or ended up in a centralized data base, especially those that occurred on state or locally protected lands. Even if we only look at the figures since 1960, as in the chart above, it still shows a steep increase over those 55 years.
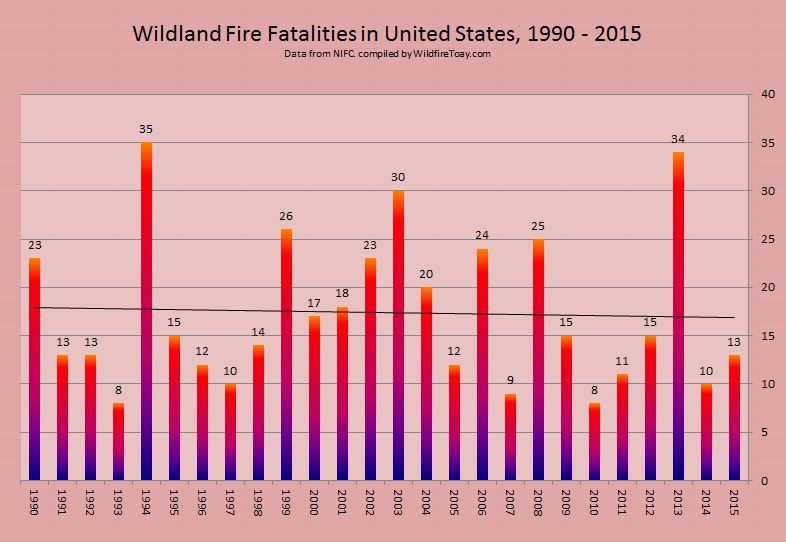
It is possible in the last 25 years the reporting of fatalities and the collection of the data has been somewhat more consistent and complete. The chart below covers that period, from 1990 through 2015, and has a slight downward trend, which would be even more obvious if not for the 19-person crew that passed away in 2013 on the Yarnell Hill Fire.
I can’t prove that there was under-reporting of wildland firefighter fatalities during most of the 20th century, but if a firefighter was killed on a vegetation fire in Missouri in 1921, I can see how that statistic may not have made it into the data base that is now maintained at NIFC.
So what does all this mean? Individuals can look at the same batch of statistics and develop vastly different interpretations. However, it would not be prudent to assume that the fatality rate almost tripled from the first part of the 105-year period to the last 25 years. There are several ways to analyze data like this. The least complex is to look at the trend of the raw numbers of fatalities year to year. A more complex and meaningful method would be to determine the fatality RATE. For example, the fatalities per million hours spent traveling to and working on fires. That would be impossible to ferret out during most of the last 105 years. But the firefighting agencies should be able to find a way to begin collecting this information, if they don’t have it already.
If the fatality and serious injury rates were calculated over a multi-year period, it should illustrate the effectiveness of a risk management program. Otherwise, the simple number of deaths each year might be affected to an unknown degree by the number of acres burned. Other factors could also affect the numbers, such as fire intensity influenced by fuel treatment programs, fire history, drought, climate change, or arson.
Should firefighting agencies have specific goals about serious injuries and fatalities? Is there an acceptable number? Is 5 a year too many? Is 15 too many? Is it stupid to have a goal of zero fatalities — or any number?
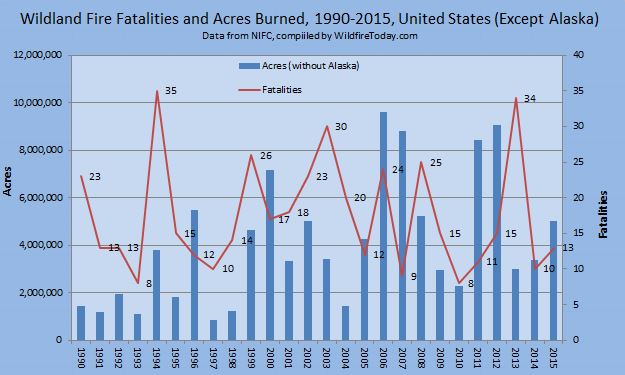
The chart below superimposes the number of fatalities over the acres burned in the United States from 1990 through 2015, but it does not include Alaska since many fires there are not suppressed, or they are only suppressed in areas where they threaten structures or people. In 2015 more acres burned in Alaska than all of the other states combined.
****
UPDATED January 17, 2016
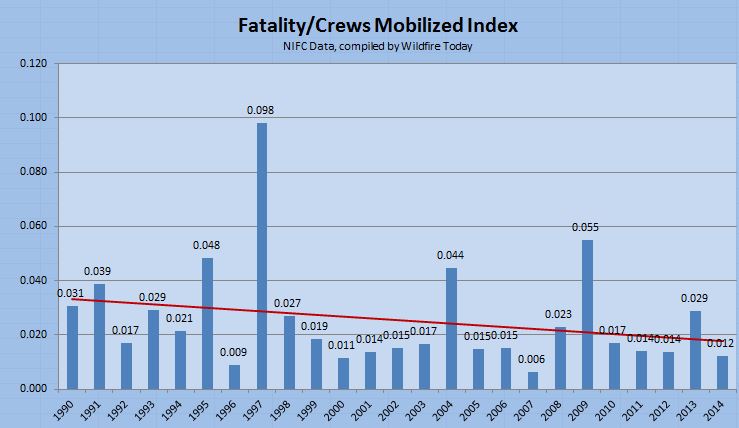
One of our loyal readers, Bean, has been thinking about this issue and figured that since the amount of firefighters’ exposure to risk is necessary in order to calculate trends, perhaps parameters other than acres burned could be correlated with the number of fatalities. Data that is publicly available as far back as 1990 or 1994 includes mobilizations of incident management teams, crews, overhead, helicopters, air tankers, air attack ships, infrared aircraft, MAFFS air tankers, caterers, military firefighters, and shower units. I considered all of those and concluded that the number of crews mobilized would come the closest to serving as a proxy for accurate data of how many hours all firefighters spent traveling to and working on fires.
Data for crew mobilizations is available from 1990 through 2014. I divided the number of crews mobilized by the number of fatalities for each year and called this the Fatality/Crews Mobilized Index.
Like the earlier chart comparing fatalities to acres burned, this analysis also shows a decreasing trend in the last 25 years. In a comment posted January 17, Kevin9 said the earlier acres/fatalities analysis is “spiky”. This newer crews mobilized/fatalities data also has spikes (especially in 1997 and 2009) but not quite to the degree the earlier chart had. During the 25-year period, 1997 had the least number of acres burned and crews mobilized, but still had 10 fatalities. The second lowest number of crews mobilized occurred in 2009 and there were 15 fatalities that year.
As an experiment, knowing that there were mass casualty events in 1994 and 2013 (14 and 19 fatalities respectively), just to see what the effects were, I changed the data in those two years to the average for the last 25 years, which is 17, and there was no major change in the trend line, except it was a little lower across the entire range.
It’s been a long time since I took statistics courses, but here’s what I came up with when analyzing the Fatality/Crews Mobilized Index data:
- Standard deviation: 0.019
- Mean: 0.026
- Coefficient of variation: 0.770
- Variance: 0.00037

Hello Bill,
Could you please clarify your number values listed as a mean of 0.026? Is that a mean correlation between mobilization and fatalities? I am trying to find a realistic ratio of odds of wildland firefighter fatality for training purposes. I have had some numbers thrown around that don’t make a lot of sense, and I have a lot of trouble trying to account for all the variables that would apply (number of active firefighters/year in all agencies and private contractors, number of wildfires supressed, quantifying actual exposure, and type of exposure, sorting through the counts available of fatalities recorded annually vs. actuality, etc.) Your article pops up when I try to search for fatality statistics. I don’t know if it is feasibly possible to find what I’m looking for, and I am most certainly no statistician. Do you have any recommendations?
If there were to be a reliable way to include injuries and near misses, the numbers might be big enough to be more useful for statistical analysis.
But if root causes aren’t consistently collated with accidents, we just might not know why those front right tires like to wander off the road.
How does NIFC define line of death? Do they include vehicle and aircraft accidents? What about fatalities that have resulted from taking the Pack Test?
What about strokes, heart attacks and other sudden medical calamities? What about training accidents?
I would agree that line of duty deaths outside the Federal system (especially among the volunteer ranks) are grossly underreported considering there is no real central reporting entity. The National Memorial in Colorado has some data but it doesn’t go back very far. NIOSH investigates fatalities but they have no searchable database that I am aware of.
As far as the statistical analysis goes, you are missing a major component in this discussion. Cause of death. We’re having a discussion about possible causes without any data. We’re having a discussion about human factors and burnovers when perhaps we should be talking about equipment failures and physical fitness. Human factors get all the attention because of events like Yarnell and South Canyon, where one bad decision can kill a lot of people other then the person making the poor decision. In hind sight it seems if we could just fix “this one choice” we could eliminate the large tragedies when in reality we humans are creative at screwing up and will find a new way the next time even when we know better. Car safety would be a good example of this. Do you think adding seat belts in cars or telling every driver for the last sixty years to slow down has saved more lives?
Don’t get me wrong, I am a huge proponent of focusing on human factors. I just don’t think it is the most effective way to address trends in fatalities on a national scale. Perhaps Kevin^^ is right about widespread complacency, but will another letter from the Chief or another fire refresher video actually affect change on a national scale? I feel that sometimes these methods are actually harmful in that they create environments where we “talk” about these things and create a sense that we have addressed them when really all we have done is create a couple more buzz words, clichés, and checklists without really discussing and understanding the issues or even more importantly how to affectively address them.
I think the other two theories above about successful suppression of IA and WUI incidents would be worth digging a little deeper on and possible to analyze at least generally through statistics. Made me stop to think when you were excluding Alaska from the acreage numbers. Maybe Alaska is the best “control” when trying to analyze numbers. I can only recall one death and injury from Alaska from my memory, both were equipment failures…
With an average of 17 fatalities over the last 25 years the annual numbers will never be smooth or without spikes. If there were more than 30,000 deaths each year, like with motor vehicles and firearms, there would be less relative variation from year to year and it would be much easier to see a trend. The wildfire environment is dynamic and volatile, but human factors may be what most influences the number of fatalities, and that is difficult to measure or predict.
We have seen some interesting discussion, on this article and others, about how to reduce the fatality rate. A large percentage of the fatalities on wildfires are caused by medical issues or accidents in vehicles and helicopters. In 2014 there were 10 deaths on fires, but none involved burnovers. Off the top of my head, here are a few areas that need to be emphasized in order to reduce the number of burnover fatalities:
–Realize that firefighter safety is far more important than protecting structures or vegetation. It’s hard to step back and watch homes burn, but it’s far more painful to watch a funeral.
–Increase the use of simulation tools such as sand tables and computers to train leaders. Try to make it as realistic as possible, but don’t keep throwing problems at the trainee until they fail. Point out mistakes, but the simulation director needs to avoid getting on a power trip. This occasionally was a problem when we used a simulator with a bank of overhead projectors and a rear-projection screen, a system that was extremely flexible.
–Find a way to make crew resource management more effective so that crew members feel empowered; if they see something, SAY something.
–The first things every firefighter should consider before committing to a fire suppression effort are escape routes and safety zones. After that, anchor, flank, and keep one foot in the black.
–Utilize existing technology that will enable Division Supervisors, Operations Section Chiefs, and Safety Officers to know in real time, 1) where the fire is, and 2) where the firefighters are. The Holy Grail of Firefighter Safety. When you think about it, it’s crazy that we send firefighters into a dangerous environment without knowing these two very basic things. Tom Harbour told me that he was very concerned that, for example, someone in Washington would be accessing the data from thousands of miles away and order that a firefighter move 20 feet to the left. That can be managed. Making the information available to supervisors on the ground can save lives.
I analyzed the fatality data another way, comparing it to the number of crews mobilized, rather than the acres burned each year. It should come closer to serving as a proxy for accurate data of how many hours all firefighters spent traveling to and working on fires. I added it at the bottom of the article.
Thanks Bill for putting up the additional data! I still see the same general pattern of multiple years of fairly constant fatalities/ mobilized crews followed by a spike. The period is longer, 3-6 years, and it’s a little flatter overall, but the basic pattern is still there..
Where it gets strange is correlating this data to the previous data of total fatalities and acres burned. Every year where there’s a spike in the fatalities/mobilized crews was an average or below average year for acres burned, and except for 2013, was also a low year for total fatalities.
The trend line does seem to indicate that there is steady improvement in firefighter safety. What the data does not appear to do (yet) is support reliable prediction of fatalities. Then again I’m not a statistician either. Maybe there’s a more sophisticated distribution that fits the data better.
The number of fires have increased. Number of acres ha e increased. Number of WUI areas have increased. Number of boots on the ground have increased(debatable i know) Number of outside distractions have increased. Number of fatalities have increased.
Seems logical to me, and I’m not a PhD.
While that theory sounds logical, and may be true over a 50 year period, but I’m not sure the data for the last 25 years shown in the last figure above really supports it.
What strikes me is how spiky the fatality data is. With the exception of ’06-’08, there will be 2-4 years of average/below average fatalities followed by a year where there are ~2x the number of fatalities over the prior 2-4 years. What’s even more interesting, and to me calls the more fire, more WUI = more fatalities theory into some question, is the poor correlation between the fatality spike years and years where fire acreage is up over previous year(s). The correlation rate is about 50%, and there are 5 years where the acreage spiked but fatalities didn’t.
I wonder whether more human factors are the reason. One possible explanation could be that people get complacent, a big fatality incident or year happens, the response is increased caution driving down fatalities, but then complacency starts to set in again. Lather rinse repeat.
This is interesting. Thanks for posting the data. Then again as MT said there are “lies, damned lies, and statistics.”
Surely you’re not suggesting that fire conditions have not changed over the past several decades, and that the upward trajectory we’re experiencing in size, severity, damage, cost, etc is due to a perceived retreat from aggressive tactics? If we look back at some of the foundational fires that have formed our culture and informed our current safety and risk management standards, many which occurred long ago, there was nothing but aggressive tactics in-play. Smart IA is important, but we must recognize that even in those early stages, given current conditions, some fires are not “sleeping giants”.
I firmly believe that the vast majority of the fatalities over the past 20 years have been due to the fact that tactics have changed or less than aggressive tactics were pursued during IA. There is a perception that it is safer to pull back or not commit a heavy response to an incident, “because it’s only brush.” The South Canyon Fire is a good example. How many days did it burn before equipment was put on it? Certainly everyone experiences equipment shortages, and priorities have to be made, but equipment was available to hit that fire. Air Tankers sat on the tarmac while the fire burned in the IA – extended phase. It would have been better to have turned the hillside red, kept the footprint of the fire small, and given the troops a chance to cut a line around it ahead of the cold front.
The fuels have changed, but not appreciably. The most notable change in California has probably been in the Ponderosa Pine forests, but the chapparel in So Cal is the same that it was 40 years ago. The soil can only support so much fuel. It might have a higher dead to live component, but overall, the fuels that faced the troops during the Decker Canyon Fire, are similar to what covers the hills today. If the fuels need to be reduced, take advantage of days like were recently highlighted on this site where the spread can be definitively controlled.
Catastrophic blowups have plagued the nations wildlands since the dawn of time. The idea that fires were docile or were easygoing under burns prior to the start of the out by 10 am policy isn’t true. Peshtigo and the Big Burn are both good examples. I firmly believe that “Safety” has led to a less than aggressive pursuit of fires, and allowed fires, which could have been kept small, to grow and in the end kill people. Last season I saw troops hit the pumpkin time, drop what they were doing, and head back to camp without leaving anyone on the line – allowing the opportunity for the fire escape, and keep burning. It absolutely kills me that people don’t engage at night anymore; that is the time to eliminate the hazard.
If this trend is true, it is extremely sad. I’ve noticed that tactics have changed considerably over the past few years; people are much less apt to be aggressive – less direct fire attack. I firmly believe that it creates a much more complex and dangerous fire in the long run. Whether you look at the Yarnell HIll tragedy, the South Canyon fatalities, or the Station Fire fatalities, the incidents were lost in the initial attack to extended attack phase – primarily because resources were not harnessed to hit fires hard.
Anchor and flank with a mass of resources are time honored traditions that create the safest fire situation – extinguishment.
I’ve heard a lot of discussion that fire is a natural part of the environment and if the fuel is burned off and allowed to return to the way it was 100 years ago, the large destructive fires we have today would be decreased. That is not true. Environments that have had little to no fire suppression still have large stand replacing fires (Alaska). Large destructive fires are produced by high winds and low fuel moisture. It is far better to mobilize early and hit fires hard than risk allowing a sleeping giant to escape and hurt people. Nature will never be the same that it was 100 years ago; don’t risk lives or property by trying to recreate it.