What happens when a power company decides to turn off the electricity for millions of residents?

The preemptive power shutoff for 800,000 addresses by Pacific Gas and Electric in Northern California is directly affecting approximately two to four million residents. The power company took this action to prevent their feeble power line system from starting fires during this period of strong winds. Farther south in California, San Diego Gas and Electric has warned residents living at 30,000 addresses that their power could also be turned off this week.

The indirect effects of having no electricity expand to a much larger  population when you consider traffic lights not working, tunnels on highways being shut down, plus the closure of gas stations, schools, and businesses. At some point cellular telephone towers and infrastructure may exhaust their emergency power supply systems, not to mention the batteries in the public’s cell phones.

Firefighters’ communications could be hampered by the disabling of their radio repeaters on mountain tops. Notifying residents of approaching fires and conducting evacuations in order to save lives could be challenging.

All that is the assessment of someone hundreds of miles away. For the thoughts of a person much closer to what is actually happening on the ground, we turn to Rob Carlmark, a meteorologist for ABC10 in Sacramento, who is surrounded by areas affected by PG&E’s power shutoff. Here, with his permission, are samples of what he has been writing on his Twitter account, @rcarlmark:


10:25 a.m. October 9, 2019

So here is what’s happening on the ground in California for the fire weather story. It’s genuinely freaking everybody out. If we get ZERO fires out of this (small miracle) the power shut off will be remembered for a long time. #MorningBlend10

Rob Carlmark
Rob Carlmark photo.

Despite the pretty large media effort by PG&E to warn people of the power outages…many people we are talking to at closed gas stations had no idea. Turns out not everyone…especially in rural areas look at the internet all day. Some of these folks were BLINDSIDED. We have to take them at their word because they are far away from the windiest areas affecting lines or COULD affect lines. Many work far away, and fuel up often. If you are at a gas station…let’s face it you NEED gas and maybe can’t drive 15-20 miles away to get it…or wait in long lines to get gas. They also have an unexpected day off work…maybe cancelled school..kid/kids to pick up and figure out what to do for DAYS with no power. Of course the alternative is having power on…and a well known source for fires active.

This is a tough spot to be in for 100,000s of customers which likely includes million+total in actual population if you extrapolate for households etc.

They are not going to reimburse people for spoiled food since it was planned. If an outage was caused by an extreme event and weather they might…case by case basis.

Also remember a lot of these people just got hit with a non-renewal for home insurance and if they found someone…it costs drastically more. Also remember that many of these people are actively trying to move…sell their home…can’t find insurance for new buyer or are dropping their prices all the time. This is the APEX of stress in some of the most beautiful places you ever could live.

We need to add more places… the Bay area is about to find out today if one of the major tunnels…MAJOR…will have to shut down for power outages at noon. Traffic there is a true daily horror show…and if you find this out…at work you are going to freak.

We haven’t even talked about Southern California…they too will experience massive outage issues potentially…STRONGER winds and LOWER humidity.

WE HAVEN’T EVEN HAD A FIRE YET! If that happens…which the odds are fairly high…it immediately turns into a dangerous life-threatening event with little info, or ways to get info (no power…no gas).

Finally…peak wind will be middle of the night [Wednesday night/early Thursday]. It’s not just about power…there are DOZENS of ways fires start and any fluke accident could set up many communities for a dangerous moment.

If we can get through this…the power might not come back on for a few DAYS in some areas after the fact (no strong winds) while they inspect lines. fire or not this story will continue for many days more.


4:19 a.m. PDT October 10:

Update from what’s going on in California with this fire weather/power outage emergency. We are right in the thick of it and it’s not over yet.

We had a VERY close call in a town called Moraga near the Bay Area overnight. Fire broke out near a nice suburb surrounded by open land…a true urban/wildland interface situation. It was dicey, scary and in the middle of the night…gusts were 35mph+ nearby and evacuations were door to door with no cell service and power shut off.  By the hard work of firefighters and perhaps the advantage of having roads and access the fire is mostly contained and a nightmare scenario has been avoided…for now.

From what we can tell this is an area with a planned power outage and it’s a reminder that a fire can start form dozens of different ways…not just power arcs. We don’t know cause, but since the power was shut off there it’s worth exploring other causes

Supplies are running really low in power outage areas…water, flashlights, generators etc. have been in short supply like a true disaster emergency situation.

Easily the biggest complaint is “It’s not windy at my house…the power should be back on” Gusts near the dams/hydropower/transmission lines though are VERY strong up to 52 mph so upstream impacts are creating downstream confusion
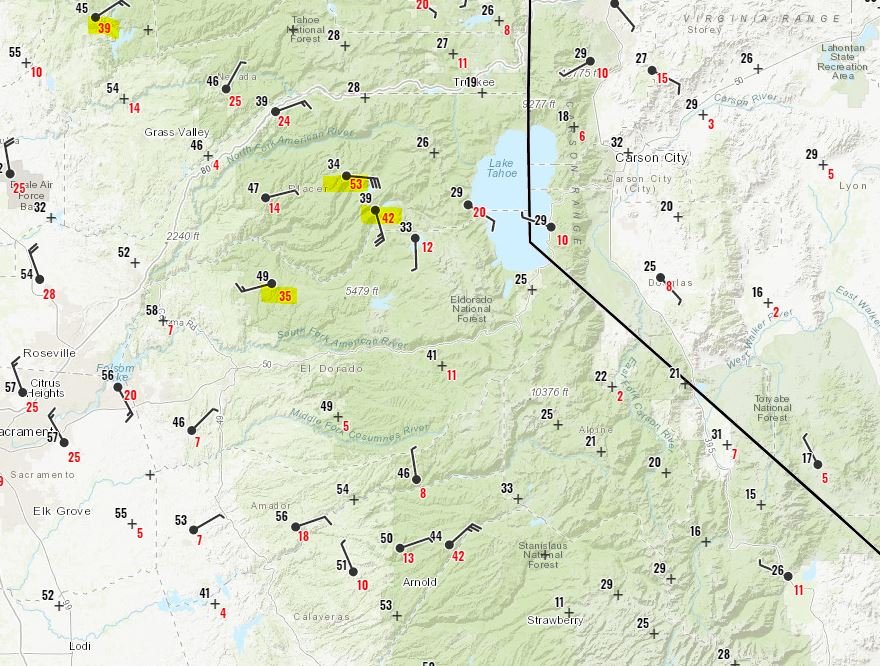
Observed wind speeds in California
Observed wind speeds in California early Thursday morning. Rob Carlmark.

In short…it’s ongoing…people are on edge…every stoplight is a four way stop with traffic issues…people have NO idea when power is coming back…it’s a big deal that is getting bigger today.

I do see the weather changing tonight for many…less wind but still dry so there is an end to this in the weather world…but the power thing…it’s going to be some time.
Power company may turn off electricity to 30,000 addresses in Southern California during wind event

SDG&E may suspend electrical service to some customers this week

SDG&E turn off power wind
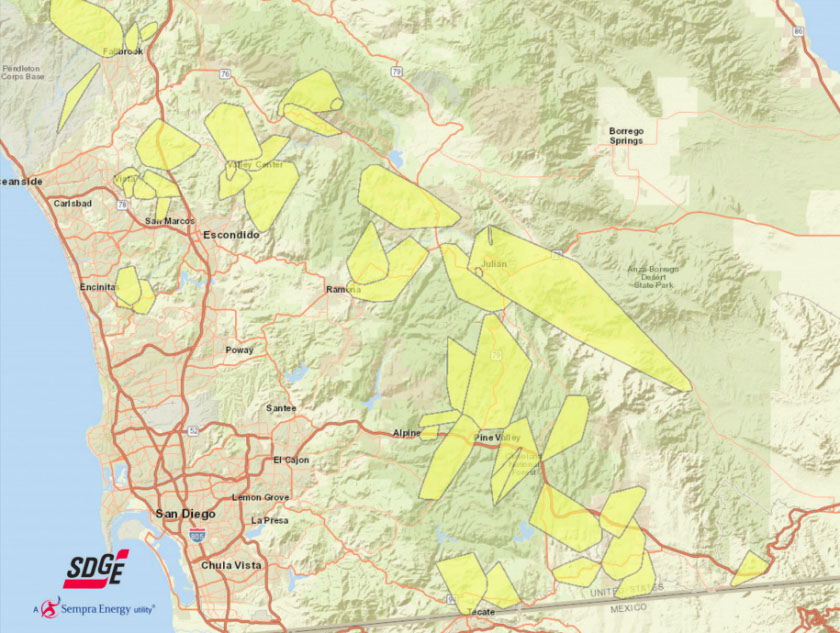
SDG&E says the areas in yellow could experience public safety power outages during the wind event that will hit San Diego County on Thursday and Friday.(SDG&E map)

Pacific Gas and Electric in Northern California is not the only power company with plans to turn off the electricity to their customers. San Diego Gas and Electric said they may suspend electrical service to about 30,000 addresses during the wind event on Thursday and Friday of this week. Thinking that their power line infrastructure may not be robust enough to withstand the wind, they want to reduce their liability by de-energizing the power lines, rather than fully hardening their electrical distribution system.

SDG&E was one of the pioneers in turning off the power to their customers when the wind blows and has been doing it  for years. They floated the idea in July, 2009 after their power lines started three massive fires in 2007 , the Witch Creek, Guejito, and Rice Canyon Fires, that burned more than 198,000 acres, destroyed more than 1,500 homes, injured 40 firefighters, and caused two deaths.  The company figured up to 150,000 people could be affected by a proactive power outage in 2009.

SDG&E has been trying for the last 7 years to get their customers to pay $379 million the company incurred in claims from the deadly 2007 fires. They took litigation all the way to the U.S. Supreme Court which ruled against them on October 7, 2019. After the verdict the company wrote in a news release,  “SDG&E has shown that the fires occurred due to circumstances beyond our control, but nevertheless the application to spread the costs through rates was denied.”

To be fair, SDG&E has taken steps to reduce the chances their power lines will start a fire during strong winds, such as replacing some wooden poles with metal poles. They have also put systems in place to deal with a fire before and after it starts, including making a large firefighting helicopter available beginning in 2010, hiring contract firefighters during extreme fire weather, and installing more than 100 weather stations on their power lines around Southern California.

Attempting to redefine the common denominators of tragedy fires

“A Classification of US Wildland Firefighter Entrapments Based on Coincident Fuels, Weather, and Topography”

Above: Figure 1 from the research paper. Distribution of 166 US wildland firefighter entrapments that occurred within CONUS (1981–2017) by time of day (local time) and month of the year.

On October 9, 2019 a document was published that summarized the work of four researchers who sought to find commonalities that led to the entrapments of firefighters on wildland fires. The paper is titled, “A Classification of US Wildland Firefighter Entrapments Based on Coincident Fuels, Weather, and Topography.” Apparently they were hoping to confirm, fine tune, revise, or update the “Common Denominators of Fire Behavior on Tragedy Fires” defined by Carl C. Wilson after the 1976 Battlement Creek Fire where three firefighters were killed near Parachute, Colorado.

Mr. Wilson developed two lists, one with four items and another with five. Here is the five-item list:

  1. Most of the incidents occurred on relatively small fires or isolated sectors of larger fires.
  2. Most of the fires were innocent in appearance prior to the “flare-ups” or “blow-ups”. In some cases, the fatalities occurred in the mop-up stage.
  3. Flare-ups occurred in deceptively light fuels.
  4. Fires ran uphill in chimneys, gullies, or on steep slopes.
  5. Suppression tools, such as helicopters or air tankers, can adversely modify fire behavior. (Helicopter and air tanker vortices have been known to cause flare-ups.)”

The four more recent researchers conducted an analysis of the environmental conditions at the times and locations of 166 firefighter entrapments involving 1,202 people and 117 fatalities that occurred between 1981 and 2017 in the conterminous United States. They identified one characteristic that was common for 91 percent of the entrapments — high fire danger — specifically, when the Energy Release Component and Burning Index are both above their historical 80th percentile.

They also generated an update of the time of day the entrapments occurred as seen in the figure at the top of this article. This has been done before, but it’s worthwhile to get an update. And, this version includes the month.

You can read the entire open access article here. If you’re thinking of quickly skimming it, the 7,000 words and the dozens of abbreviations and acronyms make that a challenge. There is no appendix which lists and defines the abbreviations and acronyms.

The authors of the paper are Wesley G. Page, Patrick H. Freeborn, Bret W. Butler, and W. Matt Jolly.

Below are excerpts from their research:


…Given the findings of this study and previously published firefighter safety guidelines, we have identified a few key practical implications for wildland firefighters:

  1. The fire environment conditions or subsequent fire behavior, particularly rate of spread, at the time of the entrapment does not need to be extreme or unusual for an entrapment to occur; it only needs to be unexpected in the sense that the firefighters involved did not anticipate or could not adapt to the observed fire behavior in enough time to reach an adequate safety zone;
  2. The site and regional-specific environmental conditions at the time and location of the entrapment are important; in other words, the set of environmental conditions common to firefighter entrapments in one region do not necessarily translate to other locations;
  3. As noted by several authors, human factors or human behavior are a critical component of firefighter entrapments, so much so that while an analysis of the common environmental conditions associated with entrapments will yield a better understanding of the conditions that increase the likelihood of an entrapment, it will not produce models or define characteristics that predict where and when entrapments are likely to occur.

[…]

The one characteristic that was common for the majority of entrapments (~91%) was high fire danger. As a general guideline, regardless of location, the data suggest that entrapment potential is highest when the fire danger indices (ERC’ and BI’) are both above their historical 80th percentile. Until recently, spatially-explicit information on fire danger has not been widely available as most firefighters have relied on fire danger information available at specific weather stations, which are often summarized into Pocket Cards [83]. Fortunately, fire danger forecasts across CONUS are now available in a mobile-friendly format (see https://m.wfas.net) that can be displayed spatially for each of the fire danger indices separately or combined into a Severe Fire Danger Index.

[…]

Conclusions

The times and locations where wildland firefighter entrapments occur in the US cover a wide range of conditions. Current firefighter safety guidelines seem to emphasize only a subset of the possible conditions due to a focus on the factors that maximize the potential for extreme fire behavior. While many of these safety guidelines are still intuitively valid, caution should be exercised during relevant firefighter training so as to not ignore or undermine the fact that entrapments and fatalities are possible under a much wider range of conditions.

Despite the wide range of environmental conditions associated with entrapments, we have shown that it is possible to identify unique combinations of environmental variables to define similarities among groups of entrapments, but these will necessarily be context and site specific. For most entrapments, the only common environmental condition was high fire danger, as represented by fire danger indices that have been normalized to represent the historical percentile at a particular location. As such, at large spatial scales, fire danger and its association with fire weather should continue to be monitored and reported to firefighters using both traditional methods (i.e., morning fire weather forecasts) and also newer methods that take advantage of advancements in mobile technology.

Red Flag Warnings October 9, 2019

Above: Red Flag Warnings October 9, 2019. Times are CDT.

The areas under Red Flag Warnings are similar to Tuesdays, except Wyoming dropped out and a section of northwest New Mexico was added.

The  wind event continues in some areas of California with predictions for 15 to 30 mph winds gusting at 40 to 50 along with single digit humidity.

Pacific Gas and Electric expanded their power shutoff, increasing the number of addresses affected from 600,000 to 800,000. The company’s web site is having problems keeping up with the traffic, and is occasionally non-responsive.

(Red Flag Warnings can be modified throughout the day as NWS offices around the country update and revise their weather forecasts.)

Analysis of wildfire danger during the California wind event using Hot-Dry-Windy Index

Hot-Dry-Windy Index
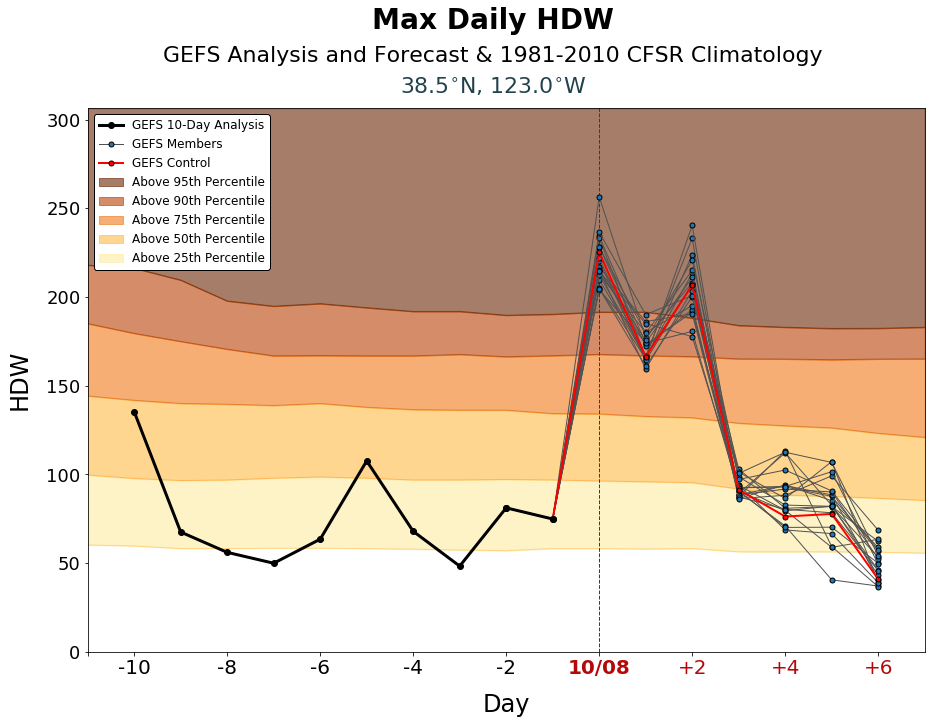
The Hot-Dry-Windy Index for an area 15 miles northwest of Santa Rosa, California.

Weather forecasters expect the wildland fire danger in some areas of  California to be extreme Tuesday night and into Thursday.  Strong north to northeast winds accompanied by low humidity has triggered Red Flag Warnings putting land managers on edge. PG&E is so worried it is proactively turning off the electrical power to 600,000 addresses in nearly 30 northern, central, coastal, and Bay Area counties.

We consulted a fairly new fire danger forecasting tool to see how it analyzed what firefighters will be faced with for  the next few days. The Hot-Dry-Windy Index (HDW) is described as being very simple and only considers the atmospheric factors of heat, moisture, and wind. To be more precise, it is a multiplication of the maximum wind speed and maximum vapor pressure deficit (VPD) in the lowest 50 or so millibars in the atmosphere.

The products, displayed as charts, show the index for the preceding 10 days and the forecast for the next 7 days. For the current and following days you will see results of the Global Ensemble Forecast System (GEFS), which is a weather forecast model made up of 21 separate forecasts, one control (in red) and twenty perturbations. The reasoning for showing 21 different forecasts is to quantify the amount of uncertainty in a forecast by generating an ensemble of multiple forecasts, each minutely different, or perturbed, from the original observations.The HDW only only uses weather information – fuels and topography are not considered by HDW at all. If the fuels are wet or have a high live or dead moisture content it will not be reflected in the data.

At the top of the page is the HDW forecast for an area about 15 miles northwest of Santa Rosa in the Bay Area of California. It predicts the Index will be above the 95th percentile on October 8, above the 90th percentile on October  9, and back up to the 95th percentile on October 10.

Below are HDW predictions for other areas in California.

Hot-Dry-Windy Index Susanville
Hot-Dry-Windy Index, Susanville

Hot-Dry-Windy Index Lake Tahoe
Hot-Dry-Windy Index for the area 30 miles south of Lake Tahoe near the Caples prescribed fire.

Hot-Dry-Windy Index Bakersfield
Hot-Dry-Windy Index for the Bakersfield and Lancaster area.

Hot-Dry-Windy Index San Diego County
Hot-Dry-Windy Index for eastern San Diego County

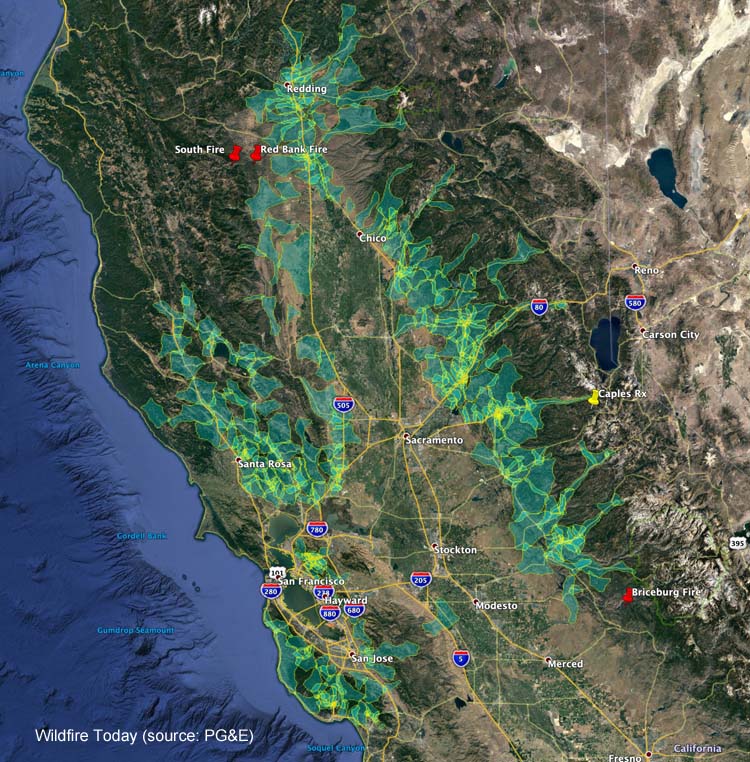
PG&E plans to turn off power to 600,000 addresses to prevent wildfires

This is a response to a forecast for strong winds and Red Flag Warning conditions

PG&E power turn off
Areas in which PG&E expects they will turn off the power Wednesday morning, October 9, 2019.

Pacific Gas and Electric is notifying customers at 600,000 addresses that their electricity will be turned off as a proactive response to a forecast for enhanced wildfire danger. The plan is to throw the switches at 4 a.m. October 9 which could affect millions of people in nearly 30 northern, central, coastal, and Bay Area counties. Based on the latest weather forecasts and models, PG&E anticipates the period of peak winds will occur from early Wednesday morning through midday Thursday. (UPDATE: Tuesday afternoon PG&E raised the number of addresses that will have their power shut off to 800,000)

Since the company’s power lines have caused numerous wildfires in recent years, especially during windy conditions, they have decided to turn off the  power during periods of high fire danger rather than harden their infrastructure to  make it resistant to strong winds.

The weather forecast for some of the areas identified as part of this “Public Safety Power Shutoff” predicts humidity in the teens and north to northeast winds of 15 to 25 mph gusting at 40 to 50 mph beginning late Tuesday night and lasting into Thursday.

PG&E is asking customers to:

  • Update their contact information at pge.com/mywildfirealerts or by calling 1-866-743-6589 during normal business hours. PG&E will use this information to alert customers through automated calls, texts, and emails, when possible, prior to, and during, a Public Safety Power Shutoff.
  • Plan for medical needs like medications that require refrigeration or devices that need power.
  • Identify backup charging methods for phones and keep hard copies of emergency numbers.
  • Build or restock your emergency kit with flashlights, fresh batteries, first aid supplies and cash.
  • Keep in mind family members who are elderly, younger children and pets. Information and tips including a safety plan checklist are available at pge.com/wildfiresafety.