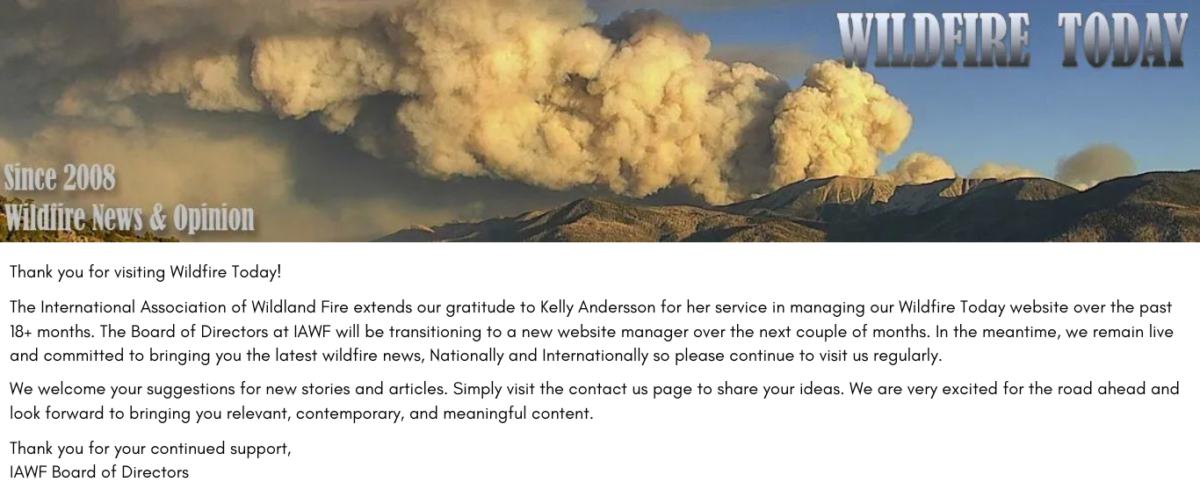
Above: This map from GOES-16 shows lightning in clouds associated with the weather system that produced severe thunderstorms and a few tornadoes in East Texas on February 14, 2017. The system can monitor a given area at 500 frames per second, and can distinguish individual lightning strikes within each flash. NOAA/NASA
It also has the first sensor on a satellite specifically designed for monitoring lightning. The Geostationary Lightning Mapper records total lightning (in-cloud, cloud-to-cloud, and cloud-to-ground) activity continuously day and night over the Americas and adjacent ocean regions.
In addition, the baseline imager will view the Earth with 16 different spectral bands (compared to five on current GOES satellites) and it will provide three times more spectral information, four times the spatial resolution, and more than five times faster temporal coverage than the current system.
The National Weather Service has posted Red Flag Warnings and Fire Weather Watches for areas in South Dakota, Iowa, Missouri, Nebraska, Colorado, Kansas, Oklahoma, New Mexico, and Texas. Most of warnings expire Monday evening.
Many of the areas will have sustained winds of at least 20 to 40 mph with gusts exceeding 50 mph. Tuesday’s forecast includes diminished but still strong winds.
The map was current as of 10:05 a.m. MT on Monday. Red Flag Warnings can change throughout the day as the National Weather Service offices around the country update and revise their forecasts.
There are many different types of machines that can reduce vegetation to much smaller pieces or chips. Here is one variation being used in Utah.
Check out these mechanical chippers “bullhogs”, remove pinyon/juniper trees from the CenterCreek & PineCreek projects in Garfield county. pic.twitter.com/JFbLnXlV91
— Utah Fire Info (@UtahWildfire) March 6, 2017
Richfield Field Office nearing the end of a 350 ac. vegetation management project in Pine Creek-Garfield county, south of Antimony, Ut. pic.twitter.com/DaZmE4AeSZ
The National Weather Service has posted Red Flag Warnings and Fire Weather Watches for areas in Wyoming, South Dakota, Nebraska, Colorado, Kansas, Oklahoma, New Mexico, and Texas.
There is some confusion about the forecast in Nebraska. While the map shows Red Flag Warnings in at least two areas within the state, other indications are that those Warnings were cancelled.
All areas are expected to have strong winds and low humidities.
The map was current as of 11:20 a.m. MT on Sunday. Red Flag Warnings can change throughout the day as the National Weather Service offices around the country update and revise their forecasts.
Map showing heat detected on the Wolf Fire at 2:57 p.m. MST, March 4, 2017. The fire was reported at about 11:30 a.m. on March 4 and some portions of the fire, which is burning in grass, could have cooled and therefore not been detected by the satellite at 2:57 p.m. The fire could be larger than shown by the satellite, particularly on the southwest side. The perimeter shown here is about 1,600 acres, but Great Plain Fire Information said at 3:10 it was 7,000 acres.
(UPDATED at 6:15 p.m. MST March 4, 2017)
At 5:47 MST March 4 Jim Strain of South Dakota Fire said the Wolf Fire east of Wall was just about wrapped up and the estimated size was 5,000 acres.
(Originally published at 4:56 p.m. MST March 4, 2017)
The Wolf Fire has burned thousands of acres in South Dakota between Wall and Quinn. At 3:10 p.m. Great Plains Fire Information reported it had burned about 7,000 acres. The city of Quinn east of the fire was threatened at that time.
A weather station at Wall Saturday afternoon has been recording sustained winds out of the southwest at 30 mph gusting to around 40. At 4:35 p.m. it was 68 degrees with a relative humidity of 19 percent …. tough conditions for firefighters to be successful.
There is another fire 35 miles south of the Wolf fire, 3 miles northeast of Kyle, and a couple of fires in the Black Hills south of Keystone.
The GOES-16 satellite that was launched in November is still being tested and is not fully operational, but some of its new capabilities are being explored. It has new sensors, some of which have a much better resolution and are better at detecting smoke. And it can rescan an area as often as every 30 seconds compared to 15 to 30 minute intervals on the older GOES-13 satellite. This makes it possible to produce much better animations of wildfire activity and smoke plumes.
Below is the description provided by NOAA for the video above, which has the imagery from the new GOES-16 on the left, compared to the older GOES-13 on the right.
This comparison of GOES-16 ABI and GOES-13 imager shortwave infrared (3.9 µm) data shows a number of grass fires burning near Lake Okeechobee in southern Florida on February 20, 2017. In the left panel, GOES-16 imagery at 30-second intervals is shown, while the right panel displays GOES-13 imagery at routine 15-30 minute intervals. The warmest shortwave infrared brightness temperatures are enhanced with yellow to red colors (with red being the hottest). Note the many advantages of the 30-second GOES-16 imagery: (1) new fire starts are detected sooner in time; (2) the fire behavior (intensification vs dissipation) can be better monitored; (3) the intensity of the fires is more accurately depicted with the 2-km resolution GOES-16 data vs the 8-km resolution GOES-13 data; (4) numerous brief fires are not detected at all in the 15-30 minute interval GOES-13 imagery (especially south and southeast of Lake Okeechobee, during the 2100-2115 UTC time period).
Bill Line of the NWS has posted a fascinating animated gif on his website that shows wildfires and smoke in Oklahoma today, Saturday.
Below is a screengrab from Mr. Line’s gif. The yellow areas represent heat.
An excerpt from his description:
The 0.47 um band will have higher reflectance in the presence of atmospheric aerosols (such as smoke) when compared to the legacy 0.64 um visible band. Combining these two bands into one display gives a forecaster a very helpful, quick view of wildfire activity across the region. The 2.25 um band can also be utilized to detect fire hotspots (especially very hot fires), particularly at night when the hotspot contrasts nicely with the surrounding darkness.