Was the 2014 wildfire season in California affected by climate change?

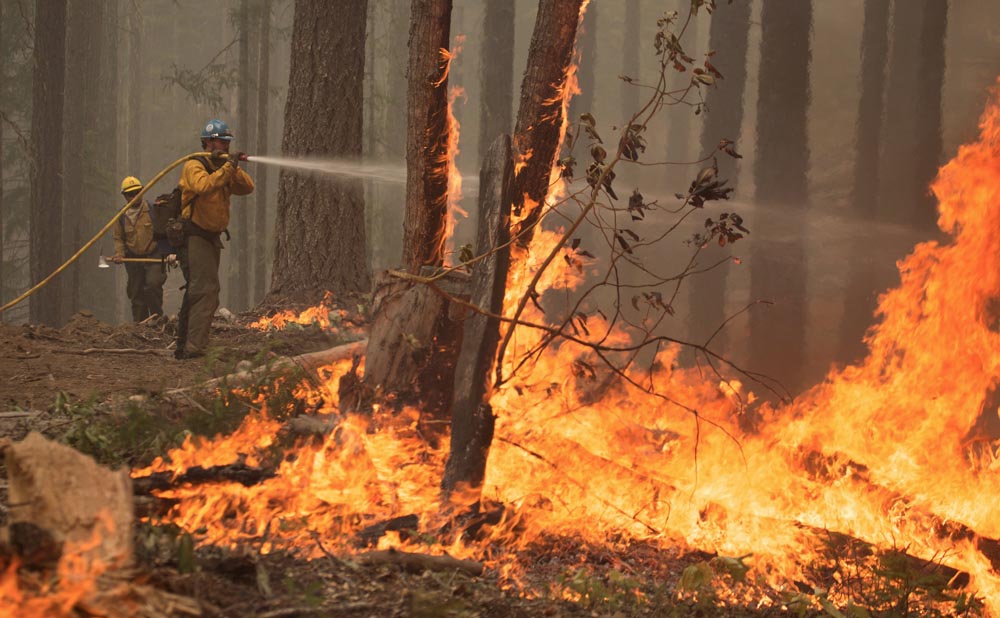
Happy Camp Complex, 2014
Happy Camp Complex in northern California in 2014. Photo by Kari Greer.

2014 was a busy year in California for wildland firefighters. Battles were fought over 555,044 acres of blackened ground in the state, which was the eighth largest number of acres burned in the last 28 years. So far in 2015, fires have covered 838,465 acres in California, which puts it fifth highest in 28 years.  (Stats from Cal FIRE and the NIFC National Situation Report.)

We have always been dubious of linkages between one weather event and long term climate change. When a senator brings a snowball onto the Senate floor or a governor talks about this summer’s fires to prove their cases that climate change does or does not exist, both may be over stating their “evidence”.

However, I’m not a meteorologist or climate scientist. But some of them who are, took a stab at investigating the possible attribution of extreme weather-related events in 2014 to global climate change. In their report, Explaining Extreme Events of 2014 from a Climate Perspective33 different research groups explored the causes of 29 different events that occurred that year.

The first event in the report is titled, Extreme Fire Season in California: A Glimpse Into the Future. It is debatable if the 2014 fire season in California was “extreme”, since like we wrote earlier, it had the eighth largest number of acres burned in the last 28 years according to data from the land management agencies. The authors, Jin-Ho Yoon, S.-Y. Simon Wang, Robert R. Gillies, Lawrence Hipps, Ben Kravitz, and Philip J. Rasch, reported “thousands more fires than the five-year average” between January 1 and September 20.

We don’t put very much stock in numbers of fires, since a small spot that can be stomped out by a couple of firefighters counts just as much as a 300,000-acre conflagration. Total burned acres is much more meaningful. The area burned data that the scientists studied was derived from satellite observations, which can underestimate wildfire extent due to its limit in the minimum detectable burned area, timing of the satellite overflights, light fuels cooling before being detected, and obscuration by cloud cover.

The report also examined the Keetch-Byram Drought index, and determined that “in terms of the KBDI and the extreme fire risk, 2014 ranks first in the entire state”, but it was not clear what time period they were referring to (it may have been since 1979).

The authors fall short of attributing the “extreme” 2014 fire season in California to global climate change:

Our result, based on the CESM1 outputs, indicates that man-made global warming is likely one of the causes that will exacerbate the areal extent and frequency of extreme fire risk, though the influence of internal climate variability on the 2014 and the future fire season is difficult to ascertain.
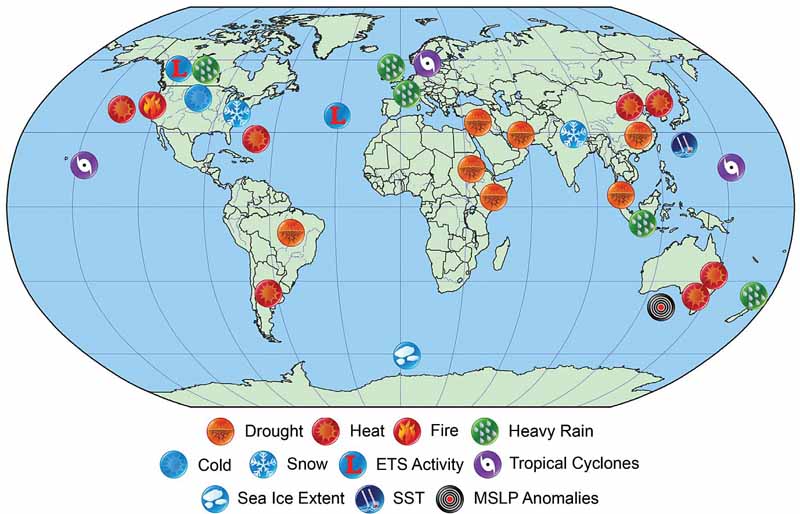
2014 climate events
Location and types of events analyzed in the publication. The image is from the study.

How much precipitation is needed to end the drought in western states?

precipitation end drought 3 months

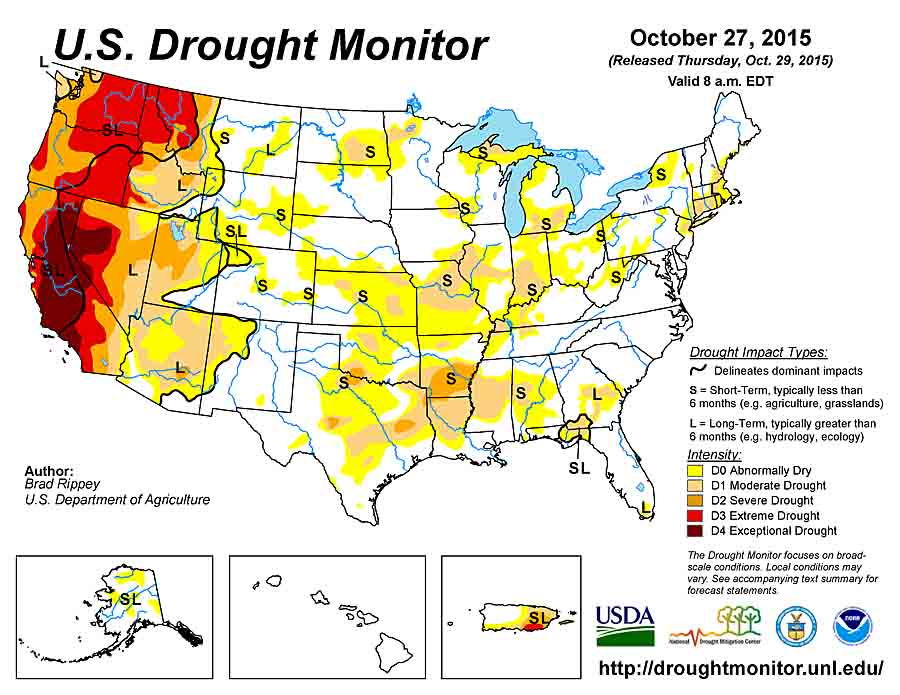
The three-year drought in the western United States and especially in California became more obvious this year as wildfires were influenced by low moisture in live vegetation, and in some areas once-healthy trees began to show drought-induced stress.

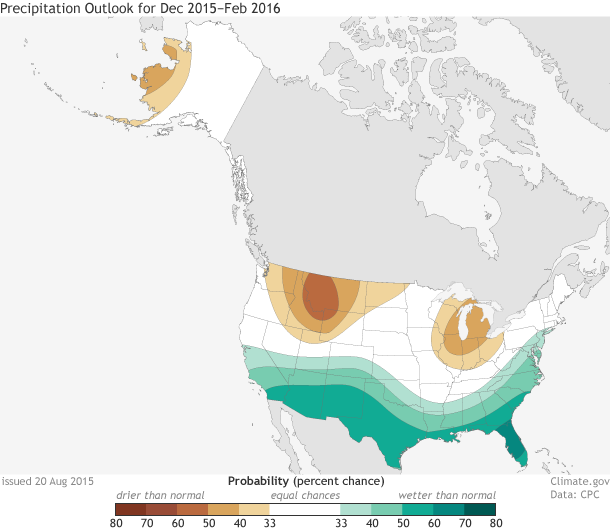
The current El Niño is expected to influence weather patterns during the coming winter and forecasters predict higher than normal precipitation across the southern portions of the United States, including southern California.

The map above illustrates how much precipitation is needed over a three-month period to end or ameliorate the current drought. Most of northern California will need from 6 to 12 inches according to NOAA.

Drought Monitor 10-27-2015


NOAA’s disclaimer about the map at the top of the article:

This [map] only tells you how much precipitation a location needs to get the Palmer Hydrological Drought Index (PHDI) to a certain value based on the model’s equations. It does not tell you how much precipitation is needed to refill a reservoir, restore groundwater to normal, or bring an ecosystem back to normality. It also does not incorporate snowpack into its calculations, and mountain snowpack is a crucial part of hydrology in the U.S. West.

What to expect from El Niño

El Niño forecast

The question of IF there will be a strong El Niño weather pattern in the contiguous United States this winter is now settled. NOAA reports that there is a 95 percent probability that El Niño will continue through the 2015-2016 Northern Hemisphere winter. In an indication of the strength to expect, the June-August average of sea surface temperatures in the Niño3.4 region was 1.22° C above normal. This is the third-highest June-August value since records started in 1950.

El Niño isn’t a storm that will hit a specific area at a specific time. Instead, the warmer tropical Pacific waters cause changes to the global atmospheric circulation, resulting in a wide range of changes to global weather.

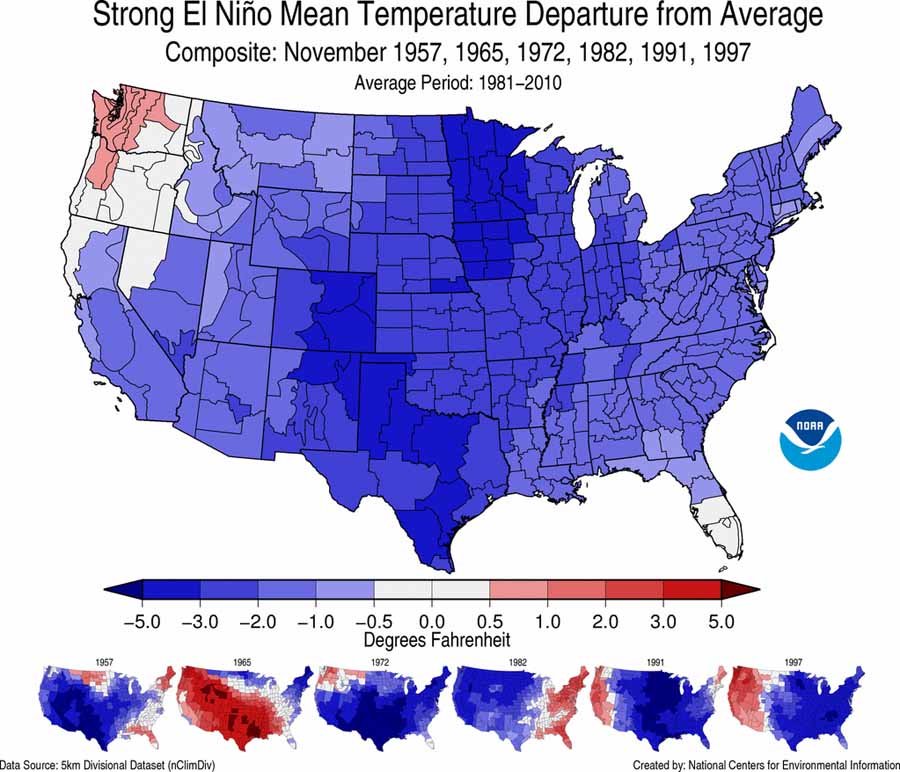
The map above is a composite of how precipitation varied from average during the strong El Niños of 1957–1958, 1965–1966, 1972–1973, 1982–1983, 1991–1992, and 1997–1998. There is a large variability in those six events that makes it difficult to predict the effects at any specific location. The map below is a composite of temperatures for the same periods. Again there is much variability, and you will notice that it is very different from the actual forecast, farther down, for this winter.

El Nino temp composite

The impacts of El Niño are typically largest in the U.S. during the cool months from October through May. During the winter season, the southern half of the country — from California to the Southern Plains, as well as along the East Coast — typically receives above-average precipitation. Below-average temperatures also often accompany this above-average precipitation in these regions. Across the northern half of the country, the winter season tends to be warmer and drier than average, particularly in the Northwest, Northern Plains, and Ohio Valley.

Below are NOAA’s outlooks for temperature and precipitation for December 2015 through February 2016.

precipitation outlook temperature outlook

It was very dry in the far west and northwest during the first six months of 2015

Precipitation, January-June, 2015If the brown areas above have a hot and dry summer, wildland firefighters will be spending a lot of time over the next couple of months in California, Oregon, Idaho, and Montana.

And, those same areas were warmer than normal during the first half of 2015. Some were the warmest ever recorded for the period.

Temperature Jan-June 2015

I stopped trying to predict the nature of fire seasons a long time ago. Pre-season weather is a significant factor, but more important is the weather during the fire season. So ask me again in September how busy firefighters in the west will be this summer.

This winter’s temperature, precipitation, and snow cover

Astronomical winter does not end until March 20, but we are already mentally summarizing the weather we experienced over the last three months and are thinking about what the spring and summer wildfire seasons might look like. Below are charts from NOAA showing this winter’s precipitation, temperature, snow cover, and lastly the drought outlook.

Winter 2014-2015 average temp

Winter 2014-2015 precipitation


Below is the legend for the amount, in inches, that the predicted snow depth (shown on the following maps) on March 9 will depart from normal.

Legend, snow depth departure inches


Snow depth departure WA OR N-CA

Continue reading “This winter’s temperature, precipitation, and snow cover”