Congressional staffers have office pool to predict how many acres will burn in wildfires

Since 2003 some congressional staffers who work for Senators, Congressmen, and committees, have been participating in an office pool to guess how many acres will burn in wildfires each year. The official figure is determined by the statistics kept by the National Interagency Fire Center in Boise, whose web site has a wealth of information about acres burned each year. We have used their historical figures on several occasions to analyze trends.

If there is a tie, which seems rather unlikely since we’re talking about 1,000,000 to 10,000,000 acres burning each year, there is a tie breaker question, according to Sarah Laskow the author at Grist who wrote the article that disclosed this office pool. That question, according to Laskow is to…

…guess how many fire-fighting planes (“fixed-wing, heavy-slurry aircraft”) will crash, become unusable, or be grounded, and how many weeks those aircraft will be out of service.

According to Laskow, Frank Gladics, a professional staffer on the Republican side of the Senate Energy and Natural Resources Committee, runs the contest.

If you have a perfect memory and are an obsessive reader of Wildfire Today, you will recognize that name, Frank Gladics. Here is what we wrote on July 29, 2011 when we covered the story about the U.S. Forest Service cancelling the contracts with the last six P3 air tankers operated by Aero Union, putting the company out of business and leaving only 11 large air tankers on exclusive use contract.

At the Aerial Firefighting Conference held in Washington, DC last May, Frank Gladics, professional staff member with the U.S. Senate energy and natural resources committee, addressed the report that some in the USFS would like to replace the aging fleet of large air tankers with 20 to 30 C-130Js at a cost of $80 to $85 million each. Gladics said funding is not available for such a massive purchase, and…

We need a more diverse fleet. . . . Go back and look at alternate aircraft, including water-scooping aircraft. Our forests, the resources and communities can’t wait another 10 years while you wait for the existing fleet to become inoperable in hopes Congress will be forced to buy you that Ferrari you want.

The USFS seems to have an irrational phobia about water-scooping air tankers in spite of receiving advice from several different expert sources, including the infamous top secret Rand report, that they should add some to the air tanker fleet.

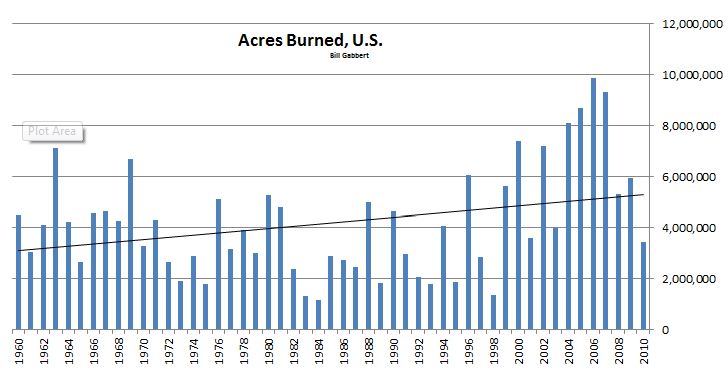
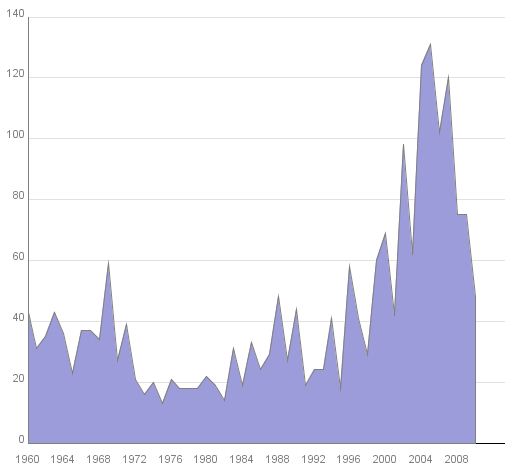
In case you are planning on starting or entering a guess-the-acres contest, here is a chart that we had on file that shows the number of acres burned in the 50 states by year, 1960-2010.

Acres burned wildfire US

Average size of wildfires, 1960-2010

Regular readers of Wildfire Today know that I like to present statistics, charts, and graphs about wildland fire size and occurrence. The first article on Wildfire Today on this topic was in January 19, 2008, and the last time was December 10, 2010. The final numbers for the 2010 calendar year for the United States are available, and I found a new source for crunching data, Many Eyes. So, there’s a new excuse reason for writing another article.

One statistic I concentrate on is the average size of fires, not so much the number of fires or the total acres burned each year, two stats that the mainstream media harps on. The average size is affected not only by the weather, but also by the fuel condition and age, how many fires were burning at the same time, the short-term availability of firefighting resources, the skill and efficiency of the firefighting effort, strategy used on fires, and the number of firefighting resources on the payroll of the firefighting agencies.

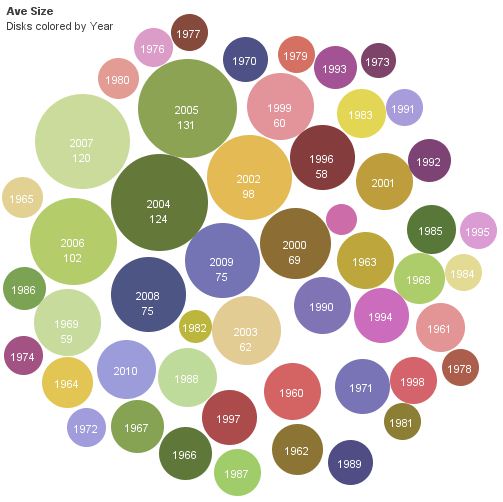
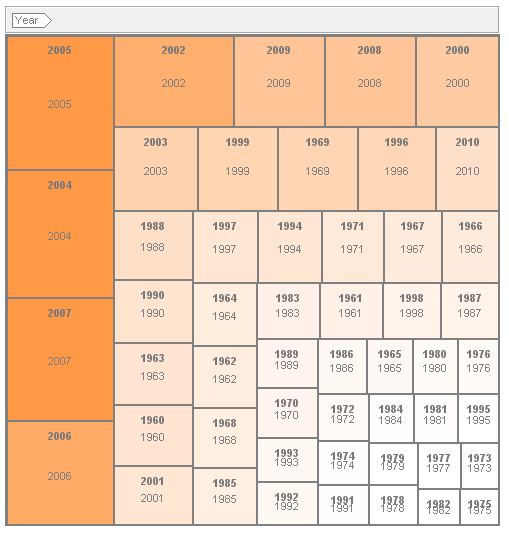
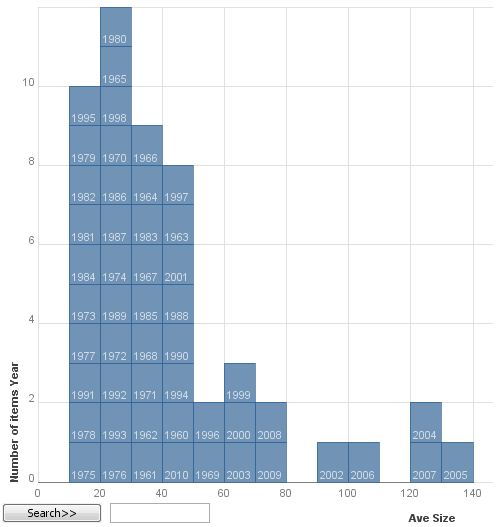
Here are a few new ways of visualizing the average size of wildland fires, in acres, in the United States, from 1960 through 2010. The data for the number of fires and acres burned each year came from NIFC. Then I spent some time with Excel and Many Eyes to develop these products.

Average fire size, 1960-2010, bubble chart
Average fire size, 1960-2010, bubble chart. Data: NIFC/BG
Average fire size, 1960-2010, tree map
Average fire size, 1960-2010, tree map. Data: NIFC/BG
Average fire size, 1960-2010, block histogram
Average fire size, 1960-2010, block histogram. Data: NIFC/BG

And the standard stack graph:

Average fire size, 1960-2010, stack graph. NIFC/BG
Average fire size, acres, 1960-2010, stack graph. Data: NIFC/BG

The average fire size in 2010 was 48 acres, compared to the average between 1960 and 2010 which was 37.

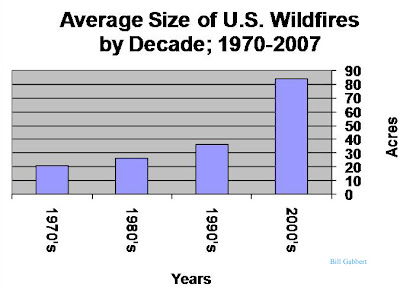
The chart below shows the average size of wildfires in the United States by decade.

Average size wildfires by decade

NICC releases wildfire stats for 2010

The National Interagency Coordination Center has released a massive compilation of wildfire occurrence and mobilization statistics for 2010. The 70 pages of data is broken up into 5 .pdf documents that can be found HERE. Much of it is very interesting and points out the fact that the 2010 fire season was much less active than normal. (We provided some data on this subject on December 10.)

Below we include some excerpts from the report:

wildfire Acres BurnedWildfire Acres burned by Agency, 2010

Continue reading “NICC releases wildfire stats for 2010”

2010 – fewest wildfire acres burned since 1998

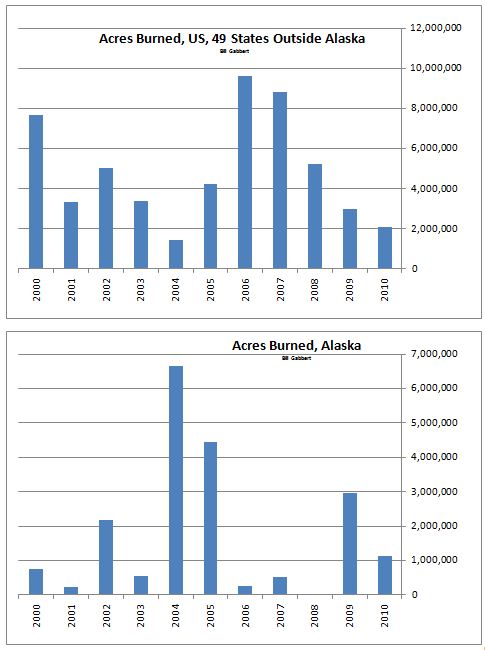
This year, 2010, is shaping up to be the the quietest wildfire season in the United States since 1998, when measured by acres burned. If you separate Alaska from the rest of the country, through November 4, 2010 the lower 49 states have burned the fewest acres since 2004. Alaska can routinely have mega-fires, or a very quiet fire season, so adding their numbers in with the rest of the country can really skew the trend. For example, in 2004, four times as many acres were blackened in Alaska than in the other 49 states combined.

The following numbers were obtained from the http://www.nifc.gov/ site, which has had problems recently and is not always available. The 2010 stats here go through November 4, 2010.

number Wildfire acres burned united states
(note: the number of acres burned in Alaska in 2008 was 32,648)

The stats for the number of acres burned in all 50 states from 1960 through 2010 are below.

Continue reading “2010 – fewest wildfire acres burned since 1998”

Wildfire statistics through 2007

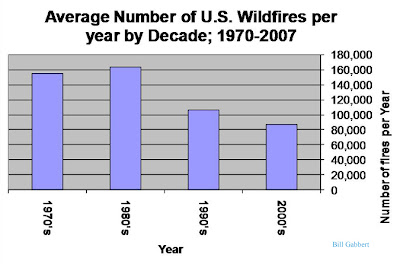
We have been tracking the fire occurrence stats provided by the National Interagency Fire Center for several years. It is clear that the average size of fires has been increasing since 1970 while the average number of fires is decreasing.


We are having fewer, but larger fires. While the population in the country continues to grow, a person might think that the number of fires would increase. But some of the other factors that come into play are fire prevention programs and better technology for preventing fires.

There will be debate about why fires are larger. Climate change will be first on many people’s minds, but we must also consider the build-up of fuels as a result of fire suppression over the last 100 years. The chickens are coming home to roost.

This increase in fire size comes in spite of better management and technology in reporting fires, communications, water handling, incident management, and dispatching.

But better technology and management have their limits when it comes to putting out a massive fire. Large wind or fuel driven fires can only be followed by firefighters. We can chip away at the flanks or suppress the heel, but we can’t stop the forward progress of a raging fire until something changes…. the weather or the fuel. Or, as proven by Bill Molumby’s incident management team on the Indians fire east of Big Sur this summer, you have the luxury of time, distance, and very little private land, and you can backfire or burnout miles ahead of the fire.

The glamorous toys that politicians and extremist talk radio hosts clamor for (I’m talking to YOU, Roger Hedgecock and San Diego) such as water-scooping air tankers and night flying helicopters have their use, but they are totally ineffective in strong winds, when we are most likely to be losing homes and citizens. It can be too dangerous for pilots to fly under those conditions, and the retardant and water that is dropped is completely dispersed before it hits the ground.

Wildfire statistics


We all know that wildland fires are larger than they used to be. Almost every summer recently there are fires that exceed 100,000 acres. Before 1990 this was not common.

I analyzed some fire occurrence statistics obtained from the National Interagency Fire Center and the National Incident Information Center. The numbers for 2007 are through November 4, 2007. Usually when fire occurrence statistics are displayed you will see total acres and the number of fires by year. But when I computed the average size of fires for each decade, the 1970s through 2007, a trend is painfully obvious. During those four decades the average size of fires increased by 400%, while the average number of fires each year decreased by 44%. (Click on the graphs to make them larger.)

But why are fires larger? Some of the factors that could cause such an increase in the average size are:

  • Fire suppression for the last 100 years is catching up with us. Preventing naturally occurring fires to routinely reduce the fuel loads increases the amount of fuel, and the continuity of it, available when a fire starts. Fires burn more intensely and with more resistance to control.
  • Climate change. There is no doubt that temperatures in the last few decades have been higher that they were before this period. We can debate how this may have affected wildland fires. Many areas have had extended droughts, causing die back of brush and shrubs. Trees are stressed, making them more susceptible to insects and other pests. Do these higher temperatures have a direct effect on fire behavior on an hour by hour basis?