Where does the moisture in a pyrocumulus cloud come from?

Above: CNN Meteorologist Chad Myers explains pyrocumulus clouds. This is a screenshot from Mr. Myers’ 52-second video. The Weather Channel has a similar explanatory video.

Cumulus clouds are puffy clouds, usually having a somewhat flat base but with some vertical development that gives them rounded towers on top. They can form when the sun heats the earth, which then heats the air above it causing the warmer air to rise. Rising air cools and the relative humidity increases. If it reaches 100 percent, water vapor condenses forming a visible cloud.

Above: time-lapse video of pyrocumulus over the King Fire in California.

Clouds can also form over vegetation fires. In some cases a very intense fire can produce enough heat that the air rises very quickly. If it is not dispersed laterally by wind it can rise high enough that a cloud forms. This can look like a cumulus cloud, but when they form over a fire they are called pyrocumulus clouds.

Occasionally these clouds will produce rain or even lightning. Water requires a non-gaseous surface to make the transition from a vapor to a liquid. Smoke helps out by contributing very small particles that are used as condensation nuclei on which water droplets form, to create clouds or rain.

If pyrocumulus clouds grow large they resemble cumulonimbus, thunderstorm clouds. What goes up must come down, and if not disturbed by a strong wind during the dissipating stage the updrafts can reverse and become downdrafts. This is sometimes called a “collapsing column”. When that descending air hits the ground it spreads out, sometimes in all directions, and can quickly and drastically change the wind direction at a given point on a fire. This can be fatal if firefighters find themselves in the wrong location at the wrong time.

I had always assumed that much of the moisture that formed a pyrocumulus came from a byproduct of combustion — water vapor — something that many burning fuels create. (Some TV meteorologists also make the assumption about the sources of the moisture.) A great deal of water vapor is produced when vegetation burns, and the higher the fuel moisture the more water vapor is created.

But I wanted to confirm that assumption before I wrote this article, and it turns out I was wrong. I found two research papers that were devoted to the subject and they were mostly in agreement. As the byproducts of combustion rise above a fire the water vapor is rapidly diluted before it reaches the condensation level, or what becomes the base of the pyrocumulus. One group of researchers in Germany calculated that 10% of the moisture in a pyrocumulus comes from the fire.

Others with the Bushfire & Natural Hazards CRC in Melbourne, Victoria, Australia determined that the contribution of water vapor from the fire is negligible since it is diluted before it reaches the height of the cloud:

Fire plumes entrain large amounts of environmental air as they ascend, which greatly dilutes the plume gases, including the fire moisture. Figure 3 shows the fire moisture dilution for the moist fire simulation(right panels of Fig. 2). The lightening shades of blue with height demonstrate the fire moisture dilution. When the plume reaches the condensation level (4.5 km) there is barely any fire moisture evident to contribute to cloud development. The dilution rate may be sensitive to fire size and intensity.
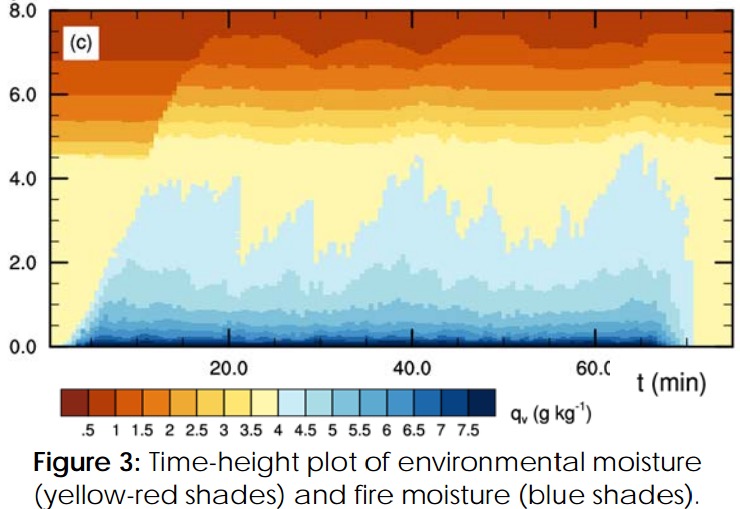
pyrocumulus moisture
From research by the Bushfire & Natural Hazards CRC, Melbourne, Victoria.

Continue reading “Where does the moisture in a pyrocumulus cloud come from?”
Wildland fire potential in the lower 48 states

The U.S. Forest Service produced this map showing wildfire potential in the lower 48 states. Higher resolution versions are available.

Here is how the USFS describes this map:

“The wildland fire potential (WFP) map is a raster geospatial product produced by the USDA Forest Service, Fire Modeling Institute that is intended to be used in analyses of wildfire risk or hazardous fuels prioritization at large landscapes (100s of square miles) up through regional or national scales. The WFP map builds upon, and integrates, estimates of burn probability (BP) and conditional probabilities of fire intensity levels (FILs) generated for the national interagency Fire Program Analysis system (FPA) using a simulation modeling system called the Large Fire Simulator (FSim; Finney et al. 2011).

The specific objective of the 2012 WFP map is to depict the relative potential for wildfire that would be difficult for suppression resources to contain, based on past fire occurrence, 2008 fuels data from LANDFIRE, and 2012 estimates of wildfire likelihood and intensity from FSim. Areas with higher WFP values, therefore, represent fuels with a higher probability of experiencing high-intensity fire with torching, crowning, and other forms of extreme fire behavior under conducive weather conditions.

Using the FPA FSim products as inputs, as well as spatial data for vegetation and fuels characteristics from LANDFIRE and point locations of fire occurrence from FPA (ca. 1992 – 2010), we used a logical series of geospatial processing steps to produce an index of WFP for all of the conterminous United States at 270 meter resolution.”

Red Flag Warnings, August 29, 2016

wildfire Red Flag Warnings August 29, 2016The National Weather Service has posted Red Flag Warnings or Fire Weather Watches for areas in Oregon, California, and Nevada.

The Red Flag map was current as of 8 a.m. MDT on Monday. Red Flag Warnings can change throughout the day as the National Weather Service offices around the country update and revise their forecasts and maps. For the most current data visit this NWS site.

Woman driving on tire rim causes multiple fires

Willow Fire
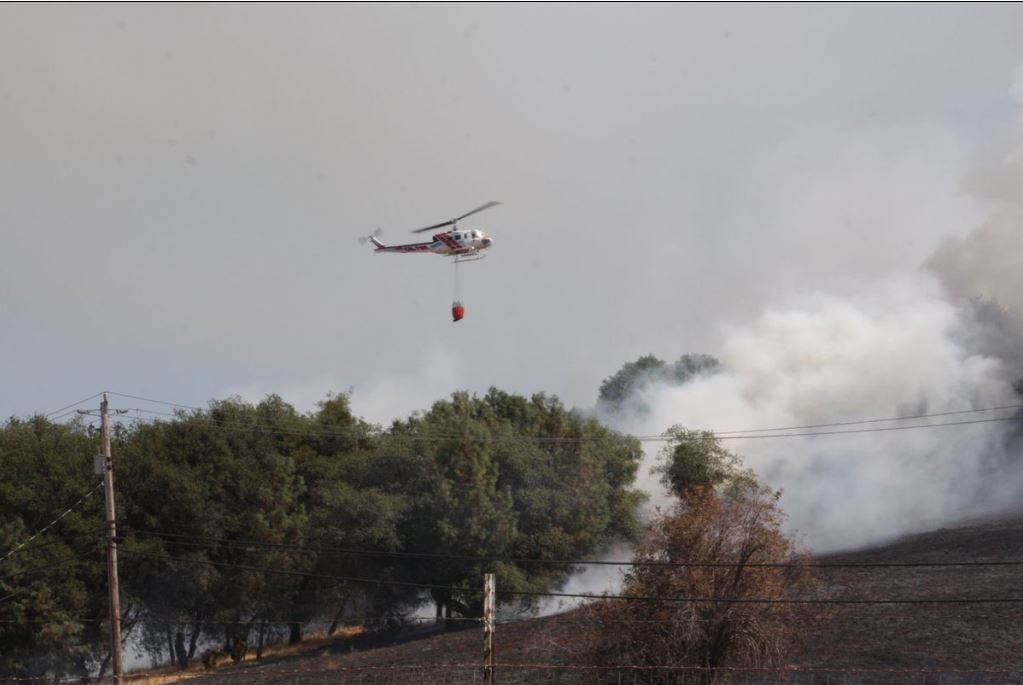
Willow Fire. CAL FIRE photo.

A woman driving on a tire rim is suspected of causing multiple fires in San Andreas, California. After a tire went flat, Renee Hogan continued driving as the tire caught fire and sparks were created as the metal rim dragged on Mountain Ranch Road.

Several fires started in the nearby vegetation that eventually merged to become the Willow Fire which has burned 450 acres and required evacuations in the Willow Valley Subdivision.

The California Highway Patrol arrested Ms. Hogan at the easternmost fire, which also burned her vehicle. She was initially arrested for driving under the influence of drugs. Upon further investigation, she was arrested for causing a fire that resulted in a structure burning, seven counts of causing a fire to forestland or a structure, and one count of committing a violation during a declared state of emergency.

Charges filed after crash that killed two firefighters

Nine firefighters traveling in a second crew carrier were stopped 30 miles down the highway, restrained with zip ties, and questioned individually.

Michael Allen Johnson
Michael Allen Johnson. Anoka County jail photo.

(Originally published at 7:22 a.m. MDT August 29. Updated at 2:52 p.m August 30, 2016)

The driver of the crew carrier that crashed August 27 near Blaine, Minnesota killing two firefighters has been charged with a crime. Michael Allen Johnson, 28, was arrested the day of the accident and booked into Anoka County jail. He was charged with two counts of criminal vehicular homicide operating a motor vehicle in a grossly negligent manner.

The two deceased firefighters were identified Sunday by the Keweenaw Bay Indian Community as James F. Shelifoe, Jr., 23, of Baraga Michigan, and Alan J. Swartz, 25, of Baraga, Michigan.

Monday evening WLUC reported more information about Mr. Johnson based on a copy of the criminal complaint. Here are some of the key points according to their article and an AP report:

  • The crash occurred at approximately 3 p.m. CST on Saturday, August 27.
  • Mr. Johnson said he woke up on Friday, August 26th, at approximately 11:00 a.m. and had not slept since then at the time of the crash, aside from a forty-five minute nap during the early morning hours of August 27th.
  • He said he had used marijuana hours before the crash.
  • He admitted to having used cocaine two days earlier. (Blood tests are pending.)
  • Officers stated that Mr. Johnson appeared impaired and was acting combative at the scene of the accident.
  • He told investigators he fell asleep while driving and woke up to a passenger yelling. He veered off the right side of the road, overcorrected to the left, and struck the cable barrier between the southbound and northbound lanes of the freeway.

In the video above the reporter says:

Two hours after the crash a second Beartown truck carrying nine more firefighters was stopped in Bloomington. Their hands restrained behind their backs they sat along a curb, individually questioned, and left on their way.

Bloomington is about 30 miles from Blaine, Minnesota where the crash occurred.

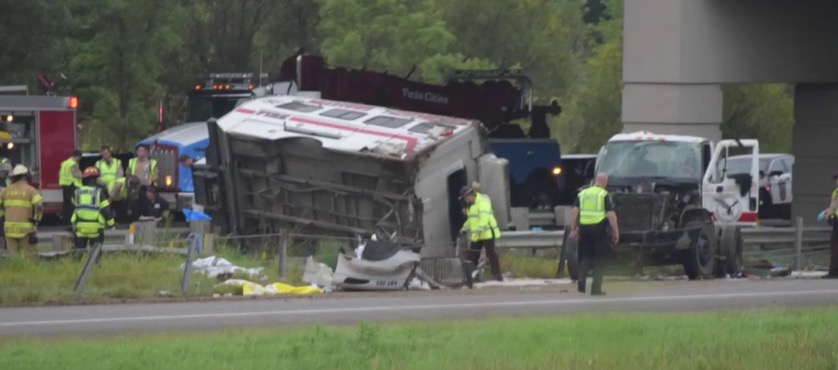
crash scene firefighters
The crash scene. From the WCCO video.

ABC News reported that a witness saw the truck drive past him at about 80 to 90 mph in a 70 mph zone shortly before the crash, according to the complaint.

The passenger compartment on the crew carrier separated from the truck’s chassis when the vehicle rolled.

Seven firefighters in the crew carrier were injured, including Mr. Johnson. All are expected to recover. The Minnesota State Patrol said in a statement:

The truck was southbound on I-35W near 95th Avenue. The truck left the roadway for an unknown reason, struck the median cable barriers, and rolled. A total of nine people were in the vehicle.

There were 11 other firefighters in two other vehicles traveling in the convoy but the truck that crashed had become separated from the other two. All are part of the Beartown Fire Crew from the Keweenaw Bay Indian Community in the upper Peninsula of Michigan. The firefighters were en route to the Box Canyon Fire in Utah.

Red Flag Warning for Yellowstone National Park

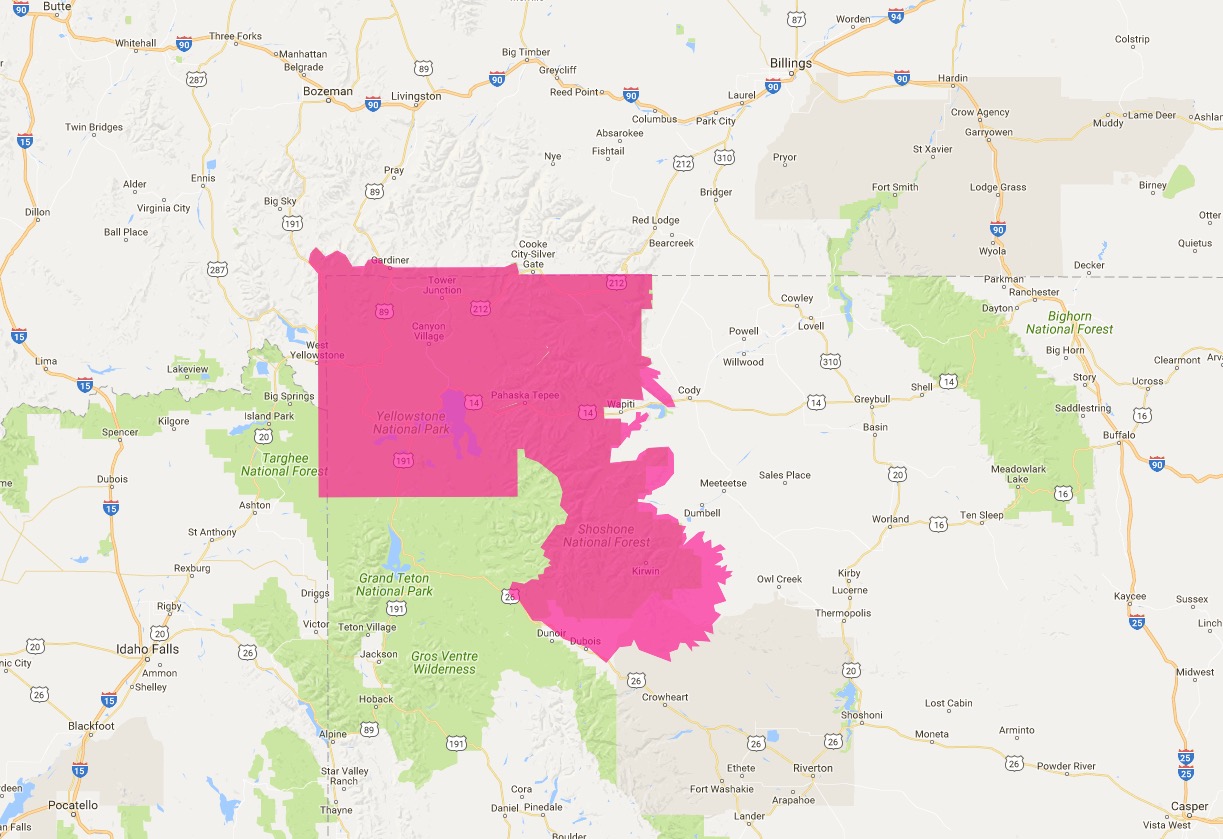
wildfire Red Flag Warning August 28, 2016

National Weather Service forecasters have identified a Red Flag Warning for Yellowstone National Park and the Absaroka Mountains to the east. They designated the park boundary and the Wyoming/Montana state line as the edge of the extreme weather and fuel conditions on three sides. Apparently the national forests and the park on the north, west, and south sides of Yellowstone are not affected.

The Red Flag areas are confined to Fire Weather Zones 140 and 236. Zone 140 is Yellowstone NP, which has mostly straight lines on three sides. Zone 236 is the Absaroka Mountains.

This is the only area in the United States under a Red Flag Warning today.

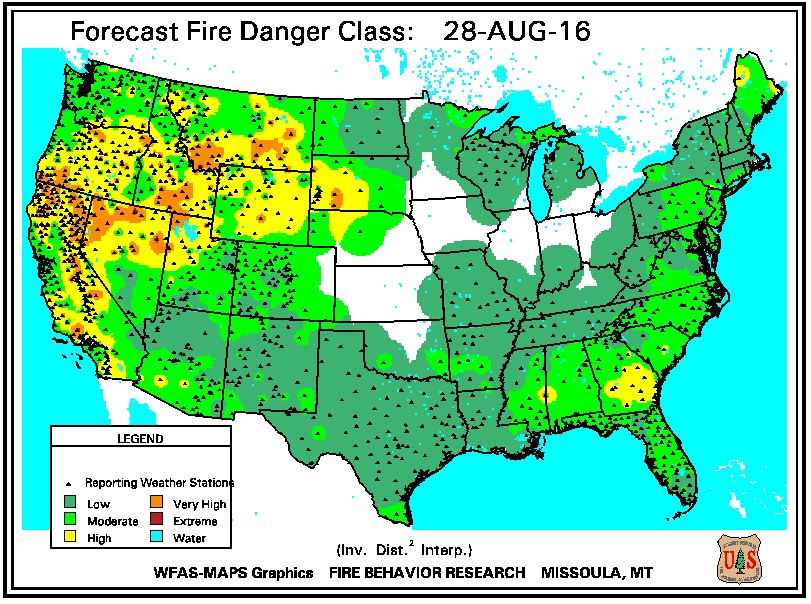
Meanwhile the U.S. Forest Service forecasts mostly Moderate to High fire danger for the same area.

Fire danger August 28, 2016

The Red Flag map was current as of 8:40 a.m. MDT on Sunday. Red Flag Warnings can change throughout the day as the National Weather Service offices around the country update and revise their forecasts and maps. For the most current data visit this NWS site.