The Wildland Fire Lessons Learned Center has put together preliminary numbers regarding accidents, injuries, and fatalities that occurred in 2020.
News and opinion about wildland fire

The Wildland Fire Lessons Learned Center has put together preliminary numbers regarding accidents, injuries, and fatalities that occurred in 2020.
Updated December 18, 2020 | 11:50 a.m.

The U.S. Forest Service announced this week that the number of acres burned on national forests in 2020 was the most since 1910.
Nationwide on lands of all ownership 181,234 acres have been reported burned this year in Alaska, and 10,069,213 in the other 49 states as of December 18. In looking at the records from 1985 to 2020 for the lower 49 states, that was the highest total.
The largest fire in 2020 was larger than a million acres and qualifying as “gigafire”, was the 1,032,648-acre August Complex in northern California. While “complexes” are comprised of a group of fires, it is my understanding that the August Complex originated from numerous lightning-caused blazes which all burned together, merging to become one. In looking at national records since 1985, it burned more acres than all of the fires in the 49 states outside of Alaska in 2006.
Any lists comparing fires by size that includes complexes should be looked at with skepticism. Arbitrarily drawing a circle around several separate fires that have not merged, and calling them a complex, should not covert them to one fire for statistical purposes.
Having said that, the information below, showing “megafires” (that exceeded 100,000 acres), comes from InciWeb which primarily has data for fires on federal jurisdiction. Many states and local agencies rarely if ever enter data for their state responsibility fires at the site, so the list does not include some very large fires in California, Washington, and other areas.
These three fires in California were not entered in InciWeb:


Here is how the USFS this week described the 2020 fire year:
The Forest Service was successful in prioritizing early suppression of wildfire ignitions while facing a record-breaking fire year, with the most acres burned on national forests since 1910. The agency’s modeling research on how COVID-19 may spread between firefighters or in communities during response efforts led to new interagency safety protocols to better support fire camp management. The protocols not only successfully minimized the spread of COVID-19 among the agency’s 10,000 firefighters, but early learning suggests the safety measures resulted in additional health benefits to fire crews, reducing ailments common in fire camps, which translated to a healthier and more resilient firefighting workforce available to protect lives, homes, and communities threatened by wildfire.
In 2020, the Forest Service sold more than 3.2 billion board feet of timber, the second highest level in 20 years. The agency also improved forest conditions and reduced wildfire risk on over 2.65 million acres, removing hazardous fuels like dead and downed trees, and combating disease, insect and invasive species infestations.


The number of fires is decreasing, but fires are growing larger

While all the wildfire statistics for 2020 are not yet available, the data through December 2, 2020 shows that the United States is on track to shatter the record for the average size of wildfires. Looking at the last 35 years, the average size of fires this year was the highest ever, 168 acres. This number has been growing rapidly year to year (see the chart above). The second highest was 145 acres in 2018, and third highest was 132 in 2017.
From 1985 through 1993 the average size was 27 acres — 16 percent of the average size in 2020, 168 acres.


From looking at the data, here are some highlights:
Fewer, but larger fires — why?
The number of fires may be declining because we are better at preventing them. NFPA data shows the number of highway vehicle fires has declined from 456,000 in 1980 to 182,000 in 2018. The highway vehicles fires per billion miles driven has decreased over that same period from 299 to 56. In addition, we may have better spark arrestors on equipment, and, fewer people are smoking and those that do, smoke less.
Higher temperatures most likely has led to lower live and dead fuel moistures, more preheating of vegetation, extreme weather, more rapid fire spread, and increased resistance to control of fires. And when there is more fire on the landscape, the same number of forestry technicians year after year can’t suddenly increase their firefighting output by 300 percent.

All of the wildfire data in our charts here excludes Alaska. I treat that state separately because:
I also do not show on charts the numbers before 1985 because the data available from NIFC shows wide shifts between 1982 and 1984. It appears that a different record-keeping system was introduced at that time.

Lives lost
The tally of the number of lives lost in the California and Oregon blazes will undoubtedly climb as teams search through the footprints of residences. It took weeks in 2018 to document every fatality at the Camp Fire at Paradise, California. Here are the numbers collected so far by the San Francisco Chronicle:
Structures destroyed
It is difficult to get good consistent numbers about structures that have burned. CAL FIRE usually includes damaged buildings as well as those that have been destroyed. The Incident Status Summary, ICS-209, that incident management teams on a fire submit every day asks for the number that were destroyed. And it is likely that many teams on fires have not had the time to count all of the affected structures.
Here are the numbers of destroyed structures from the September 14, 2020 National Incident Management Situation Report compiled at the National Interagency Coordination Center, broken down by Geographic Areas. It uses data from the ICS-209:
Acres burned
The fire season is not over in all areas, but the number of acres burned to date has exceeded the 10-year average number burned in a year. But the figure varies greatly from year to year. 2019 had the least number since 2004, when considering only the states outside of Alaska.
5,887,136 — The total number of acres burned to date in the U.S., not counting Alaska
5,608,376 — 10-year annual average number of acres burned in the U.S., not counting Alaska

There have been many large fires in the last one to two months in Arizona, California, Oregon, Colorado, and Washington, but it has been quieter than usual in Idaho, Montana, Wyoming, and New Mexico.

When a reporter for Bloomberg asked me if she could interview me I said OK, as long as I could have the rights to publish the article on my web site — Mira Rojanasakul said yes. I thought the article, written with Hayley Warren, was going to be primarily about air tankers, and those used in Australia in particular, but now that it has been published today I see that it also covers how climate change is affecting wildfires down under and in the United States.
In addition to being a writer, Ms. Rojanasakul is an accomplished graphics editor for Bloomberg. And that’s why I’m writing about this article and why you should check it out. She takes graphics to a higher level.
Here are some samples.

A very impressive large animated version of the graphic below is on the Bloomberg website.


The number of acres burned in the lower 48-states was the least since 2004
The statistics collected by the National Interagency Coordination Center (NICC) for last year’s fire activity confirm what wildland firefighters in the United States already knew — the fire season in the lower 48 states was much slower than average. Outside of Alaska 2,210,266 acres burned, about 40 percent of the 10-year average of 5,608,376 acres. The 2019 lower 48 total was the least since 2004 when 1,451,902 acres were blackened.
However, the number of acres burned in Alaska, 2,454,098, was almost double the 10-year average for the state and was more than the other 49 states combined. That and the fact that fires in Alaska are managed far differently than those in the rest of the U.S. is why at Wildfire Today we keep the statistics separate.


All other Geographic Areas saw below average acres burned: Southwest (78%), Northern California (48%), Great Basin (42%), Eastern (38%), Southern Area (38%), Northwest (28%), Rocky Mountain (24%), Southern California (20%), and Northern Rockies (15%). Only 27 fires and complexes exceeded 40,000 acres in 2019, which is 21 fewer than 2018.

| Name | State | Start Date | Size | Cause | Estimated Suppression Cost |
|---|---|---|---|---|---|
| Woodbury | AZ | June 8 | 123,875 | Unknown | $20,000,000 |
| Sheep | ID | June 22 | 112,106 | Lightning | $710,000 |
| Kincade | CA | Oct. 23 | 77,758 | Unknown | $77,144,000 |
| Pothole | ID | Aug. 6 | 69,704 | Human | $600,000 |
| Walker | CA | Aug. 16 | 54,608 | Unknown | $35,600,000 |
| Williams Flatt | WA | Aug. 2 | 44,446 | Lightning | $19,432,000 |
| Sawgrass | FL | June 23 | 42,000 | Lightning | not reported |
| Cold Creek | WA | July 18 | 41,920 | Unknown | $900,000 |
One reason for the slowdown in wildfire activity was the weather — it was not as hot, dry, and windy across the Western United States as we have been accustomed to in a typical summer. This affected the Preparedness Level (PL), which is the planning and organizational readiness dictated by burning conditions, fire activity, and resource availability. In 2019 the PL never rose above three, with five being the highest possible level of preparedness. On August 6 it was raised to PL 3 where it remained for only nine days. This is the first time PL 4 has a not been reached since 2010. In 2017 and 2018 we were at PL 4 or 5 for a total of 122 days.
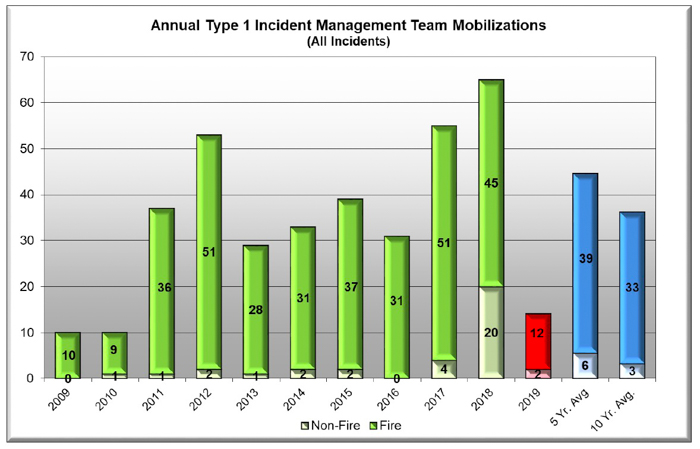
The number of mobilizations of Type 1 Incident Management Teams was about a third of the 10-year average — 12 fires compared to the average of 33. There were no T-1 IMTs deployed during 2019 in the Great Basin, Northern Rockies, or Northwest Geographic Areas.
Between June 5th and July 10th the United States provided 20 crews and 24 individual wildland fire personnel to Alberta, Canada. Between November 14th and December 31st, through the NIFC-Australia Agreement, 85 wildland fire personnel were assigned to support large fires in New South Wales and Victoria, Australia. Support to Australia has continued into 2020.
The number of crews mobilized, 614, was 71 percent of the 10-year average. Nationally the unable to fill rate on crews was 15 percent, but was much higher in Northern California where it was 42 percent.

NICC received 949 engine requests in 2019, which was 61 percent of the 10-year average. Of these requests, 789 were filled, 64 were canceled and 96 (10 percent) were unable to be filled (UTF). There were 13 requests placed to NICC for tactical water tenders, of which 11 were filled, two canceled, and zero UTF.
The number of overhead mobilizations was two-thirds of the 10-year average, with 9 percent UTF.

A total of 438 Very Large Air Tanker, Type 1, and Type 2 large airtanker requests were received by NICC in 2019. Of that total, 308 requests were filled, 41 were canceled and 89 (20 percent) were UTF. The NICC received no requests for MAFFS in 2019.
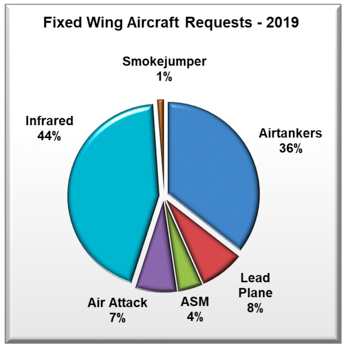
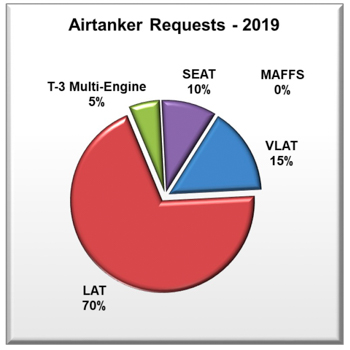
NICC received 78 requests in 2019 for Single Engine Air Tankers and Type 3 Air Tankers, of which 64 were filled, 6 were canceled, and 8 were UTF.

A total of 351 Type 1, 2 and 3 helicopter requests were received by NICC in 2019, 274 were filled, 38 were canceled, and 39 (11 percent) were UTF. Of the 151 Type 1 helicopter requests placed to NICC, 130 were filled, 14 were canceled and 7 (5 percent) were UTF. Of the 100 requests placed to NICC for Type 2 helicopters, 66 were filled, 12 canceled and 22 (33 percent) were UTF. Of the 100 requests placed to NICC for Type 3 helicopters, 78 were filled, 12 canceled and 10 (12 percent) were UTF.
There were no activations of military C-130 aircraft with Modular Airborne FireFighting Systems, MAFFS, for the first time since 2010.
NICC arranged for 5,197 passengers to be transported on large aircraft, mostly on a B737 that was on fire season contract. There were also two additional large aircraft charter flights that were arranged by NICC.
A total of 49 requests for mobile food services were received at NICC in 2019. Of these 47 were filled, two were canceled and zero were UTF. A total of 62 shower units were requested, and all of these were filled (none were canceled or UTF).
The number of shower and food service mobilizations were both 44 percent of the 10-year average.
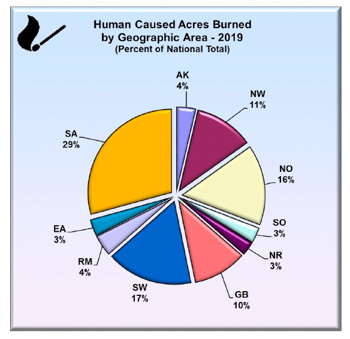
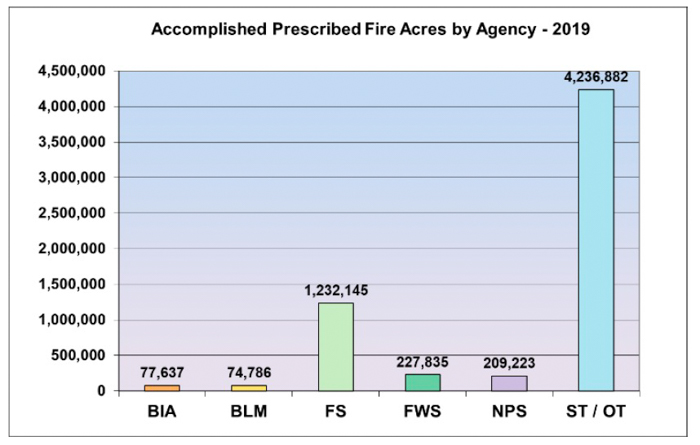
Here is a list of the abbreviations for the Geographic Areas as shown in the reports: AK Alaska, EA Eastern, GB Great Basin, NO Northern California (North Operations), NR Northern Rockies, NW Northwest, RM Rocky Mountains, SA Southern, SO Southern California (South Operations), SW Southwest, ST/OT States/other, and CN Canada.