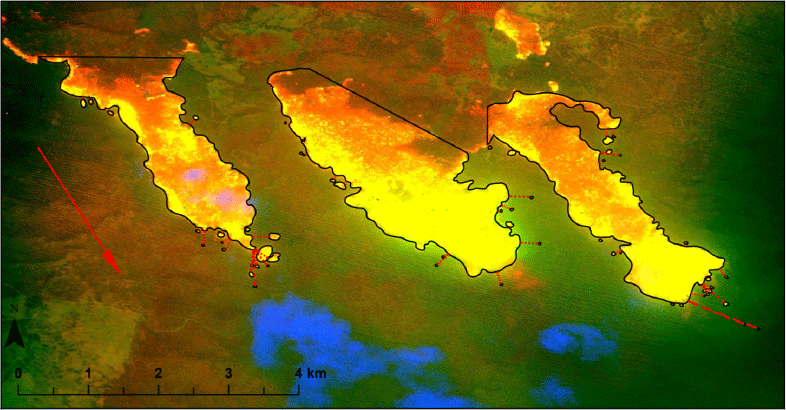
Data collected in an Australian study could lead to the development of more accurate predictive models for wildfire behavior and spotting, especially for extreme wildfires.
Burning embers driven ahead of a wildfire can dramatically increase the rate of spread and the danger faced by firefighters and the public. Under moderate burning conditions a small number of spot fires might be suppressed if enough firefighting resources are available, but on large plume-dominated fires pushed by strong winds spot fires far from the main fire can burn together making suppression at the head of the fire impossible. In many cases ember showers have been the primary ignition source for the destruction of structures in the wildland urban interface.
During the 2009 Black Saturday bushfires in eucalpyt-dominated forests in Australia the maximum spot fire distances were 30 to 35 km (18 to 22 miles) and during the 1965 wildfires in eastern Victoria were 29 km (18 miles). Spot fires in North America have been documented at distances of up to 19 km (12 miles).
A research paper on spotting distance in Victoria and New South Wales was published earlier this week by the International Journal of Wildland Fire, written by Michael A. Storey, Owen F. Price, Jason J. Sharples, and Ross A. Bradstock, titled “Drivers of long-distance spotting during wildfires in south-eastern Australia.”
The researchers took advantage of the increasing use of airborne mapping technologies on wildfires in Australia, including infrared and multispectral line scanning, to analyze data from 338 observations. (See map above.) They used ArcGIS to manually draw polygons and determine the size of the actively burning areas of the fire, which they called “source fire area”, and measured the distance to spot fires and the size of each. They also collected fuels, weather, and topography information.
Below is an excerpt from the research:
Maximum spot fire distances ranged from 5.0 m to 13.9 km (mean, 0.9 km; 95th percentile, 3.9 km). The mean number of spot fires per source fire (irrespective of distance) was 13. The distribution of maximum distance values appeared exponential, with a high proportion of shorter distances (Fig. 4a). Very long-distance spotting was rare; only 11 source fires had a maximum spotting distance >5 km.

Eleven of the fires had spotting distances more than 5 km (3.1 miles). The longest distance measured to a spot fire was 13.9 km (8.6 miles).
The analysis of 338 wildfire line scan observations found the size of the active area of the source fire to be the strongest predictor of long-distance spotting. Important secondary effects were fuel, weather, and topography.
Excerpts:
Wind speed was important to both Maximum-distance and long-distance Spot-number. Upper-level wind speed had weaker but still significant effects in the models. Wind at different levels can influence many aspects of wildfire behaviour, including plume development, plume turbulence and tilt, fire intensity, vorticity development, firebrand transport and ignition likelihood in receiver fuels.
A steep slope somewhere within the source fire (i.e. source fire max. slope) increased the maximum spot fire distance and the probability of spot fire occurrence >500 m. TRI [Terrain Ruggedness Index] performed similarly but was highly correlated with slope (>0.9), so was not included in the same models. An area of relatively high wind exposure (e.g. exposed ridge) also increased maximum spotting distance. Slope and wind exposure may be important through interactions with wind, changing wind speed, increasing turbulence and potentially enhancing pyroconvection, leading to enhanced firebrand generation and transport.
[W]e did not find a commonly used measure of bark spotting potential to be a significant predictor. Our results suggest that to accurately predict long-distance spotting, models must incorporate a measure of source fire area. Gathering data on spotting and plume development at wildfires over a range of intensities (including measuring intensity and frequent line scans) and improving fuel maps should be prioritised to allow for the development of reliable predictive spotting models.
The fibrous or stringy bark on some eucalyptus species is particularly suited aerodynamically for being lofted in a convection column and traveling for long distances while still burning, and is one of the primary ignition sources for long range spotting in Australia. The bark on North American trees is different, but the methods used by the Australian researchers could be used to collect similar spot fire occurrence data in the United States and Canada which could lead to improved spotting and fire behavior models.

Those of us who have been wildfire fighters for many years have known this for years. 🙂
Joseph King
Interesting to learn that Australia was terrorized by wildfires in 1965. Sept 1965 was also busy for Sonoma, Napa and Lake counties in Northern California where they experienced an event that nearly mirrored the North Bay Fires on 2017… I don’t believe in coincidence anymore.