
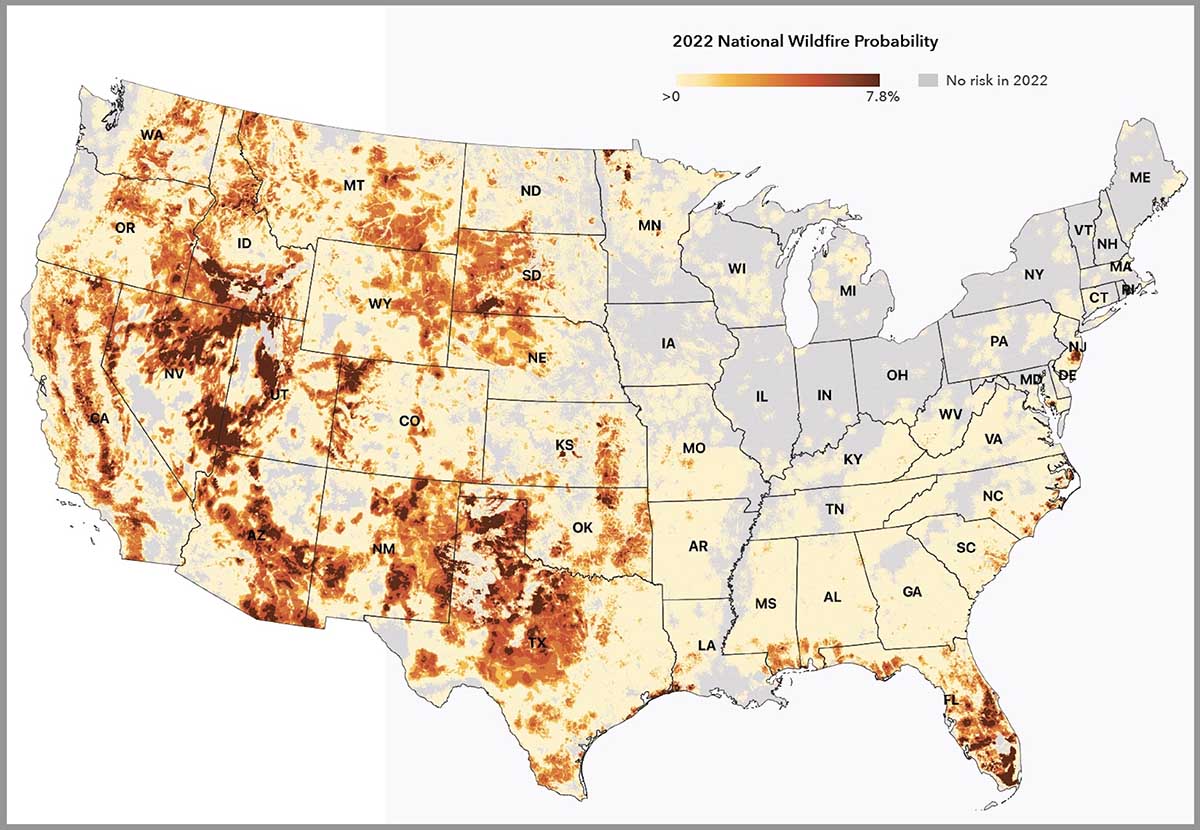
An organization has developed a system for calculating the wildfire risk of 145 million properties this year and 30 years from now.
The First Street Foundation’s Risk Factor is a free source of probabilistic wildfire risk information where anyone can enter a street address and within seconds see the risk for both wildfires and floods at that location.
We tested the system by entering property addresses for two locations that were severely impacted by recent wildfires.
- The Marshall Fire near Boulder, Colorado last year destroyed 1,091 homes and damaged 179. We looked up the Risk Factor for three properties in a community that had total destruction. The result was that they all had a 3 of 10 “moderate fire factor”, and individually a 1.84, 2.0, 1.84 percent chance of being in a wildfire over the next 30 years.
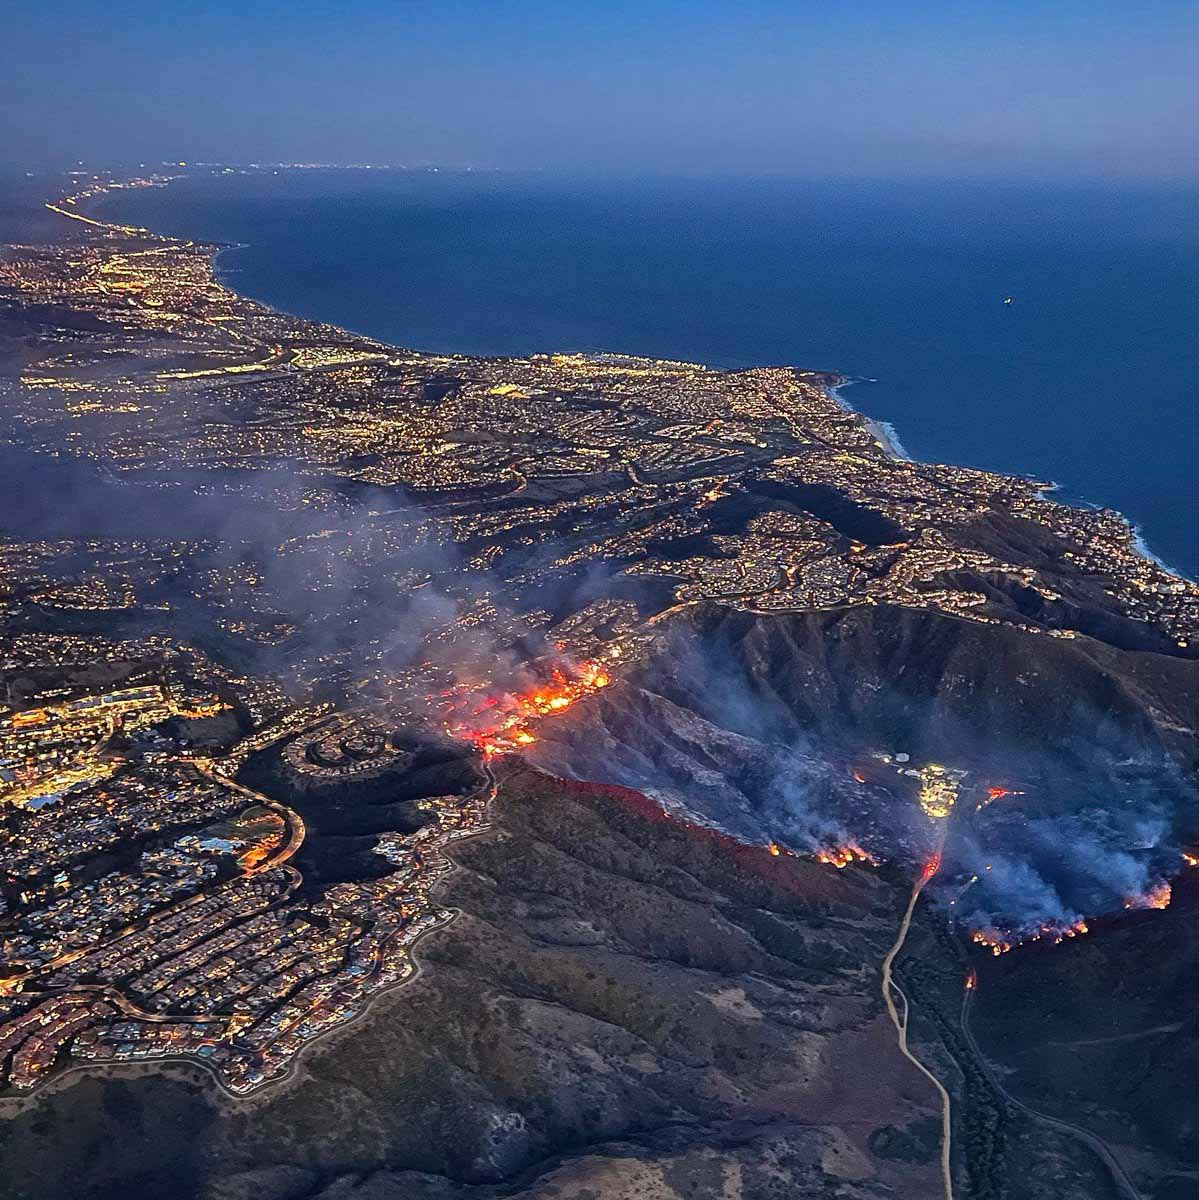
- The Coastal Fire (see photo below) destroyed 20 homes last week in Laguna Niguel, California and damaged 11. The two we looked at in the zone with severe destruction received a 3 of 10 “moderate fire factor” with a 0.93 and 1.54 percent chance of being in a wildfire over the next 30 years. The homes were at the top of a steep brush-covered slope.
The text below is how the First Street Foundation describes their rating system for wildfire risk:
There has long been an urgent need for accurate, property-level, publicly available environmental risk information in the United States based on open source, peer reviewed science. In a mission to fill that need, First Street Foundation has built a team of leading modelers, researchers, and data scientists to develop the first comprehensive, publicly available risk models in the United States. Beginning with flood and now wildfire, First Street works to correct the asymmetry of information in the market, empowering Americans to protect their most valuable asset–their home while working with industry and government entities to inform them of their risk.
METHODOLOGICAL OVERVIEW
The First Street Foundation Wildfire Model integrates information on fuels, wildfire weather, and ignition into a Fire Behavior Model. The wildfire model requires data on the combustible fuels which may contribute to wildfire across the United States. The 2016 update, Version 2.0.0, of the canonical U.S. Forest Service (USFS) LANDFIRE (LANDFIRE, 2021) fuels dataset at the 30 meter resolution serves as a baseline of this fuels estimate, and that dataset is updated by including additional information of all known “disturbances” between 2016 and 2020 which could modify or change the fuels in a way not captured in the original dataset. These “disturbances” include activities such as recent wildfires, prescribed burns, harvests, and other forest management practices.
Another important and novel update included in the First Street Foundation Wildfire model is the reclassification of homes and other buildings from a “nonburnable” fuel type to a “burnable” fuel type. Typically, homes and other buildings are classified as nonburnable fuel types within LANDFIRE v2.0.0. In order to allow the wildfire behavior model to more accurately estimate how wildfire moves through the Wildland-Urban-Interface (WUI), properties within the WUI must be replaced by a burnable fuel type so as to not block the modeled wildfire spread.
To represent a wide range of possible weather-driven wildfire conditions across the landscape within the simulations employed here, the model utilizes a decade of NOAA weather data, the 2011-2020 Real Time Mesoscale Analysis (RTMA) dataset (NOAA/NCEP, 2022) augmented by data from Oregon State’s PRISM dataset (Parameter-elevation Regressions on Independent Slopes Model; PRISM, 2021).
These weather data include hourly surface wind, air temperature, relative humidity, and precipitation information at the 2.5 km horizontal resolution. This weather data supports a wide range of possible weather conditions, not to recreate any particular wildfire events, but to drive the wildfire behavior model millions of times in a Monte Carlo simulation scheme to derive 2022 wildfire hazard estimates.
Similarly, for 2052 the same weather time series was used to drive the simulations, but the air temperature, humidity, and precipitation were bias-adjusted to 2052 conditions following the CMIP5 RCP4.5 ensemble results. Rather than applying a bias-adjustment to the wind time series for the future climate, the same winds from the 2011-2020 time series were used to drive the 2052 simulations to reduce sensitivity of the model to highly uncertain future predictions of winds.
One of the primary indicators of where future wildfires will occur is informed through data on historical wildfire occurrences. These historical wildfires help to inform where wildfires may occur vis-à-vis the Fire Occurrence Database (FOD) developed by the USDA Forest Service (Short, 2014; Short, 2021). An open source wildfire behavior model was used, ELMFIRE (Eulerian Level Set Model of Fire Spread). This work does not develop new techniques for wildfire modeling, but rather implements computationally efficient and scalable modeling techniques at a high resolution based on existing science, wildfire probability, and hazard modeling paradigms. These scalable techniques make it practical to more easily conduct wildfire simulations at the 30 meter resolution across the entire country, enabling property and building specific assessments of wildfire risk.
For each 30 meter pixel across the country, information is recorded on the distribution and occurrence of burn incidence, flame lengths experienced, and the relative amount of embers which land in the pixel. These provide estimates of:
Burn probability: the estimated likelihood of the area burning during any single year.
–Fire intensity: estimated flame lengths, including maximum, average, and sum of all flame lengths experienced.
–Ember exposure: the relative amount of embers which land in an area due to nearby simulated wildfires.

OK, if they predicated their model upon LANDFIRE than it is already corrupted and useless. LANDFIRE veg layers are screwed up like a football bat and have been since it’s inception. It was used for programmatic fire planning to the detriment of many units. LANDFIRE has the majority of the great basins Pinion Juniper “woodlands” exhibited no differently closed canopy Lodgepole pine, and that is just for starters. LANDFIRE also shows timber models in high sage areas devoid of trees. The lesson here is, don’t pour resources and into something that relies on a model the FS built with the lowest bidder. LANDFIRE is a typewriter in a tablet computing age.
I disagree very strongly with the accuracy of this model. I input several addresses in my neighborhood and its results are way, way off. Based on notices some of my neighbors received from their insurance companies, I think several are already using the model. A huge disservice in my opinion. BTW, I am retired after close to 40 years in the wildland fire arena. Several as the Firewise Coordinator for my state.
Which model are you referring to?
We moved from a home in the middle of an oak woodland where PG&E would cut the power several times a year due to wildfire dangers to a gated community with very few trees, stucco exteriors and slate roofs. This property has been rated at over 11% chance of a wildfire incident while the home in the foothills has a little over 2% chance of a wildfire incident in the next 30 years. Their assumptions and algorithms are VERY flawed. Sure hope insurance companies don’t start reacting to these false assessments. I wonder if the closeness of 1 home to another was the main consideration in First Street’s algorithm.
Predicting a fire is like predicting a wild animal it all depends on the natural habitat where the animal is present, this can change from day to day sometimes in a very drastic way. Predictions on past events can be very deceiving unless you have somebody in the field to verify each and every square meter because things change everyday just like people do l. It’s a great idea and hopefully with enough experts in the field verifying all the information that the algorithms can give us. Someday this
will be a very useful tool.
Well if my neighbors grill is knocked over by wind and it ignites the flammable human planted vegetation on our adjoining wooden fence…Then perhaps it earns it’s predicted rating of high risk to my house.
The Flood Risk Factor was totally inaccurate. Only a flood of Noahic proportions is possible.
The Wildfire Risk Factor was 100% accurate considering it being one of the top ten “Death Traps” listed in the Wrstern Communities Threatened by Wildfire publication.
Thanks for posting this.
It’s a fine example of Garbage In/Garbage Out. The website claims 5 wildfires within 20 miles of my home since 1984. A quick eyeballing of the CalFire fire history map shows, hmmm … just a second, ran out of fingers… oops, ran out of toes – sweetie, can I borrow your hand for a moment, OK, both hands… um could you take off your sneakers… well, we’re out of digits, but it’s over 20. So whatever database it is those guys are using, it’s not very complete.
Fairly accurate for fire rating but not flooding. Map assumes homes on any size of waterway are subject to flooding when in reality, only a relatively small number are in a flood plain and downhill of a dam. My house, for instance, is 30 feet above a small creek. My house may burn but flooding is very unlikely.
When I entered my street address, city, state and zip. Their app couldn’t find it. Even though I live in an Corps of engineers flood plain. I then entered my sons house in Montana, right between Bozeman and Belgrade, couldn’t find it. Entered the local forests District office. No Joy. Entered a friends house in Mammoth Lakes California which backs up against National Forest land with brown trees behind it. (A truly nightmare WUI in all respects.) No Joy. Either the app is completely broken or these folks have absolutely no idea what they are doing. Sort of reminds me of the ISO when they went for profit. No credibility whatsoever. When I was the Vollie Chief in my FPD, I had to go to bat for more than one homeowner because they lost their insurance or saw a radical increase in their rates due to mis-information about terrain, fuels etc. My impression is that they are just a bunch of academics who don’t know how to interpret the very public datasets they had at their disposal, or they never left their desks and did ground truthing. Poor excuse and a waste of taxpayer money. Their map reminds me of old cellular coverage maps that were at best, bird cage liners. PFFT!
Then I ran the Hospital in Paradise California. Not found. I hope the app is screwed up.
Ground truthing is haaaard for folks behind a keyboard. BITD when I did Firewise…ground truth was a requirement..if its ISO and and academics lookin at GIS layers only and not getting out on the land…I agree….PFFFFFT
I have to agree with the previous comments. This assessment is not accurate. I put in my current address and it is at high risk of wildfire. It is very unlikely to have a large wildfire due to urban development. I put in my previous address, in the Sierra Foothills, with a heavier fuel load and interspersed WUI and it was at a low risk of wildfire. The complete opposite of what our insurance company says is the case. Their methodology is extremely flawed.
I entered my address and it gave me an extremely low risk rating. I guess endless square miles of lodgepole pine, mixed con and extreme topography is good to go these days! Lol!
I looked up our home and their rating was completely inaccurate, blindly putting us in the high risk zone. They misidentified the near vegetation, the roof, and potential for fire intensity as “high” when I know for certain it is “low.” So a dumb algorithm is going to devalue our home and raise our insurance based on completely inaccurate information. Thanks unquestioning national media.
Clyde, this has nothing to do with the media. You’re a little confused.
Well, I will be the first naysayer. I punched in my address and it says I have a low flood risk and a severe fire risk. I agree with the flood prediction, but you couldn’t get my home involved in a wildland fire with 50 mph winds, 2% humidity, 110Degrees, and a bad burn boss. Absolutely not a chance of my home being in a wildland fire. So, a couple questions: Who paid for this assessment tool? (My guess is us taxpayers through some sort of grant). Secondly, are the insurance companies going top use this data to raise homeowner insurance rates? If so, then there are going to be a lot of lawsuits from people like me who live in the middle of the desert in a subdivision full of stucco siding and tile roofs, and gravel yard. I guess with climate change my rocks might start carrying fire???