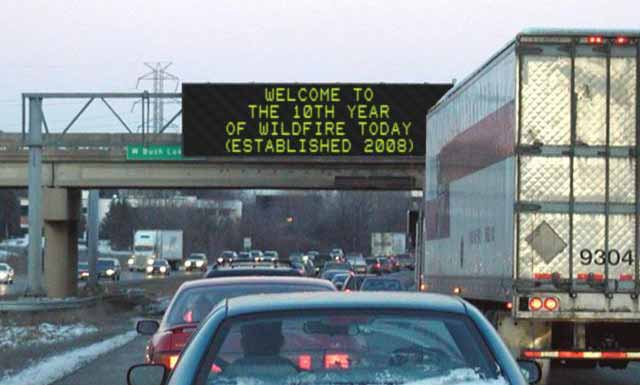
Our tenth year begins

Wildfire Today started January 6, 2008

wildfire today tenth year

Ten years ago today I started a little blog where I could post my thoughts about what was happening in the world of wildland fire. It was hosted on Blogger.com but used our own domain name, WildfireToday.com. When registering the name I was surprised to find that it was still available. I was also surprised to find FireAviation.com still available in November 2012.

After a year or two at Blogger, I migrated the blog to a site that hosted about a dozen fire-related blogs. Our site maintained its own identity, but after a few months I became disenchanted with some of the rules and restrictions, and finally moved Wildfire Today to its own self-hosted site, where it has remained.

It is the readers and those who participate with intelligent, thought-provoking comments and questions that make this a destination for millions of visitors every year who are interested in an exchange of ideas. Of course, we owe a lot to the advertisers who support the site making it possible to pay the hosting expenses and even a stipend to our guest writers when I am unavailable.

If you are a regular visitor, an advertiser, or if you’re here for the first time — thank you for your support!

Is a little pre-fire mitigation around structures better than none?

According to experience from Colorado’s Fourmile Canyon Fire, sometimes the answer is “No”.

When Dave Lasky was leading the effort in the Four Mile Fire Protection District not far from Boulder, Colorado conducting pre-fire mitigation near structures, he and others assumed that doing SOMETHING, cutting trees and building slash piles, would be better than doing nothing. They realized it would not be the total solution in the wildland-urban interface (WUI), but when the Fourmile Canyon Fire started on September 2, 2010 the Fire Protection District found out how wrong they were.

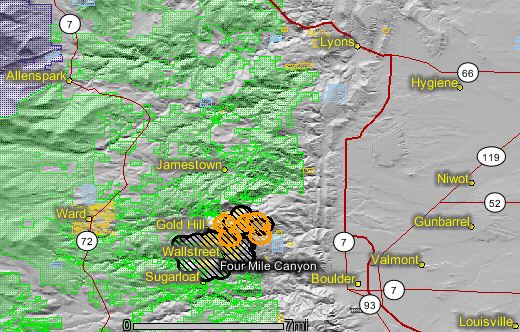
Fourmile fire_map_MODIS_0418_9-8-2010
Map of the Fourmile fire near Boulder, showing heat detected by the MODIS satellite at 4:18 a.m. Sept. 8, 2010. Map by Wildfire Today and NASA.

After the ashes cooled, Dr. Jack Cohen, a U.S. Forest Service fire researcher who has investigated the effects on structures at numerous WUI fires, found what he has seen many times before (more details here). Most of the damaged homes, 83 percent in this case, ignited from airborne fire embers or surface fire spreading to contact the structure; not from high intensity crown fire or direct flame impingement.

The fuel reduction along travel corridors may have helped residents to evacuate, but the unburned slash piles, Mr. Lasky said, could have been a problem:

 In several areas, our crew’s piles were associated with complete stand mortality. We created ladders into the canopy. At best, these unburned piles represented a sad waste of money, and at worst, it is possible that if we hadn’t treated them, these stands might not have carried fire.

Below are excerpts from an article written by Mr. Lasky about what he learned. It first appeared at the website for Fire Adapted Communities Learning Network.


“Doing something is not better than doing nothing.
When the mitigation crew approached residents in the past, they often said, “I didn’t move up here to see my neighbors. I don’t want to cut trees.” In an effort to build momentum, we often performed work that we knew was not reflective of the best science, cutting fewer trees than we should have. This practice was in regard to both defensible space as well as shaded fuel-break projects. The hope was that as communities adjusted to the cosmetic changes, we’d be able to reenter and accomplish more.

“I still hear many colleagues say “let’s just get something done.” I believe this is wrong. We need to do it right or not do it at all. Half measures are proven to fail and engaging in them has great reputational costs. In the current climate of high-profile, catastrophic fires, I am not interested in fear mongering. But I am interested in applying our limited resources to only those communities that are fully committed.

“It’s not just about cutting trees in the wildland-urban interface.
Fuels crews are run by firefighters. Perhaps they should be run by architects. In retrospect, we spent far too much money on fuels reduction and not enough on assisting residents with the installation of fire-resistant building materials and landscaping. Few of the homes lost were directly impacted by crown fire; rather, embers undoubtedly ignited the fine fuels around them, which eventually led to the loss of entire structures. In many instances, residents would have been better served by our crew putting a decorative stone perimeter around the structure. Many residents are capable of cleaning gutters, but less can move tons of gravel. We had chainsaws, and we knew how to use them. We should have picked up our shovels instead.”

Last year’s California wildfires, graphically

Some people learn or are stimulated most effectively by reading, or hearing someone talk about a subject. Others, like myself, respond better visually. For me, there is truth in the old saying, “A picture is worth a thousand words”. So I can appreciate well-thought-out graphics that tell a story.

Lauren Tierney started her job with the Washington Post’s graphics department in November and yesterday she had her first graphics story published. If you click on the image in the Tweet below, the perimeters of wildfires that burned last year in California will be superimposed around an outline of the District of Columbia.

The article at the Washington Post website has additional fire-related graphics. One shows all of the 2017 fires on a map of California, and another allows you to choose which city you’d like to compare to the Thomas Fire, which became the largest in the recorded history of the state.

Frankly, when a reporter compares the size of a fire to a city, like, “The XXX Fire is the larger than Pittsburgh”, that does not mean a lot to me. But these maps take it to a new level.

I had occasional problems getting all of the graphics to render properly using the Chrome web browser, but they worked fine with Firefox.

More evidence of the “fireproofing effect” of insect outbreaks in a forest

Additional research finds evidence of a “fireproofing” effect on host trees from defoliation due to western spruce budworm outbreaks.

Above: Grand fir in Oregon defoliated by western spruce budworms. William M. Ciesla.

There is no dispute that severe outbreaks of western spruce budworm (WSB) and mountain pine beetle (MPB) in a forest have huge visual impacts. Many land managers have worried about more, larger wildfires and politicians have used it as an excuse for more logging.

But the commonly held belief that the effects will lead to higher intensity, more rapidly spreading wildfires has been disproven many times in the last eight years by scientists.

We first wrote about this issue in 2010 (Firefighters should calm down about beetle-killed forests) when some early research started to bring the facts to light.

The WSB and MPB attack trees very differently. The WSB defoliates the tree, consuming the needles and removing fuel from the canopy relatively quickly. The MPB kills the tree from the inside, leaving the dying “red” needles on the tree until they fall off in one to two years. The possibility of crown fires may increase during that red needle period, but it makes sense that fewer fine fuels in the canopy would reduce the fire intensity and make it less prone to transition from a ground fire to a crown fire. Both types of attacks eventually produce more course fuel on the forest floor as the branches break off and  the trees eventually fall over.

Research conducted by Daniel G. Gavin, Aquila Flower, Greg M. Cohn, Russell A. Parsons, and Emily K. Heyerdahl found evidence of a “fire proofing effect” for outbreaks of WSB. It does not address the MPB.

Below is an excerpt from their work:


“Extrapolating Results: Reduced Tree Mortality

“Taken together, the tree-ring and modeling studies suggest a lack of synergism between WSB outbreaks and wildland fires. However, a different kind of synergism may exist: Defoliation might dampen the severity of a subsequent wildfire. To explore this possibility, we used existing empirical equations that show the probability of mortality due to defoliation (fig. 3A) and the probability of mortality due to crown scorch (fig. 3B), combined with the simulated results of canopy consumption at different levels of defoliation (fig. 3C), to extrapolate the summed probability of mortality under a range of surface fire intensities and defoliation levels (fig. 3D). The results suggested a distinct “fireproofing” effect of defoliation: The increased risk of mortality by WSB is more than compensated for by reduced foliage consumption during moderate surface fire intensities. For example, trees with 50-percent defoliation have a distinctly lower probability of mortality when surface fires are less than about 74 kilowatts per square foot (800 kW/m2 ).

“However, we considered only the partial effect of defoliation on fire occurrence; we did not take into account other effects of WSB outbreaks, such as mortality of small trees. Of course, field observations are required to test our prediction. Remotely sensed burn severity maps, in combination with prior surveys of insect effects, could address this issue. One such study of the 2003 B&B Complex Fire in Oregon showed that prior defoliation had a marginal effect on reducing fire severity that was not statistically significant (Crickmore 2011). However, an analysis by Meigs and others (2016) of all post-WSB fires in Washington and Oregon from 1987 to 2011 showed that there is a statistically significant reduction in fire severity that persists for up to 20 years following an outbreak. Thus, the effect of defoliation on crown fire behavior modeled by Cohn and others (2014) appears to be confirmed by the analysis of burn severity data by Meigs and others (2016).

“Fireproofing Effect?

“It may seem reasonable to assume that extensive defoliation, causing sustained low levels of tree mortality in mature trees, should have a measurable effect on wildfire occurrence. However, fire is a highly variable disturbance in itself, and it is highly sensitive to specific climate and winds during the fire event. The scale of fuel changes wrought by WSB may be too small to affect subsequent fire probability in ecosystems where fire is limited by fuel moisture and ignition sources rather than fuel availability. Our data show that these two disturbance types do not share similar histories, despite a common link to drought events.

“Nevertheless, we hypothesize a “fireproofing” effect on host trees from defoliation due to WSB outbreaks. Although such an effect has been detected statistically from recent fire events (Preisler and others 2010; Meigs and others 2016), the inferred processes at play remain to be studied in detail at the site scale.”


UPDATE January 5, 2018: These researchers are not the only ones with similar findings on this subject. If you would like to read more, scroll through the articles on Wildfire Today tagged “beetles”.

Wildfire potential, January through April

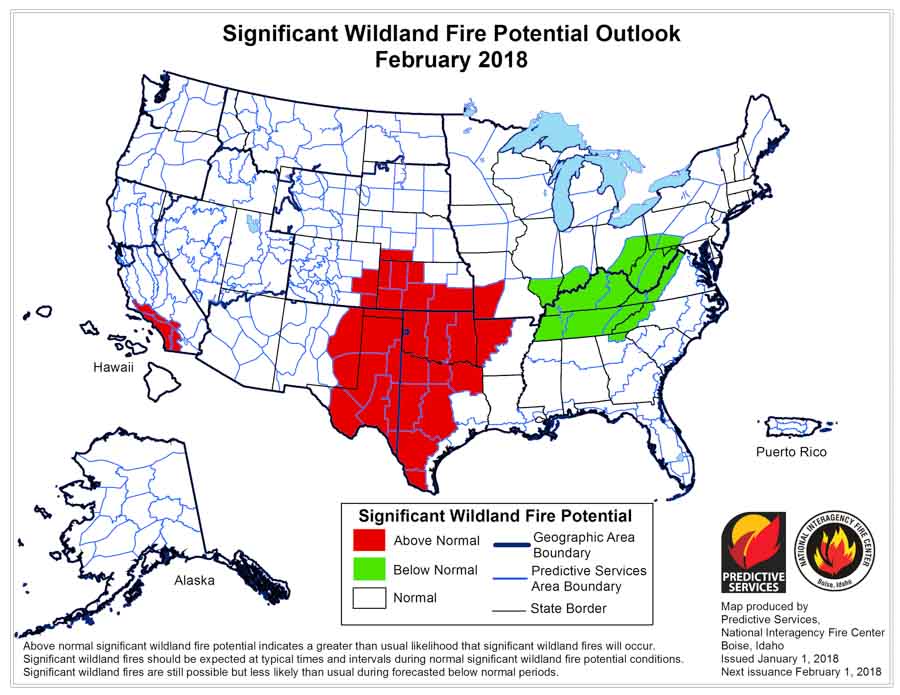
Above: wildfire potential for January, 2018.

(Originally published at 12:55 p.m. MDT January 2, 2018)

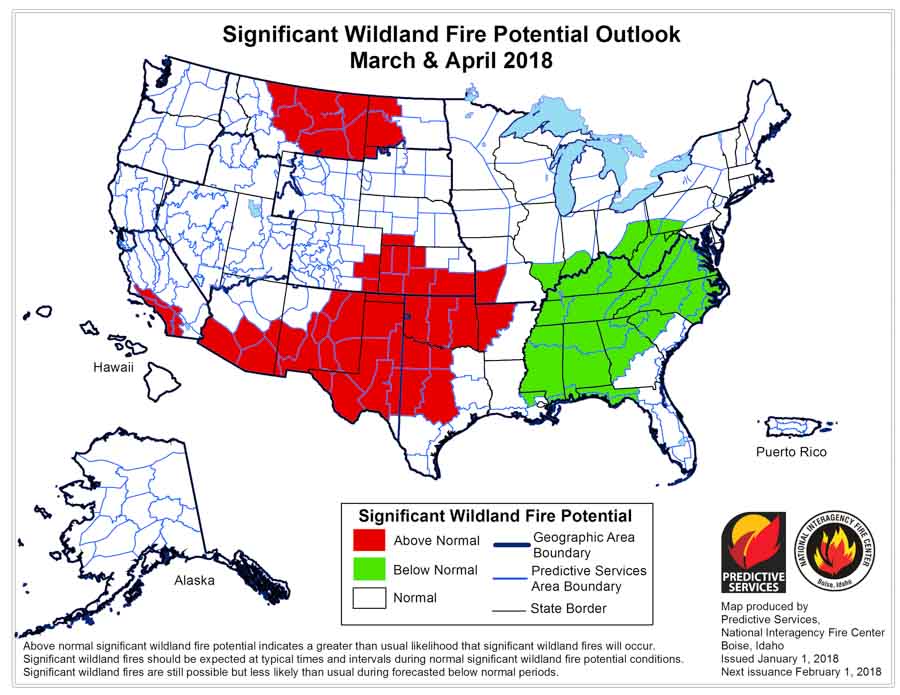
On January 1 the Predictive Services section at the National Interagency Fire Center issued their Wildland Fire Potential Outlook for January through April. The data represents the cumulative forecasts of the ten Geographic Area Predictive Services Units and the National Predictive Services Unit.

If the prediction is accurate, Southern California should see higher than normal wildfire activity throughout the period, with increasing potential in the southwest and southern great plains. The forecast for the southeast is for normal to below normal activity.

Below are:

  • The highlights of the NIFC narrative report for the next several months;
  • NIFC’s monthly graphical outlooks;
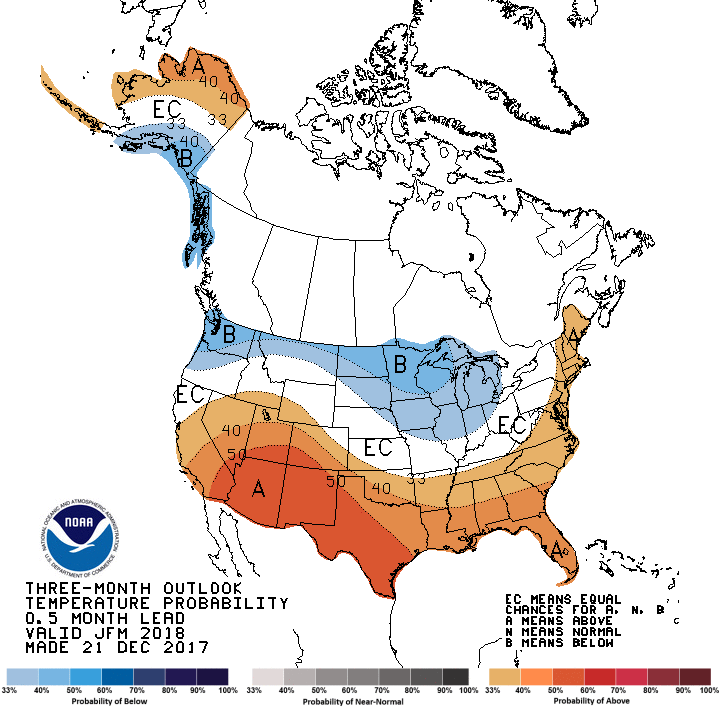
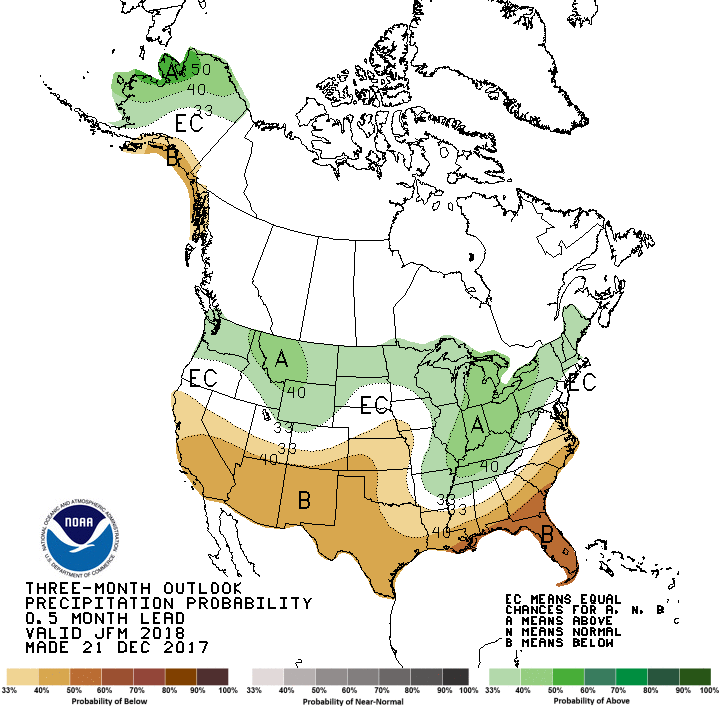
  • NOAA’s three-month temperature and precipitation forecasts; and
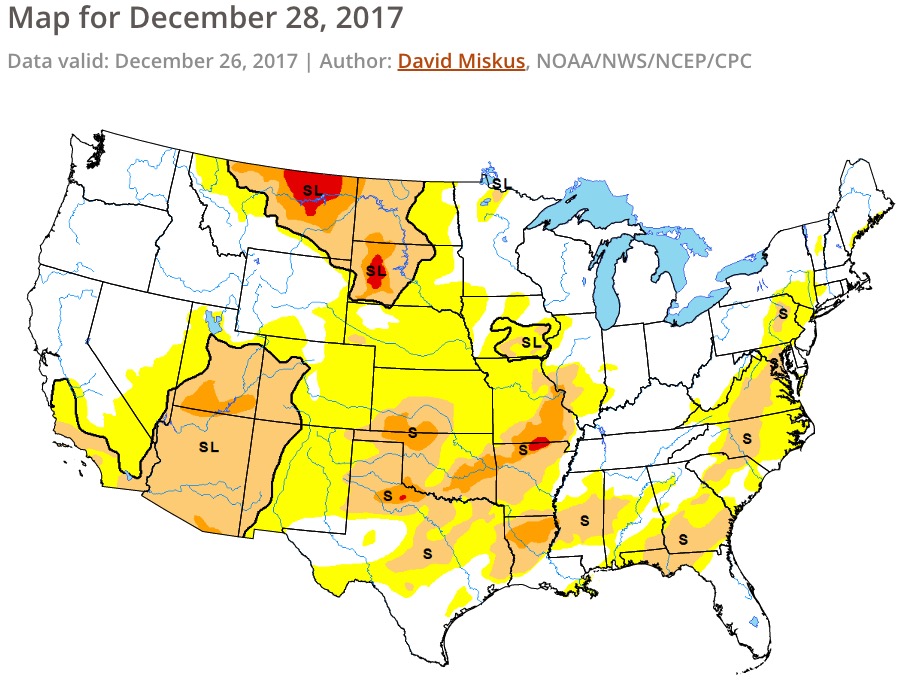
  • Drought Monitor.

“…Looking forward, a less amplified pattern is expected to develop for January and February with the mean position of the high pressure ridge being along or just off the West Coast. This should result in overall slightly colder than average conditions in northern areas with pockets of above average precipitation over the Northwest and Great Lakes regions. There is some concern that an active, westerly flow could produce overall warmer and drier than average conditions in March and April in these areas. Across the southern tier of the country, the overall warmer and drier than average conditions will continue through February and into March and possibly April. For this outlook period, the areas of note for increased fire potential will remain Southern California and the southwest. The Great Plains could see periodic increases in activity when wind events arise.”

Wildfire potential February Wildfire potential March Apriltemperature forecastprecipitation forecast

Drought Monitor
Drought Monitor

Fuels and fire behavior advisory issued for Southern California

The lack of precipitation this fall, along with a prolonged period of warm, dry, and occasional windy weather has caused fuels to be extremely dry across portions of Southern and Central California.

Welcome to what may become the new normal — for a Fuels and Fire Behavior Advisory to be issued for an area in the Western United States hours before New Years Eve. The Predictive Services office in the Southern California Geographic Coordination Center issued one on Friday for the following areas:

  • Southern Sierra
  • Central Coast Interio
  • Central Coast
  • South Coast
  • Western Mountain
  • Eastern Mountain, and,
  • Southern Mountains

A similar Advisory that was issued two weeks ago reached its expiration date so it was reupped for another 14 days.

[pdf-embedder url=”https://wildfiretoday.com/wp-content/uploads/2017/12/12-29-2017_Fuels_and_Fire_Behavior_Advisory.pdf”]