The National Interagency Fire Center published a photo of a chain saw operator on their Facebook page. After about 28 hours it had collected over two dozen comments, with many of them being critical of what they saw in the photo.


The National Interagency Fire Center published a photo of a chain saw operator on their Facebook page. After about 28 hours it had collected over two dozen comments, with many of them being critical of what they saw in the photo.
Wildfire Today has unabashedly advocated the the use of devices that would make wildfire supervisors aware in near-real-time the location of their firefighting resources. Our thinking is, if that and the location of the fire were known on the Yarnell Hill and Esperanza Fires the lives of 24 firefighters might have been saved. (See tag for “Holy Grail of Wildland Firefighting Safety”).
In 2014 the governor of Colorado signed legislation creating the Center of Excellence for Advanced Technology Aerial Firefighting (CoE), whose mission statement says they will:
…research, test, and evaluate existing and new technologies that support sustainable, effective, and efficient aerial firefighting techniques.
Apparently the organization interprets that mission very broadly since they have started a study to evaluate the effectiveness and practicality of small GPS-enabled devices that can communicate with firefighters on the ground and keep track of their location via satellites.
In 2012 the U.S. Forest Service bought 6,000 devices like this. We have not heard much about how that acquisition turned out.
Below is information about the new Colorado project provided by the (CoE).
****
“In the interest of improving communications for, and safety of, wildland firefighters, the Center of Excellence (CoE) is evaluating the use of satellite-based messenger devices by Division of Fire Prevention and Control (DFPC) firefighters and cooperators. These devices can enable firefighters to send messages and they also track the location of personnel without using cellular or conventional radio networks. To date, the primary users of these devices have been the civilian outdoor community; however, military and civil government agencies have begun experimenting with integrating these devices into their operations. Early results show that satellite messengers can be effective at supplementing existing radio and cellular communication networks.
Device Overview
Two types of devices are being evaluated by the CoE. The first is the lower-cost SPOT Gen3, which can send one-way messages over the Globalstar satellite network. Since SPOT Gen3’s have sending capability only, it is not possible to obtain delivery confirmations for successful messages. To increase the probability that messages are successfully delivered, the SPOT sends multiple copies of the same message.
The SPOT Gen3 device can send the following types of messages:
The second device that the CoE is evaluating is the DeLorme inReach. Two models of the inReach are being evaluated—the basic model and a premium model that includes GPS mapping and navigation. The inReach can send two-way messages over the Iridium satellite network, which provides delivery confirmations for successful messages. In addition, text messages can be sent to firefighters in the field.
The DeLorme InReach device can send the following types of messages:
The SPOT Gen3 device retails for $149.99, the DeLorme inReach base model (inReach SE) for $299.99, and the premium model (inReach Explorer) for $379.99. Satellite service subscriptions comprise a substantial portion of the cost of operating these devices, with cost primarily governed by how frequently tracking points can be sent by the device. Service for the SPOT device must be bought on an annual basis, while service for the DeLorme devices can be purchased on either an annual or a month-to-month basis. If the DeLorme devices are used for 8 months or less each year, the month-to-month plan will be the most cost-effective option.
Summary of Device and Service Costs:
| SPOT (annual) | DeLorme Contract (annual) | DeLorme Month-to-Month (plus $24.95 annual fee) | |
| Device Cost | $149.99 | $299.99/$379.99 | $299.99/$379.99 |
| Base Option |
|
|
|
| Mid-Range Option |
|
|
|
| Premium Option |
|
|
|
The following chart represents the cost of buying and operating a device for two years, assuming that the DeLorme devices are on the month-to-month plan and are used for 6 months each year:

An enterprise plan is also available for the DeLorme devices. This plan charges for each byte of data used by the device rather than by the various texting and tracking features. As a result, a direct comparison to the consumer plans is difficult, but superior value may be found if usage is carefully monitored. Real-world testing of this plan is being conducted by the CoE to gain insight into its value.
Both the SPOT and DeLorme devices may be used by DFPC wildland fire personnel during fire assignments and remote project work. Using either device, personnel in need of emergency medical assistance or personnel lost in the wildland will be able to summon search and rescue assistance. Additionally, personnel will have the ability to send messages with other content to supervisors or incident commanders, though this functionality is limited with the SPOT device. Finally, the location of personnel can be tracked in near real-time using either the companion websites for the devices or using the Colorado Wildfire Information Management System (CO-WIMS).”

Photo above: 19 white hearses brought the Granite Mountain Hotshots back to Prescott, Arizona, July 7, 2013. They were killed after being overrun by the Yarnell Hill Fire. Photo by Bill Gabbert.
A bill introduced in the Washington state legislature would provide for state employed firefighters a system that would track their location. Knowing where firefighters are while working on a rapidly spreading fire is crucial to ensuring their safety, and is half of what we have called Holy Grail of Firefighter Safety. The other half is knowing the real time location of the fire relative to the personnel. If a Division Supervisor, Operations Section Chief, or Safety Officer is monitoring this information they could potentially warn firefighters that their present position is in danger when the fire begins to spread in their direction. A system like this might have saved 24 lives on the 2013 Yarnell Hill and 2006 Esperanza Fires. In both cases the firefighters and their supervisors did not have a clear understanding of where the fire and the firefighters were.
In a January 18 article about how to reduce the number of fatalities on wildland fires, we wrote:
When you think about it, it’s crazy that we sometimes send firefighters into a dangerous environment without knowing these two very basic things.
Below is a section from House Bill 2924 as introduced in the Washington State Legislature on January 27, 2016, sponsored by six lawmakers:
…Require all fire suppression equipment and personnel in its employ or direction to be outfitted with an electronic monitoring device that utilizes global positioning system technology to protect the safety of wildland firefighters…
The Seattle Times wrote about the proposed legislation. Here is an excerpt:
…DNR has done some early research on GPS, according to Bob Johnson, the agency’s wildfire-division manager. Setting up a system could cost $1.5 million, Johnson told lawmakers.
“Improving safety for our firefighters is paramount and we’d view this technology … as a viable supplement to existing safety measures,” wrote Mary Verner, DNR’s deputy supervisor for resource protection. “Though, it, like many technologies, does have its limitations.”
Challenges, benefits
GPS locaters are used by various departments and agencies around the country, according to Triplett.
But there aren’t yet national standards for GPS systems, so when firefighters come from different agencies or another state to fight large blazes, they may not have equipment that works together, according to Triplett.
Steve Pollock, chief regional fire coordinator for the Texas A&M Fire Service, said it took about three years to develop that agency’s GPS system. When it goes live in July, it will be able to track more than 200 bulldozers, fire engines and coordinating vehicles, he said…
There needs to be leadership, nationally, to develop standards for firefighter tracking systems so that the devices used by different agencies are compatible and interoperable. This should be the duty of the National Wildfire Coordinating Group, National Association of State Foresters, U.S. Forest Service, National Park Service, and Bureau of Land Management.
If individual state and local organizations spend millions on stand-alone systems that can’t be used outside their jurisdictions it will be FUBAR. Leadership is needed. Today.

More common denominators of tragedy fires.
Continue readingLast summer a firefighter received severe burns to his back, both legs, and left arm after a drip torch attached to the pack on his back leaked fuel which ignited. The accident occurred September 9, 2015 on the Perdida Fire managed by the Bureau of Land Management northwest of Taos, New Mexico. The firefighter was one of seven igniters assigned to the fire which had a total of nine personnel.
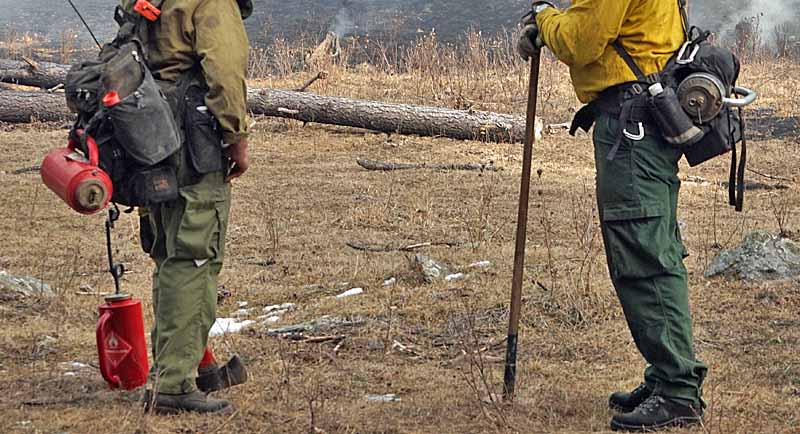
The individual who was injured had been igniting with a drip torch while he carried an extra one attached to the pack on his back. The torch leaked fuel which caught fire.
From the recently released report about the incident:
…Igniter #1 saw that the victim’s line gear and back of his legs were on fire so he tried to put the fire out with dirt and by patting at the flame with his gloved hand. Igniter #1 told the victim to get on the ground and they both fell together. The victim got back up and ran while trying to get his glove off and then his pack, successfully. The victim then stumbled but regained his footing briefly before falling back to the ground. At this point, Igniters #1 and #3 converged and patted out the fire on the victim’s pants…<
The photos below are from the report.
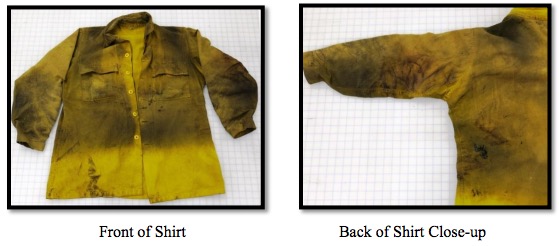
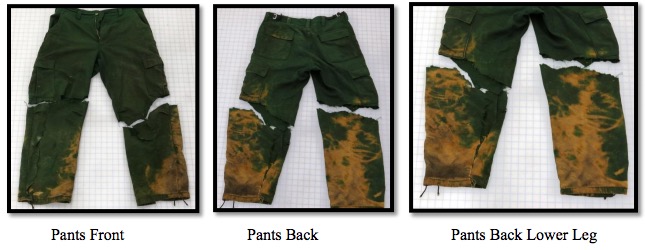
One of the issues pointed out in the report is a significant delay in requesting a medevac. About 40 minutes elapsed before medevac was requested, and that was for a ground ambulance even though the victim apparently had second and third degree burns. That request was quickly upgraded to transport by helicopter. The report concluded that according to the burn injury protocol a medevac should have been initiated upon the determination of second and third degree burns and the remoteness of the incident.
The medevac pilot was unable to communicate with the personnel on the ground because he could not program the frequency into the helicopter’s radio.
The lat/long was called in to dispatch from the incident scene 23 minutes after the helicopter was requested (about an hour after the accident occurred), and four minutes before it landed at the extrication point.
The report recommended that firefighters should avoid carrying extra drip torches on their packs during ignition operations.
We did not see anything in the report about how fire resistant clothing that has not been washed for an extended period of time may, or may not, cause the clothing to lose some of its resistance to fire. But it did say “PPE [personal protection equipment] should be kept clean and inspected often for damage and fuel contamination”.
 For the last several days we have been writing about fatalities on wildland fires — the annual numbers and trends going back to 1910 and some thoughts about how to reduce the number of entrapments (also known as burnovers). Often when we think about these accidents, what automatically comes to mind are the entrapments. When multiple firefighters are killed at the same time it can be etched into our memory banks to a greater extent than when one person is killed in a vehicle rollover or is hit by a falling tree. Much of the nation mourned when 19 members of the Granite Mountain Hotshots were overrun and killed by the Yarnell Hill Fire in Arizona in 2013. A fatal heart attack on a fire does not receive nearly as much attention.
When we discuss ways to decrease deaths on fires, for some of us our first thoughts are how to prevent entrapments, myself included. One reason is that it can seem they are preventable. Someone made a decision to be in a certain location at a specific time, and it’s easy to think that if only a different decision had been made those people would still be alive. Of course it is not that simple. Perfect 20/20 hindsight is tempting for the Monday Morning Incident Commander. Who knows — if they had been there with access to the same information they may have made the same series of decisions.
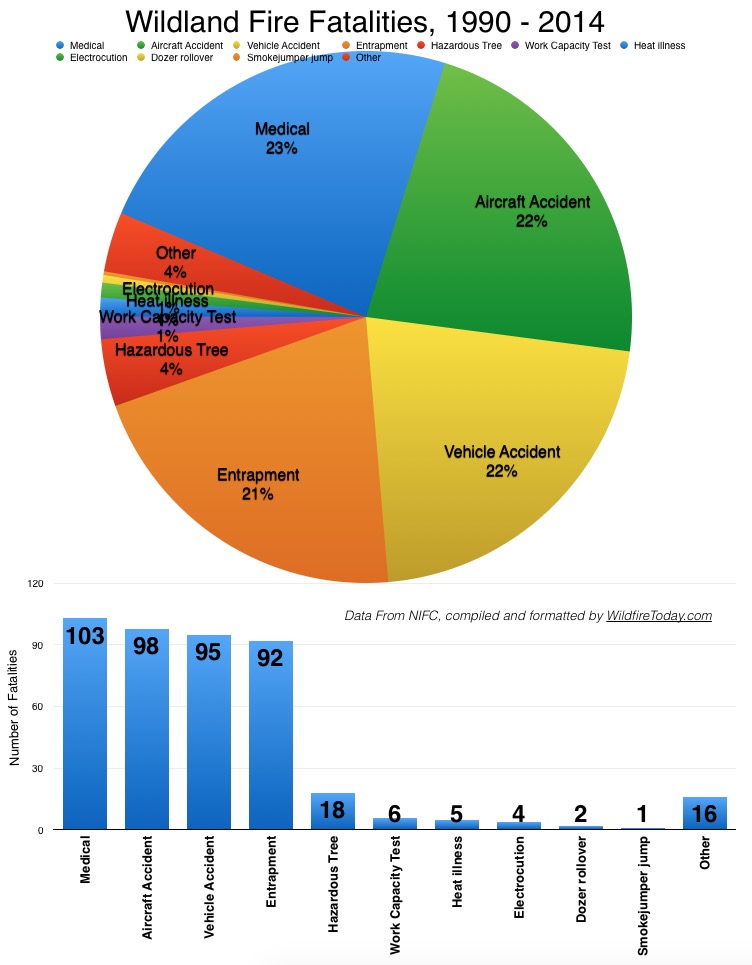
An analysis of the data provided by NIFC for the 440 fatalities from 1990 through 2014 shows that entrapments are the fourth leading cause of fatalities. The top four categories which account for 88 percent are, in decreasing order, medical issues, aircraft accidents, vehicle accidents, and entrapments. The numbers for those four are remarkably similar, ranging from 23 to 21 percent of the total. Number five is hazardous trees at 4 percent followed by the Work Capacity Test, heat illness, and electrocution, all at around 1 percent. A bunch of miscellaneous causes adds up to 4 percent.
NIFC’s data used to separate air tanker crashes from accidents involving other types of aircraft such as lead planes and helicopters. But in recent years they began lumping them all into an “aircraft accident” category, so it is no longer possible to study them separately. This is unfortunate, since the missions are completely different and involve very dissimilar personnel, conflating firefighters who are passengers in the same category as air tankers having one- to seven-person crews — from Single Engine Air Tankers to military MAFFS air tankers.
The bottom line, at least for this quick look at the numbers, is that in addition to trying to mitigate the number of entrapments, we should be spending at least as much time and effort to reduce the numbers of wildland firefighters who die from medical issues and accidents in vehicles and aircraft.

Our piece about trends in wildland firefighter fatalities generated discussion of what the data meant and the fact that there was a great deal of variation from year to year. I wrote a comment below the article that grew larger than I originally expected. Here it is:
****
With an average of 17 fatalities over the last 25 years the annual numbers will never be smooth or without spikes. If there were more than 30,000 deaths each year, like with motor vehicles and firearms, there would be less relative variation from year to year and it would be much easier to see a trend. The wildfire environment is dynamic and volatile, but human factors may be what most influences the number of fatalities, and that is difficult to measure or predict.
We have seen some interesting discussion, on this article and others, about how to reduce the fatality rate. A large percentage of the fatalities on wildfires are caused by medical issues or accidents in vehicles and helicopters. For example in 2014 there were 10 deaths on fires, but none involved burnovers. But having said that, off the top of my head, here are a few areas that need to be emphasized in order to reduce the number of burnover fatalities:
What are your recommendations?
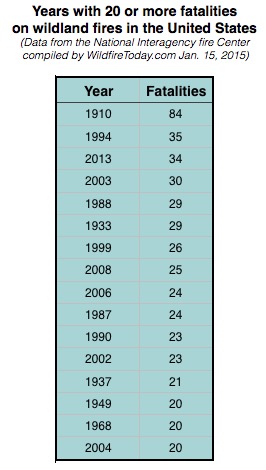
Last week Secretary of Agriculture Tom Vilsack reported that 13 wildland firefighters lost their lives in the line of duty in 2015. That was an increase from 2014 when there were 10 fatalities, and was about a third of the 34 that were killed in 2013 — that year included the deaths of 19 members of the Granite Mountain Hotshots near Yarnell, Arizona.
The National Interagency Fire Center has statistics about line of duty deaths going back to 1910. During that time, according to their numbers, 1,099 firefighters died.
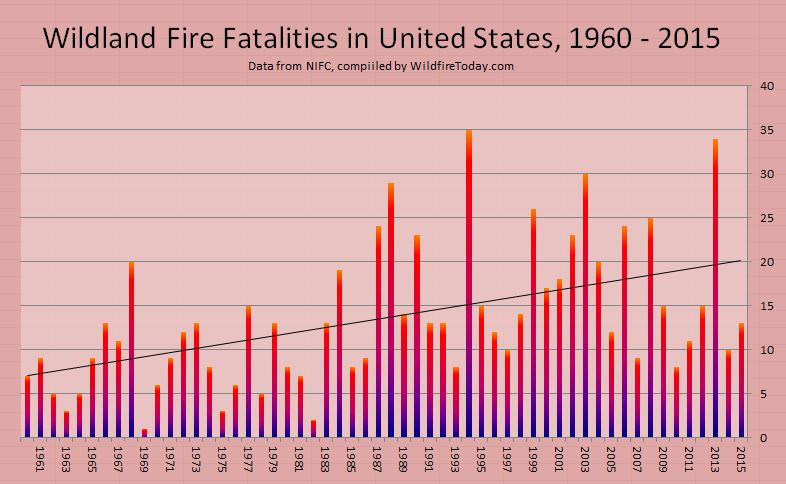
In looking at the 105 years of NIFC data there appears to be an increasing trend. The figures below are the average number of fatalities each year for the indicated time periods:
1910-2015: 10.5
1910-1959: 6.9
1960-1989: 10.2
1990-2015: 17.0
One likely explanation for the apparent increase is that 80 to 105 years ago probably not all fatalities were reported or ended up in a centralized data base, especially those that occurred on state or locally protected lands. Even if we only look at the figures since 1960, as in the chart above, it still shows a steep increase over those 55 years.
It is possible in the last 25 years the reporting of fatalities and the collection of the data has been somewhat more consistent and complete. The chart below covers that period, from 1990 through 2015, and has a slight downward trend, which would be even more obvious if not for the 19-person crew that passed away in 2013 on the Yarnell Hill Fire.
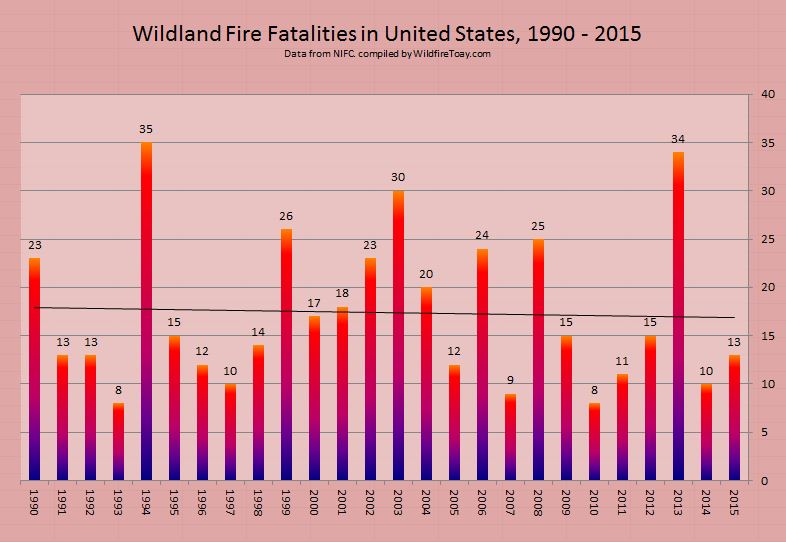
I can’t prove that there was under-reporting of wildland firefighter fatalities during most of the 20th century, but if a firefighter was killed on a vegetation fire in Missouri in 1921, I can see how that statistic may not have made it into the data base that is now maintained at NIFC.
So what does all this mean? Individuals can look at the same batch of statistics and develop vastly different interpretations. However, it would not be prudent to assume that the fatality rate almost tripled from the first part of the 105-year period to the last 25 years. There are several ways to analyze data like this. The least complex is to look at the trend of the raw numbers of fatalities year to year. A more complex and meaningful method would be to determine the fatality RATE. For example, the fatalities per million hours spent traveling to and working on fires. That would be impossible to ferret out during most of the last 105 years. But the firefighting agencies should be able to find a way to begin collecting this information, if they don’t have it already.
If the fatality and serious injury rates were calculated over a multi-year period, it should illustrate the effectiveness of a risk management program. Otherwise, the simple number of deaths each year might be affected to an unknown degree by the number of acres burned. Other factors could also affect the numbers, such as fire intensity influenced by fuel treatment programs, fire history, drought, climate change, or arson.
Should firefighting agencies have specific goals about serious injuries and fatalities? Is there an acceptable number? Is 5 a year too many? Is 15 too many? Is it stupid to have a goal of zero fatalities — or any number?
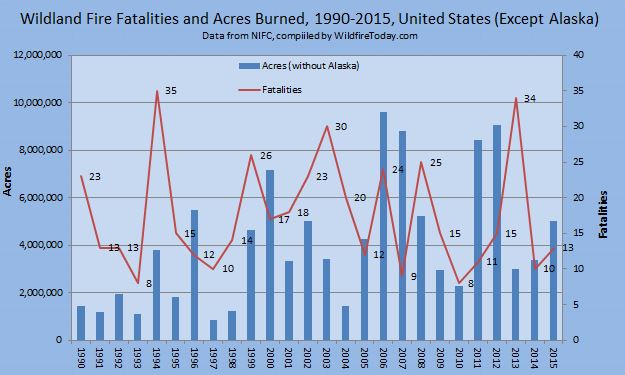
The chart below superimposes the number of fatalities over the acres burned in the United States from 1990 through 2015, but it does not include Alaska since many fires there are not suppressed, or they are only suppressed in areas where they threaten structures or people. In 2015 more acres burned in Alaska than all of the other states combined.
****
UPDATED January 17, 2016
One of our loyal readers, Bean, has been thinking about this issue and figured that since the amount of firefighters’ exposure to risk is necessary in order to calculate trends, perhaps parameters other than acres burned could be correlated with the number of fatalities. Data that is publicly available as far back as 1990 or 1994 includes mobilizations of incident management teams, crews, overhead, helicopters, air tankers, air attack ships, infrared aircraft, MAFFS air tankers, caterers, military firefighters, and shower units. I considered all of those and concluded that the number of crews mobilized would come the closest to serving as a proxy for accurate data of how many hours all firefighters spent traveling to and working on fires.
Data for crew mobilizations is available from 1990 through 2014. I divided the number of crews mobilized by the number of fatalities for each year and called this the Fatality/Crews Mobilized Index.
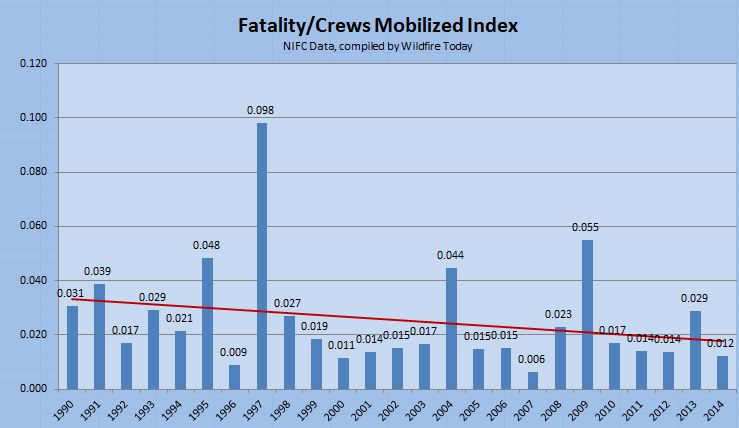
Like the earlier chart comparing fatalities to acres burned, this analysis also shows a decreasing trend in the last 25 years. In a comment posted January 17, Kevin9 said the earlier acres/fatalities analysis is “spiky”. This newer crews mobilized/fatalities data also has spikes (especially in 1997 and 2009) but not quite to the degree the earlier chart had. During the 25-year period, 1997 had the least number of acres burned and crews mobilized, but still had 10 fatalities. The second lowest number of crews mobilized occurred in 2009 and there were 15 fatalities that year.
As an experiment, knowing that there were mass casualty events in 1994 and 2013 (14 and 19 fatalities respectively), just to see what the effects were, I changed the data in those two years to the average for the last 25 years, which is 17, and there was no major change in the trend line, except it was a little lower across the entire range.
It’s been a long time since I took statistics courses, but here’s what I came up with when analyzing the Fatality/Crews Mobilized Index data:

Charles Palmer, an associate professor at the University of Montana who studies performance psychology of wildland firefighters, has called them “tactical athletes”. Mr. Palmer, who spent 20 years as a firefighter and smokejumper, has said:
These aren’t people who ride around in trucks and squirt water on stuff — this is really demanding from a lot of different angles. You travel around, you have to perform, they’re getting very little downtime, they have nutritional challenges … physically you have to perform really well.
A study of wildland firefighters during suppression activities in Spain found that heart rates ranged from 116 to 133 beats per minute depending on the length of the work. Researchers in Australia measured heart rates of firefighters operating hand tools that were 95 percent of their predicted maximal.
When we read an article at the Monday Morning Quarterback about managing the sleep of professional football players, we could’t help but make the comparison between those athletes and the ones who fight wildfires for a living.
According to the piece by Jennie Vrentas, an increasing number of NFL teams are emphasizing an adequate amount of sleep for their players. Below are some excerpts from the article:
A good night’s sleep is directly tied to key factors such as reaction time, mental alertness, muscular recovery and converting what you’ve recently learned into memory. That’s why the science of slumber has become one of the hottest trends in the NFL: Teams are no longer leaving it to chance that their multimillion dollar investments will manage sleep cycles all on their own.
The Dolphins and Patriots have dark rooms at their practice facilities so players can take naps. Eagles players fill out a morning questionnaire on their tablets, self-reporting how long and how well they slept the previous night.
If you run on four hours of sleep a night for a week, it’s the same as drinking a six-pack and then going to work.
“The average athlete probably needs eight to nine hours of sleep, given their physical demands,” [Washington team physician Anthony] Czeisler says, and even more if you can get it. “I wish I could say there’s a shortcut, but if you are going to be a professional athlete, you need to pay careful attention to sleep.”
A single all-nighter, or a week spent getting just four hours of sleep a night, can make one’s reaction time nearly three times slower.
The article refers to studies completed on football and basketball players, but there has also been research on how sleep affects wildland firefighters. In a study of firefighters in Australia during a four-day simulation of an assignment on a wildland fire, it was found that after two nights of being restricted to four hours of sleep their performance on a hand-eye coordination task declined. However their work output remained about the same even after consecutive nights of restricted sleep.
In a related study in Australia, Grace Vincent, a PhD student at Deakin University reported:
The firefighters report [that while working on actual fires they get] only about four to five hours sleep per night. They have trouble sleeping due to other people snoring in locations such as cabins, tents or the floor of school gyms. Some are simply so wired after spending the whole day in emergency-mode, that they can’t switch off.
This is consistent with research in the United states, in Technology and Development Publication, Wildland Firefighter Health and Safety Report, Issue Number 13, Summer 2009:
…Sleeping in fire camp can be a challenge. Noise from generators, vehicles, and other firefighters all contribute to sleeplessness. Because almost all wildland firefighters need to sleep either in fire camps or in spike camps, they sleep in tents, on the ground, and in hot, smoky, and dusty conditions. Shift work interferes with sleep, especially for those on night shift.
Sleep log data were collected on members of five incident management teams at fire camps in California and Montana during 2008. [Note from Bill: this data appears to be from overhead team members in fire camp, not “tactical athletes” out in the field.] Data for 140 team members (36 percent female, 64 percent male) indicated that they averaged 6.1 hours of sleep, ranging from 3.5 to 9.0 hours per night. On average, team members went to bed at 9:30 p.m. They reported being awakened an average of 2.2 times per night, awakening from zero to six times per night. When team members were asked to rate the quality of their sleep, the average was 6.6 on a 10-point scale. Nearly one-fourth (23.8 percent) reported feeling tired when they woke, while 53.6 percent felt somewhat rested, 20.2 percent felt rested, and 2.4 percent felt very rested.
Eight hours of rest between work periods is inadequate because only 50 to 75 percent of the rest period is devoted to sleep. Thus it is advisable to have longer rest periods (10 to 14 hours) so workers have time for adequate sleep.
Total sleep deprivation for 1 week has led to cognitive impairment when work requires multitasking. In driving, accidents increase as sleep duration is decreased. In tasks requiring judgment, risky behaviors emerge when sleep is limited to 5 hours per night.
Behavioral alertness and a range of cognitive functions, including sustained attention, and working memory deteriorate when nightly sleep is limited to between 4 and 7 hours. Decisionmaking skills, such as the ability to assess risk, assimilate changing information, and revise strategies to solve problems based on new information are likely to suffer.
Eight hours of rest between work periods is inadequate because only 50 to 75 percent of the rest period is devoted to sleep. Thus it is advisable to have longer rest periods (10 to 14 hours) so workers have time for adequate sleep.
What about naps?
The same publication recommended naps when possible, but the length is important:
Naps restore alertness, enhance performance, and reduce the risk of mistakes. To avoid waking up groggy and exhausted, workers should nap for 20 to 30 minutes OR for longer than 90 minutes. A one-hour nap places you in the middle of deep sleep, making it difficult to wake up. You will be disoriented and clumsy, might make poor decisions, and could be at risk of an injury. A 20-minute nap ends before you descend into deep sleep; a 90-minute nap catches you rising out of deep sleep.
 The Centers for Disease Control and Prevention has published the results of a study that collected information about aviation-related fatalities of wildland firefighters between 2000 and 2013. You can see the entire paper HERE (see page 793), but most of it is below.
****
Aviation-Related Wildland Firefighter Fatalities — United States, 2000–2013
Weekly
July 31, 2015 / 64(29);793-796
Corey R. Butler, MS1, Mary B. O’Connor, MS2, Jennifer M. Lincoln, PhD2 (Author affiliations at end of text)
Airplanes and helicopters are integral to the management and suppression of wildfires, often operating in high-risk, low-altitude environments. To update data on aviation-related wildland firefighting fatalities, identify risk factors, and make recommendations for improved safety, CDC’s National Institute for Occupational Safety and Health (NIOSH) analyzed reports from multiple data sources for the period 2000–2013. Among 298 wildland firefighter fatalities identified during 2000–2013, 78 (26.2%) were aviation-related occupational fatalities that occurred during 41 separate events involving 42 aircraft. Aircraft crashes accounted for 38 events. Pilots, copilots, and flight engineers represented 53 (68%) of the aviation-related fatalities. The leading causes of fatal aircraft crashes were engine, structure, or component failure (24%); pilot loss of control (24%); failure to maintain clearance from terrain, water, or objects (20%); and hazardous weather (15%). To reduce fatalities from aviation-related wildland firefighting activities, stringent safety guidelines need to be followed during all phases of firefighting, including training exercises. Crew resource management techniques, which use all available resources, information, equipment, and personnel to achieve safe and efficient flight operations, can be applied to firefighting operations.
Airplanes and helicopters play a major role in the control of wildland (forest, brush, and grass) fires. These aircraft are used to deliver equipment and supplies, deploy and transport firefighters, conduct reconnaissance, scout and direct operations, and deliver fire retardant or water. During the past decade, the United States has experienced an increase in the size, frequency, and severity of wildfires, likely attributable to buildup of flammable vegetation, decline in snowpack, and human development in the wildland urban interface (1,2). If these conditions continue, more fire response workers will be needed, and the demand on aviation to support these efforts will increase.
To identify risk factors for aviation-related wildland firefighter activities, NIOSH reviewed and extracted case reports from the Fire Administration Firefighter Fatality surveillance system, the National Fire Protection Association Fire Incident Data Organization database, the National Wildland Coordinating Group’s Safety Gram, and the National Transportation Safety Board aviation database. A wildland firefighter fatality was defined as any death that occurred in a paid or unpaid wildland firefighter, contractor, aviation crew member or support staff, inmate, or member of the military while performing official wildland fire duties, including operations (fire or nonfire incident), responding to or returning from a wildland fire incident, or other officially assigned duties.* Other emergency response workers who were fatally injured at wildfires were excluded from this analysis. The number of flight hours for the U.S. Forest Service was used as a denominator to indicate the use of aviation resources because flight hours from other agencies or workforce numbers were not available.
During 2000–2013, a total of 298 wildland firefighter fatalities were identified, averaging 21 fatalities per year. Among these, 78 (26.2%) were caused by activities associated with aviation. The number of aviation- related fatalities decreased during 2007–2013, compared with 2000–2006 (Table 1). Of the persons who died in aviation-related activities, 76 (97%) were male, and 53 (68%) were flight crew members (e.g., pilots, copilots, and flight engineers). The average age of flight crew victims was 49 years (range = 20–66 years) and of nonflight crew victims was 33 years (range = 19–54 years). The most common occupation of nonflight crew members was firefighter. Most victims were employed by aerial contractors (42), followed by the federal government (15), state government agencies (10), ground contractors (seven), and the military (four). Twenty-five (32%) of the aviation-related fatalities occurred in California, eight occurred in Nevada, and seven in Idaho (Figure).
