The National Association of Forest Service Retirees (NAFSR) conducted an analysis of the capacity of the Forest Service’s workforce. They looked at the existing characteristics of the agency and conducted lengthy interviews with 33 employees in all nine regions.
Topics covered in the interviews:
Leadership, culture, and direction,
Workforce capacity,
Consolidation and zoning,
On the ground management, and,
Partnerships.
The recommendations of the NAFSR:
Hire employees with skill sets necessary to increase the pace and scale of forest restoration.
Totally revamp the hiring process, streamlining procedures, removing all roadblocks and restoring connections with field units.
Eliminate unnecessary administrative burdens.
Increase funding to hire new employees, contract work and enter into partnerships.
Delegate authority to field units.
Implement all actions previously suggested by NAFSR, including administrative reforms and the 2021 budget initiative.
You can download the cover letter(.docx file) the group sent to Secretary of Agriculture Sonny Perdue, as well as the 11-page report(.pdf file). The documents are intended to be shared with anyone who has an interest.
Thanks and a tip of the hat go out to Dick. Typos or errors, report them HERE.
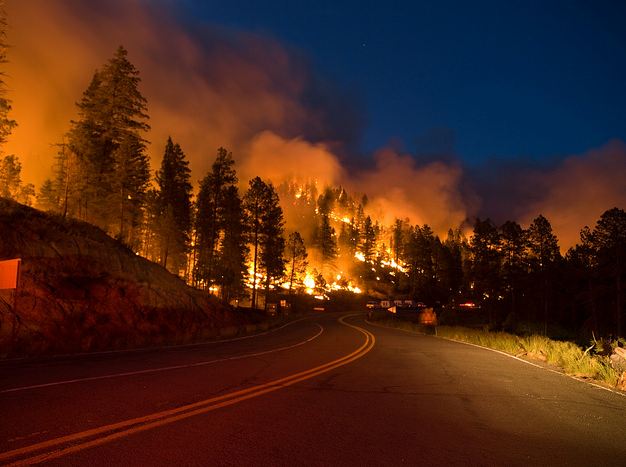
Road 532 on the Little Bear Fire in New Mexico, June 13, 2012. Photo by Kari Greer.
A study conducted at the Yale School of Forestry & Environmental Studies looked at the increasing effects that wildfires are having on water supplies. It is titled, How Wildfires Are Polluting Rivers and Threatening Water Supplies. Below is an excerpt.
As hotter and dryer conditions spawn an increasing number of wildfires in North America and around the world, one of the overlooked impacts of these worsening conflagrations is on aquatic environments and drinking water supplies. Just as wildfires can have a regenerative effect on woodlands, so, too, can fires provide some benefits to streams and rivers in burned areas. But scientists are warning that intense and repeated fires can damage the ecology of waterways by exposing them to the sun’s heat, exacerbating flooding and erosion along denuded hillsides, and releasing toxins such as mercury that are often liberated from soil and tree trunks.
The effect of major wildfires on drinking water supplies can also be severe, as evidenced by fires that burned upstream of places such as Fort McMurray in Canada in 2016; Denver and Fort Collins, Colorado in 2002 and 2012; and Canberra, Australia in 2003. Water treatment plants in those places were overwhelmed by sedimentation, dissolved organic carbon, and chemicals that were released by fire.
With fires burning bigger, hotter, and more frequently, the threats to water supplies and aquatic systems are bound to escalate, according to Deborah Martin, a Colorado-based U.S. Geological Survey (USGS) scientist. She points out that an increasing number of regional, national, and global water assessments are now including wildfire in evaluating the risks to drinking water.
Tanker 45, a P2V, on the Whoopup Fire near Newcastle, Wyoming, July 18, 2011. Photo by Bill Gabbert.
We just became aware of another air tanker study that the U.S. Forest Service commissioned. By our count this is the 13th federal study on the use of air tankers since 1995, and was one of three completed in 2013. (A list of the studies is at Wildfire Today.)
The study attempts to determine how effective large air tankers (LAT) have been at preventing fires from escaping initial attack (IA). The authors begin by describing the poor data that they used to develop their conclusions. For example, the sparse data made it very difficult “to track drop location and time, to associate drops to specific fire events, to gather information on the fire environment (fuels, weather, terrain, etc.) at the time of the drop and, critically, to clearly identify mission objectives for each drop.”
The authors used some convoluted methods to make guesses about which retardant drops were on IA fires and which ones were not. And, “due to data availability issues” they only considered stats from two years, 2010 and 2011. In 2010 there were 19 LATs in the fleet at the beginning of the year and 14 in 2011, but by the end of 2011 the study reports there were only 10 available.
Since the air tanker fleet has atrophied from 44 in 2002 to as low as 9 in 2013, it has been impossible to always produce a LAT every time one is needed on IA. And if it does show up, the chances of it arriving while there is still a chance to slow the spread, enabling ground based firefighters to contain the fire, are not as great as they were in 2002 when there were almost five times as many air tankers.
The authors addressed the timing of air tanker drops:
Therefore, the determination of whether or not a fire will benefit from LAT drops in IA will be directly related to the delay from ignition to drop occurrence. This delay allows a fire to grow and cross a critical threshold where fireline production of IA resources cannot catch the growing fire perimeter. When evaluated in this light, the demonstrated low success rate for IA containment could be addressed by reducing the time between ignition and LAT arrival on these fires with a high potential to escape. This would require an improved ability to rapidly recognize an individual fire’s escape potential so that LATs are ordered very early in the event. Further, this suggests that if we can improve our ability to identify when and where these types of ignitions are likely to occur we should be able to effectively pre-position LATs before an outbreak of fires. If the IA success rate could be improved through such a system, overall LAT demand may be reduced because many of the evaluated drops were associated with IA fires that ultimately escaped.
And they wrote about the resistance to control of fires that receive retardant drops on IA:
That the rate of escape associated with fires that receive drops during IA is so high – far higher than the general escape rate of approximately 2 to 5% – is strongly suggestive that LAT use, when it does occur in IA situations, occurs on the more difficult fires (i.e. Category C fires as defined by Keating et al. 2012)
The “Keating et al 2012” report is more commonly known as the Rand Report.
They also make the point that although the USFS’ policy is to prioritize LAT use on IA rather than Extended Attack (EA) fires, a high proportion of LAT drops occur on EA fires.
In spite of these conditions, the authors apparently felt comfortable making the following statement in the paper’s introduction:
Results suggest that containment rates for fires receiving large airtanker use during initial attack are quite low.
A statement like that when taken out of context, or without understanding the limitations of the report’s data, can be very misleading.
If air tankers are going to be effective in IA, first they have to be near enough to the fire to arrive, preferably, within 15 to 30 minutes after being dispatched. And, they must be dispatched if not at the first report of smoke, at the first confirmation that there is a wildfire. If there is a delay until a fire officer arrives at the scene to make the decision to order aircraft, that could be the difference in effective or ineffective air tanker use.
Rapid initial attack with overwhelming force using both ground and air resources, arriving within the first 10 to 30 minutes when possible.
Below is a graphic that we put together showing the Unable to Fill rates for LAT requests, the number of LAT requests, and the size of the air tanker fleet since 2002.
(The chart above was revised February 3, 2015 to include data from 2014.)
An 18-month study by three universities concluded that if Utah took over most of the federal lands in the state they could anticipate revenues of $331.7 million annually while incurring costs of $280 million. Most of the income would be generated by the sale of oil, gas, and coal, while the cost of managing wildfire is estimated at $86.6 million.
The study was undertaken because Utah H.B. 148 seeks the transfer of title to 31.2 million acres of land currently managed by the federal government to the state of Utah. This accounts for more than 60 percent of the state’s land area, or five times the amount of land the state currently owns and manages. Most of the federal land in the state would be transferred under the proposal, except for national parks and designated wilderness areas. The graphic below shows the extent of the lands to be transferred.
Below is an excerpt from the portion of the 784-page study that covered wildfire management:
****
“Wildfire management (WFM) is a significant cost of land management in Utah. The three agencies with primary responsibility in managing WFM in Utah are the BLM, Forest Service and FFSL. From 2003 to 2012, the combined spending by these agencies for WFM averaged $85.6 million annually (adjusted to 2013 dollars). Of this total, suppression costs averaged $30.5 million and non-suppression costs averaged $50.2 million. Table 3.26 shows the average 10-year costs for each agency.
The variability in WFM costs by agency shown in Table 3.26 is more a reflection of aviation capability than it is of efficiency. FFSL has no aviation capability and relies on federal land managers for aviation support essential to its fire suppression efforts. In general, the BLM provides small engine aviation capability while the Forest Service bears the cost for large tanker capabili-ties. These costs are not insignificant, which explains the high suppression costs reported for the Forest Service.
Suppression is not the largest component of WFM, but it is the most volatile and most difficult to anticipate. The majority of wildfires in Utah are ignited from natural causes. Drought conditions, combined with insect infestations and climate change contribute to not just fire ignition, but fire spread, severity, duration, and ultimately cost. Most of these conditions are outside the control of human intervention.
Although WFM costs in other states are not readily available, wildfire trends for the western states show that the wildfire situation in Utah is comparatively mild. From 2003 to 2012, Utah ranked seventh of 11 western states in number of wildfires and eighth in terms of acres burned.
We expect the 10-year average cost of $86.6 million to manage wildfire in Utah is representative of the costs going forward. Over time, this amount could decrease if the state took a less aggressive approach to suppression and increased investments in fire preparedness and mitigation (reducing hazardous fuels). However, growing fire risks from the bark beetle epidemic, trends towards a drier climate, and development in the wildland-urban interface may increase the costs of fire suppression in excess of current levels.”