Extreme wildfires may increase 14 percent by 2030, United Nations warns

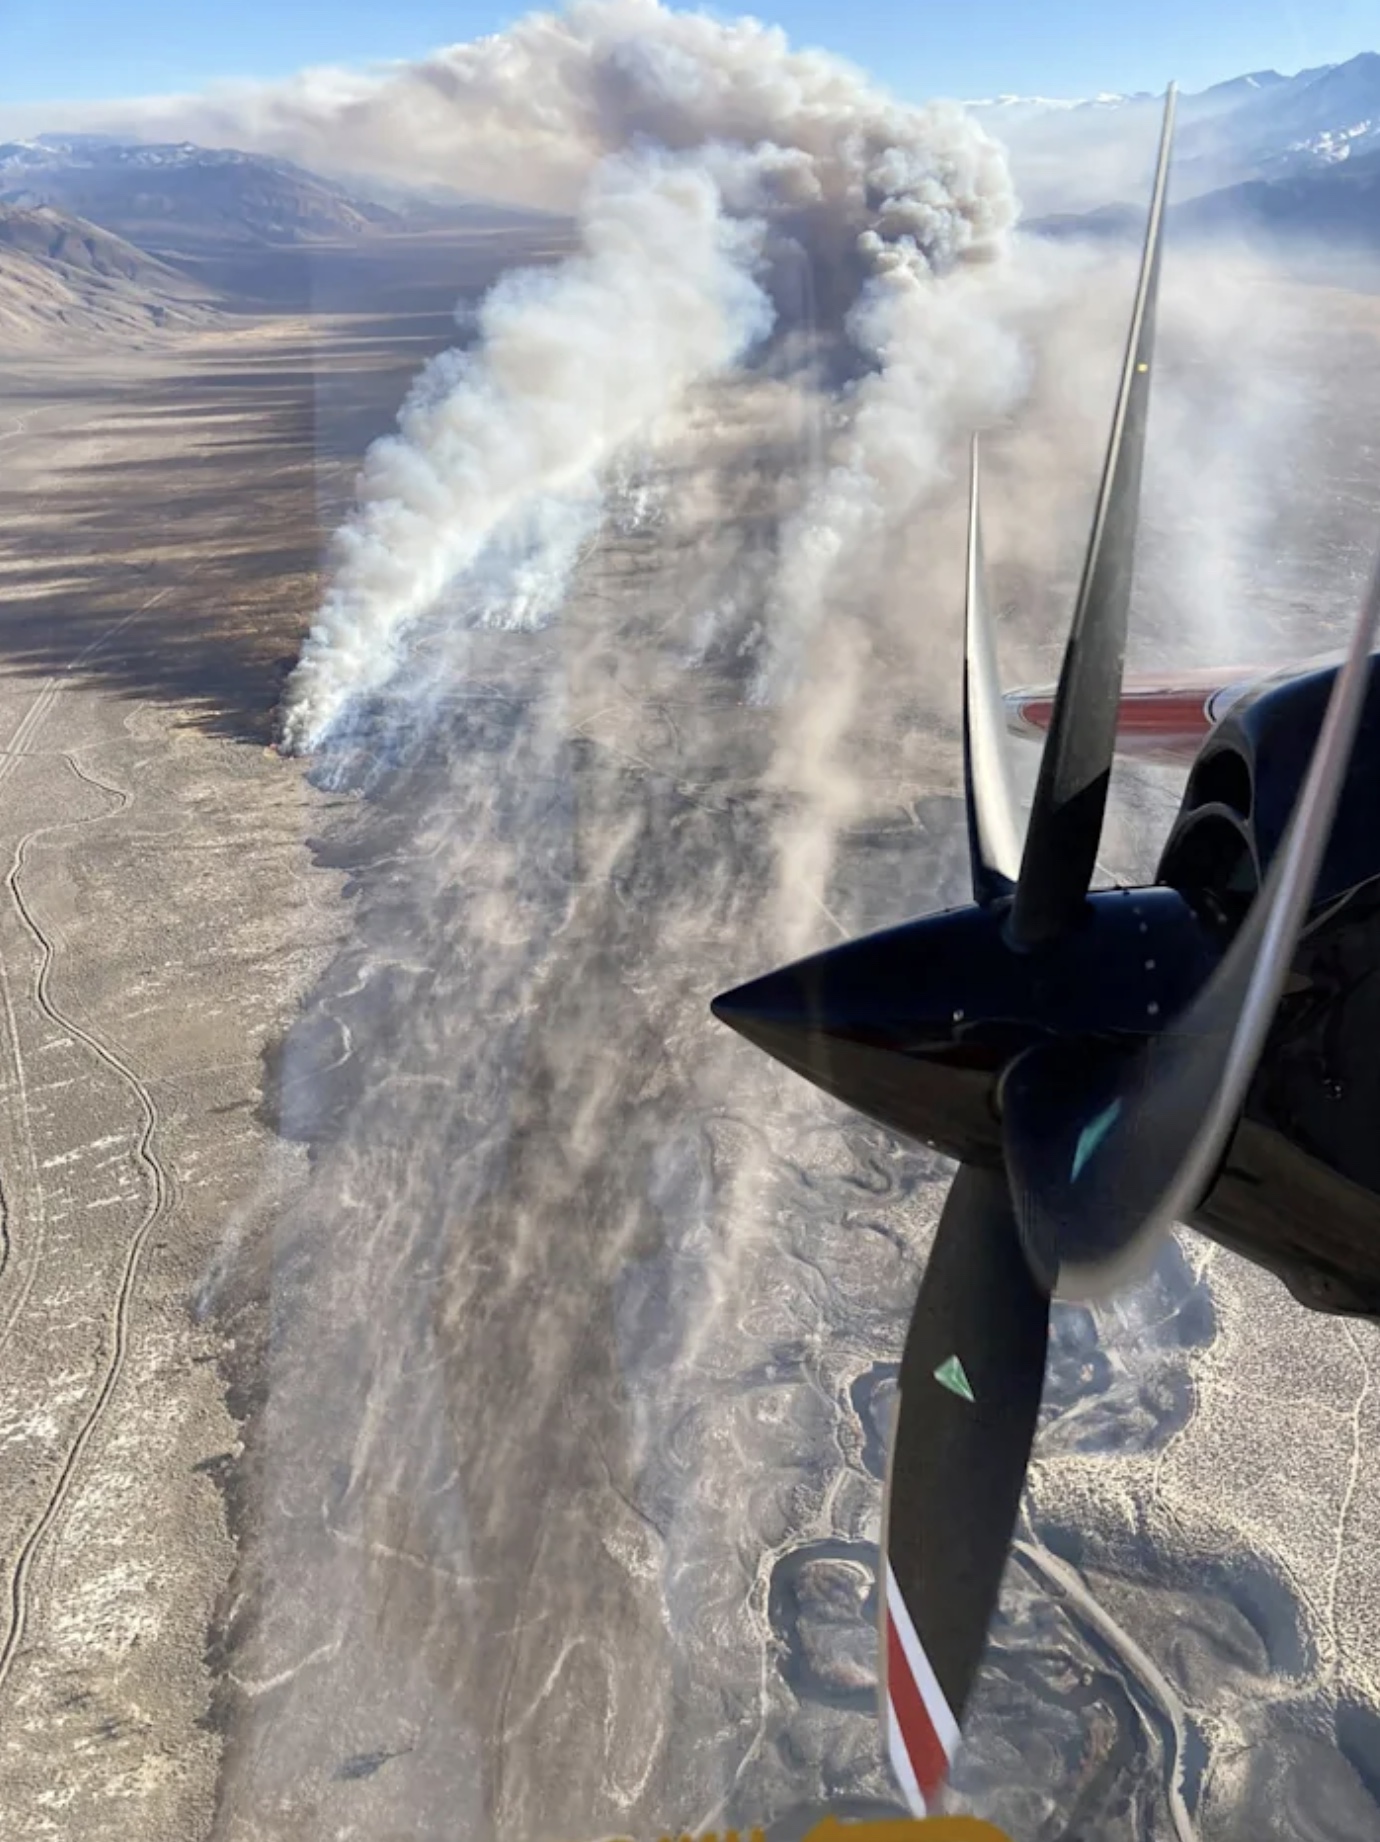
Airport Fire near Bishop, Calif.
Airport Fire near Bishop, California Feb. 16, 2022. CAL FIRE photo.

Climate change and land-use change are projected to make wildfires more frequent and intense, with a global increase of extreme fires of up to 14 percent by 2030, 30 percent by the end of 2050, and 50 percent by the end of the century, according to a new report by the United Nations Environment Program (UNEP) and GRID-Arendal.

The study calls for a radical change in government spending on wildfires, shifting their investments from reaction and response to prevention and preparedness.

In the report, wildfire is defined as “an unusual or extraordinary free-burning vegetation fire which may be started maliciously, accidently, or through natural means, that negatively influences social, economic, or environmental values”.

The study, Spreading like Wildfire: The Rising Threat of Extraordinary Landscape Fires (117 MB), finds an elevated risk even for the Arctic and other regions previously unaffected by wildfires in recent centuries. The publication calls on governments to adopt a new “Fire Ready Formula”, with two-thirds of spending devoted to planning, prevention, preparedness, and recovery, with one third left for response. Currently, direct responses to wildfires typically receive over half of related expenditures, while planning receives less than one per cent.

To prevent fires, the authors call for a combination of data and science-based monitoring systems with indigenous knowledge and for a stronger regional and international cooperation.

“Current government responses to wildfires are often putting money in the wrong place. Those emergency service workers and firefighters on the frontlines who are risking their lives to fight forest wildfires need to be supported”, said Inger Andersen, UNEP Executive Director. “We have to minimize the risk of extreme wildfires by being better prepared: invest more in fire risk reduction, work with local communities, and strengthen global commitment to fight climate change”.

Wildfires disproportionately affect the world’s poorest nations. With an impact that extends for days, weeks and even years after the flames subside:

· People’s health is directly affected by inhaling wildfire smoke, causing respiratory and cardiovascular impacts and increased health effects for the most vulnerable;

· The economic costs of rebuilding after areas are struck by wildfires can be beyond the means of low-income countries;

· Watersheds are degraded by wildfires’ pollutants; they also can lead to soil erosion causing more problems for waterways;

· Wastes left behind are often highly contaminated and require appropriate disposal.

Wildfires and climate change are mutually exacerbating. Wildfires are made worse by climate change through increased drought, high air temperatures, low relative humidity, lightning, and strong winds, which causes hotter, drier, and longer fire seasons. At the same time, climate change is made worse by wildfires, mostly by ravaging sensitive and carbon-rich ecosystems like peatlands and rainforests. This turns landscapes into tinderboxes, making it harder to halt rising temperatures.

Wildlife and its natural habitats are rarely spared from wildfires, pushing some animal and plant species closer to extinction. A recent example is the Australian 2020 bushfires, which are estimated to have wiped out billions of domesticated and wild animals.

The report said the restoration of ecosystems is an important avenue to mitigate the risk of wildfires before they occur and to build back better in their aftermath. Wetlands restoration and the reintroduction of species such as beavers, peatlands restoration, building at a distance from vegetation, and preserving open space buffers are some examples of the essential investments into prevention, preparedness and recovery.

Wildfire factors influencing health
Wildfire smoke contains fine particulate matter and potentially toxic combustion products (the latter can be particularly harmful at the wildlandurban interface where waste and rubbish, materials used in buildings and vehicles are often burnt; Hallema et al. 2019). From the report.

The report concludes with a call for stronger international standards for the safety and health of firefighters and for minimizing the risks that they face before, during and after operations. This includes raising awareness of the risks of smoke inhalation, minimising the potential for life-threatening entrapments, and providing firefighters with access to adequate hydration, nutrition, rest, and recovery between shifts. Women firefighters face various challenges ranging from gender discrimination and sexual harassment to ill-designed equipment and protective clothing that puts them at greater risk of injury.
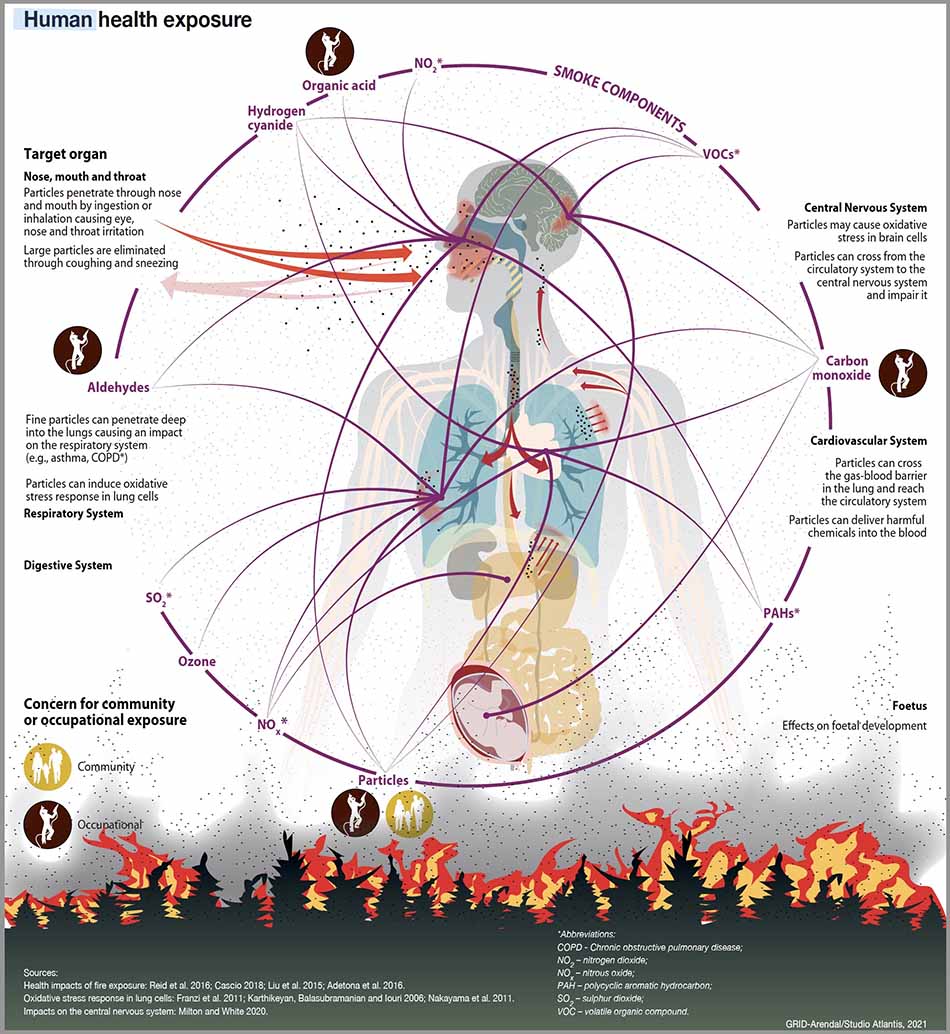
Human Health Exposure wildfire smoke health effects
Smoke particulate exposure pathways and impacts. Smoke exposure is most commonly measured from land-based air pollutant monitors, followed by satellite-based imagery models, with fewer studies measuring personal exposure to smoke (Liu et al. 2015). From the report.

Smoke associated with deforestation fires in the Brazilian Amazon has been found to be responsible for the premature death of almost 3,000 people annually (95 percent percentile confidence interval: 1,065–4,714), demonstrating the regional scale of fire impacts (Reddington et al. 2015).

Our take

The report predicts a global increase of extreme fires of up to 14 percent by 2030 and 30 percent by the end of 2050. The statistics for the United States from the National Interagency Fire Center since the 1980s indicates that the total acres burned and the average size of wildfires has been far exceeding those rates of increase. The data, which does not include Alaska since those fires are managed far differently from the rest of the US, shows during the forty-year period approximately a 400 percent increase in the average size by decade, and more than a 300 percent growth in the total acres burned each year. The statistics for the US are for all fires, not just those that “negatively influence social, economic, or environmental values.”

Average size of US wildfires by decade

Another factor that may influence the size of fires in the US is that some wildfires are not totally suppressed and can be herded around to attempt to protect private land, structures, and certain resources. They may burn for months, and occasionally grow far beyond what was expected. The use of a limited suppression strategy can be to allow fire to be reintroduced to replicate natural conditions and reduce fuels. Or in recent years it could be due to extreme fire activity in the Western US and a shortage of firefighting resources as a result of difficulties in hiring, retention and recruitment.

Total wildfire acres

Thanks and a tip of the hat go out to Rick and Tom.

A study evaluated the cultural safety of indigenous wildland firefighters in Canada

From a recently completed study in Canada:


Funded by Natural Resources Canada, a project provided preliminary data on cultural safety and occupational health and safety that is necessary to improve the understanding of Indigenous perspectives on wildland firefighting and wildland fire operations across what is now called Canada.

Wildland firefighting is a unique occupation. For decades, Indigenous (First Nations, Métis, and Inuit) firefighters and fire operations staff have been engaged in wildland fire suppression activities, formally and informally. They are increasingly being called upon by their communities and the broader wildfire management agency community in Canada to engage and deploy in various wildfire suppression and related duties. In the past decade, we have seen an increase in wildfire activity and the number of communities put at risk or impacted by high-intensity wildfire events. Due to the nature of this work, Indigenous Peoples engaged in wildland fire suppression activities routinely work in hazardous situations and stressful environments – impacting their physical, mental, and spiritual/cultural well-being.

Giving Voice to Cultural Safety of Indigenous Wildland Firefighters in Canada was a multidisciplinary, collaborative team-based project.

From January – July 2021, the Turtle Island Consulting Services Inc. (TICS Inc.) Project Team explored the following set of questions:

  • What are Indigenous wildland firefighters’ and wildland fire operations staff’s experiences regarding accident/injury rates, sickness presenteeism/absenteeism, chronic illness, close calls, racism/ discrimination/harassment?
  • What is currently working on the fireline and fire operation centres to promote cultural safety of Indigenous wildland firefighting personnel?
  • What are the priority needs/issues and recommendations for enhancing cultural safety for Indigenous wildland firefighting personnel?

The TICS Inc. Project Team developed an online survey and virtual circles were conducted specifically for individuals who self-identified as Indigenous and worked in wildland firefighting and/or fire operations for at least one fire season in Canada. These participant selection criteria supported the sharing of Indigenous Peoples’ voices in culturally safe spaces to help (i) increase the understanding of their jobs, (ii) enhance overall satisfaction from a cross-cultural perspective during this important work, and (iii) aid in making the future of wildland firefighting more enjoyable, safer, and culturally inviting.

For more information about Project findings, please view the following reports.


The Executive Summary is immediately below. Farther down you can click to download it or view it online .

[pdf-embedder url=”https://wildfiretoday.com/wp-content/uploads/2021/10/Summary-Giving-Voice-to-Cultural-Safety-of-Indigenous-Wildland-updated-Oct-2021.pdf” title=”Giving Voice to Cultural Safety of Indigenous Wildland Firefighters in Canada”]

Thanks and a tip of the hat go out to Marty.

Former Navy tactical jet pilot analyzes the Aerial Use and Effectiveness study

Calwood Fire, Oct. 17, 2020
Calwood Fire northwest of Boulder, Colorado, Oct. 17, 2020. Photo by Ben Nelson, Envision Studio, Boulder, Colorado.

(Note from Bill: I asked Bean Barrett, a former Naval Aviator and frequent contributing writer on Fire Aviation, for his thoughts about the Aerial Firefighting Use and Effectiveness study that was conducted by the U.S. Forest Service during a nine-year period at an annual cost of $1.3 million. The AFUE had very ambitious goals initially when Tom Harbour was the Director of Fire and Aviation for the U.S. Forest Service. “AFUE was initially intended to eventually help answer questions about the size and composition of aviation assets needed by the USFS,” Mr. Harbour told Fire Aviation recently. Bean’s comments are below. It begins with the Government Accountability Office’s request to the USFS to justify spending about half a billion dollars a year for aerial firefighting programs. That was one of the reasons for conducting the study.)


What the Government Accountability Office recommended :

  1. Expand efforts to collect information on aircraft performance and effectiveness to include all types of firefighting aircraft in the federal fleet.
  2. Enhance collaboration between the agencies and with stakeholders in the fire aviation community to help ensure that Agency efforts to identify the number and type of firefighting aircraft they need reflect the input of all stakeholders in the fire aviation community.
  3. Subsequent to the completion of the first two recommendations, update the agency’s strategy documents for providing a national firefighting aircraft fleet to include analysis based on information on aircraft performance and effectiveness and to reflect input from stakeholders throughout the fire aviation community.

The AFUE study says it provide “…empirical information addressing the three GAO recommendations…”

From a program management perspective, enough information is required to inform decisions on inventory objectives, inventory types, and to allow costing out various aircraft and contract options.

At a higher level, when dealing at the programmatic and budget levels, it is necessary to first clearly demonstrate the value of aircraft vs ground crews and equipment or the appropriate mix of aircraft, ground crews, and equipment. One departmental budget buys all. When the value of aircraft can be demonstrated empirically, the desired mix of air and ground capability can be decided. Then, aircraft inventory objectives by type can be determined. AFUE picks up at this point and I’m not sure the larger case for air has been made. We cannot answer the question … In general, how much more efficient are our firefighting efforts when ground crews are augmented with air tanker support?

With respect to GAQ tasking, AFUE has only taken a partial first step in addressing and providing the necessary information for GAO recommendation #1. There is not enough information to determine desired inventory objective, type and mix of types, and cost. I’m not sure it is presented in a form to allow conclusions to be made. As the information was collected across the various LMA’s it does comply with #2. Without fully accomplishing task #1, updating strategy documents is not possible #3.

The Performance definition utilizes two metrics. Interaction percentage [IP] and probability of success [POS]. The definition of those two performance measurements and how they relate to GAO’s recommendation to collect information on “Performance” and Effectiveness” is not clear. I’m not sure Performance and Effectiveness by type aircraft can be adequately determined.

This study is perhaps being too clever by half when it introduces new terms to analyze.

What constitutes satisfactory interaction in Interaction Percentage [IP]? Probability of Success [POS] seems to be conflated with “effectiveness”. What constitutes success? What constitutes “effective”?

Some questions:

If “Each drop was analyzed on the basis of objective and outcome” with respect to use statistics, was the air asset chosen by the IMT or was it used because it was all that was available? If it was a beggars can’t be choosers tasking situation, some of the aircraft-mission paring data might be questioned.

We may have a better idea of what groups of aircraft are tasked for which missions but not why a particular group is being chosen/used. The statistics clearly show helos flying over 80% of the missions. Is that a reflection of IMT choice, the practicality of using what was available, the preponderance of water as a payload, or perhaps it is related to the ratio of small fires to large fires? There is insufficient information to determine why helos flew over 80% of the sorties.

How much of IP and POS was a function of drop accuracy? Which aircraft were the most accurate? What missions are more accuracy dependent?

How much of the IP and POS statistics are more dependent on payload than aircraft type?

Fire is the target. It is why aircraft are flying. Is classification of fire into IA, EA, and Large as defined in the study sufficient to sort aircraft assignment and results by type? EA appears to be a small gap filler between IA and Large Fire.

Why are there no time dependent metrics? From a program analysis perspective, many aircraft distinguishing characteristics are time related. Speed, range, endurance, reload-return, and IA response come to mind.

If this were a commercial airline study, I would expect to see some “bottom line” characteristic similar to Revenue/Seat-Mile. Why isn’t there something like cost/payload gallon-mile/hr for air tankers?

From a commercial and military perspective, it is more about payload delivered and what it takes to get it there. Aircraft are mission dependent variables. Why wasn’t the AFUE study based on mission requirements? What payload needed to be delivered, what quantity, what coverage level, how fast, how accurately, and for how long? Given something like these parameters, the number and type of aircraft can be determined.

A problem?

Figure 10. With LAT’s approximately 45% of drops have a positive outcome. For VLAT’s 50%.

Drop Outcomes, AFUE
Figure 10, Drop Outcomes, AFUE.

Figure 13. LATs have a 67-68% Probability of Success. VLATs have a 70% Probability of Success.

Figure 13, Probability of Success, AFUE

Someone smarter than me needs to explain this discrepancy. Evidently a positive outcome is not necessary to qualify as a success.

Conclusion:

The original GAO requirement was for information on “performance” and “effectiveness” to support determination of what constituted an adequate aircraft firefighting fleet. From a program manager’s standpoint, this study does not provide the necessary information to determine aircraft inventory objectives or mix of types.

AFUE made an assumption — they assumed that what we are doing today with aircraft is mostly correct. This going-in assumption resulted in missing an examination of “Are we doing it the right way? Are we using the right assets? Or, are we just doing the best we can and getting by with what we have?” The answers to these questions are necessary to inform the data collection process and objectives. It is highly likely that the AFUE data more closely reflects firefighting that is making do with what it has, as opposed to selecting the best aircraft for the job.

Australia has done a far better job at justifying use of firefighting aircraft and examining aircraft effectiveness and performance.

Going to your e-mail questions.

  • Is it useful? Aircraft types are grouped so nothing can be determined about specific aircraft except in a most general nature based on Tanker Type Categories.
  • Adequate comparison? Data is insufficient or entirely missing.
  • Future program decision support? Not useful in determining aircraft inventory and types for a national air firefighting fleet. Also not adequate to support program decisions because it never answered the “why” various types were chosen for various missions.
  • Cost metric. As mentioned in my missive, it’s about payloads required/delivered. That is a better sorting function than Tanker Type. Aircraft Type and #’s are dependent variables of payload and payload related requirements.
  • Aircraft Mix going forward…

My familiarity is somewhat limited. I would like to think I understand some of aviation based on my 31 years of military and some commercial experience but since I’m on the board of directors of a 98 square mile fire protection district in Colorado (the district with the community at highest assessed risk of loss to wildfire in the whole state of Colorado) my immediate day-to-day scope is much more focused on things like IA, what it takes for our department to keep small fires small, and our citizens safe.

In Colorado it is the small fire protection districts that are primarily responsible for IA.

If something like 95-96% of our wildfires fires are contained then the approximately 95-96 % containment was probably due to effective IA. Taking a couple more percent off of the escaped fire percentage is far cheaper than fighting a large fire.

Maybe more unique to Colorado, but almost every district could use more staff for IA (primarily volunteer departments) and larger budgets for equipment. Neither one is in the cards. We need close air support to overcome the obstacles of marginally accessible terrain and shortage of staff. Small, accurate, and timely air support comes to mind.

Like a Marine gunny I knew once observed — when I need close air support I don’t want a B-52, I usually want something like an A-10 with a gun.

We are short of big lakes around here so scoopers are out. Dipping/snorkeling helos come to mind to directly support the small crews that are responsible for getting the initial attack going. SEAT’s reload-return times are too long.

Somewhere in the bean counting world there is a very good reason a LAT or VLAT cannot be made available for every 12-20 man module/ crew working an IA. Locally, we need more helos. Who owns the helos isn’t important. It is the response time and cycle time that counts.

We need the bigger tankers for the 4 or 5% of the fires that do escape.

If I had to do a rough guess on the aviation mix, I’d start on the ground floor with what might be considered “first principles” and look at the targets list… (how many fires, how big, where, how often), then figure out what needs to be dropped on the various targets and generally, where the targets are and if the missions are direct support or indirect support. Determine payload type, quantity, and necessary accuracy. Then, look at the best aviation mix to deliver the required payloads.


Bean Barrett

  • 31 years as a Naval Aviator flying tactical jets, some heavy time, and a little prop time.
  • Flew for Continental Airlines for two years.
  • Aviation Safety Officer and mishap investigator.
  • Staff time at the Navy Strike Warfare Center/ included work on close air support training.
  • Navy sponsor on Navy Staff for some air and space programs. Total annual obligation authority $1B.
  • Presently on our local Colorado fire protection district board of directors. Have worked with our fire department for over 10 years.
  • Lived in Colorado’s front range tinderbox since 1979. Have seen several of our front range big fires up close and personal. Evacuated for one.