The drought is expected to continue in the brown areas. (NOAA. Updated March 17, 2022)
In an analysis updated March 17 by NOAA, the drought in the western half of the United States is expected continue at least through June 30, 2022, affecting parts of 23 states.
And in most of those areas the temperatures will be higher than average and there will be less than average precipitation.
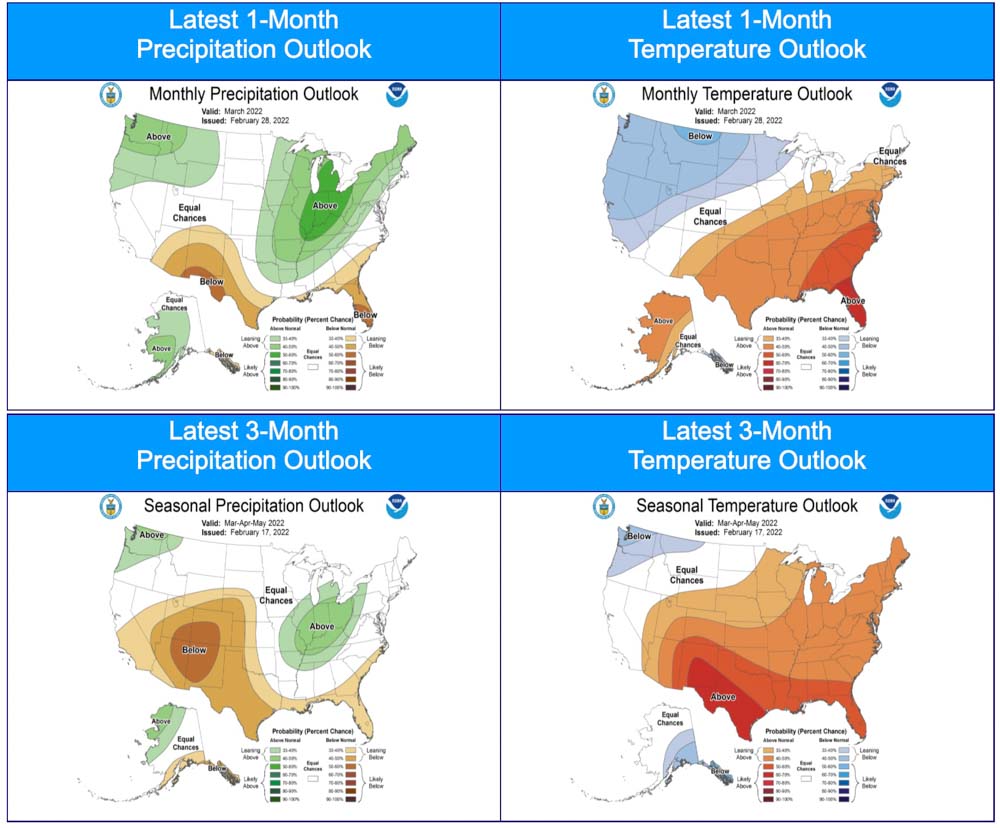
Three-month precipitation and temperature outlook, updated March 17, 2022. NOAA.
All but one member of the Granite Mountain Hotshots were killed on the Yarnell Hill Fire in 2013
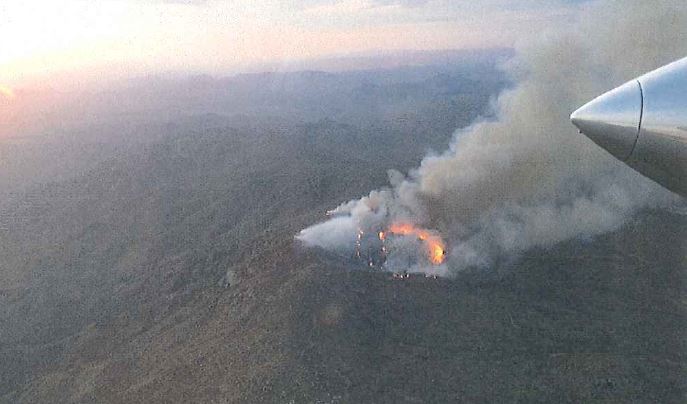
Yarnell Hill fire at 7:30 p.m. MST, June 29, 2013, approximately 21 hours before the 19 fatalities. Photo by ATGS Rory Collins.
Researchers at Embry-Riddle Aeronautical University have published the results of their work which show that winds out of a thunderstorm affected the Yarnell Hill Fire. On June 30, 2013 at about 4:45 p.m. local time 19 members of the Granite Mountain Hotshots were killed as the fire changed direction and overran their position.
The weather that led to the fatalities has been clear since we covered it on Wildfire Today about three hours after the burnover before the entrapment was officially confirmed:
…This was apparently caused by a 180-degree shift in the direction of the wind. From 10 a.m. until 4 p.m. local time at the Stanton RAWS weather station four miles south of the fire, the wind was from the south-southwest or southwest, but at 5 p.m. it began blowing from the north-northeast at 22 to 26 mph gusting up to 43 mph. This may have pushed the fire into the town.
If there were any firefighters on the south or southwest side of the fire between 4 and 5 p.m., who previously had the wind at their backs for seven hours with the fire moving away from them, they may have suddenly and unexpectedly found the fire heading toward them at a rapid rate. Wind direction changes like this are sometimes caused by a passing thunderstorm with strong outflowing downdrafts.
And a few minutes later:
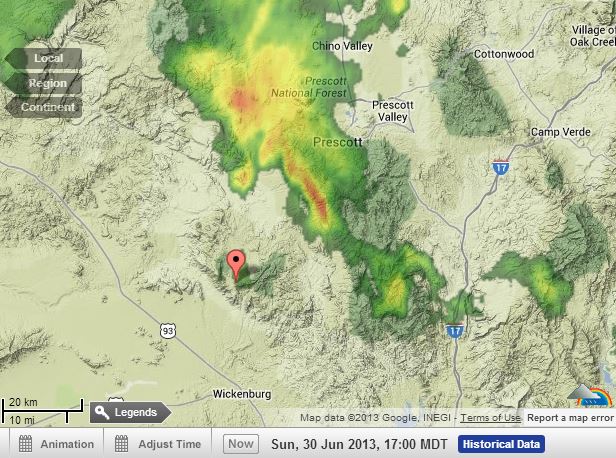
Radar at 4 p.m. MST, June 30, 2013 The pointer is at Yarnell, Arizona. WeatherUnderground.
The radar map above from WeatherUnderground shows a thunderstorm cell north and northeast of the fire at Yarnell, Arizona. The pointer is at Yarnell. The cell was moving toward the southwest, and may have produced strong winds that changed the wind direction by 180 degrees and could have been part of the reason the fire moved into Yarnell. It also could have caught firefighters by surprise.
In 2014 an animation of the weather event was developed by Janice Coen, Ph.D., a Project Scientist at the National Center for Atmospheric Research in Boulder, Colorado. It simulates through a coupled weather-wildland fire environment model the spread of the Yarnell Hill Fire and the wind direction and speed. The arrows indicate the wind direction; the length of the arrows varies with the wind speed.
Below is a summary written by Ginger Pinholster, of the recent research conducted at Embry-Riddle Aeronautical University about the event.
Nineteen firefighters who lost their lives in Arizona’s 2013 Yarnell Hill fire were likely victims of the same meteorological event that caused a deadly 1985 airplane crash, Embry-Riddle Aeronautical University researchers have reported.
City of Prescott firefighters who were members of the Granite Mountain Hotshots were probably surprised by a sudden microburst during the Yarnell Hill fire, according to Embry-Riddle meteorologists Curtis N. James and Michael Kaplan.
A microburst, and the wind shear induced by it, was also what sent a commercial airliner careening off the runway at Dallas/Fort Worth International Airport, killing 137 people on Aug. 2, 1985. That accident prompted major improvements in aviation safety. The National Transportation Safety Board concluded that there had been no way for the L-1011 aircraft to detect microbursts and wind changes. In response, NASA researchers developed new warning technology, and the U.S. Federal Aviation Administration required all commercial aircraft to have on-board wind shear detection systems.
Firefighters do not yet have equivalent protections.
Although microbursts can be detected by Doppler weather radar scanning right above the ground, radar signals are blocked over mountainous terrain or in remote areas where wildfires occur. With funding from the National Science Foundation, James and Kaplan have been collaborating with researchers and graduate students at North Carolina A&T University as well as the National Weather Service to better understand and learn from the tragedy of the Yarnell Hill fire.
On June 30, 2013, “Firefighters knew about the squall line over the Bradshaw Mountains and its outflow moving toward Yarnell,” said James, professor of Meteorology on Embry-Riddle’s Prescott Campus. “What they weren’t anticipating was that a storm cell would develop and create a microburst just to the east of Yarnell. We think the outflow from that microburst rushed westward toward the fire, which then redirected the fire’s motion.”
Microbursts can form very quickly around the periphery of larger, previously identified storms, explained Kaplan, an Embry-Riddle adjunct faculty member and professor emeritus with the Desert Research Institute. “When they hit the ground, microbursts barrel outward, often at high speeds,” added Kaplan, who worked on a team that studied the 1985 crash of Delta Air Lines Flight 191 in Texas.
The Yarnell Hill fire, ignited by lightning amid a drought and extreme summer temperatures, turned in response to the microburst outflow. The fire then rapidly and unexpectedly advanced on the firefighters as they were trying to make their way to safety through a ravine, James said. Analysis of historical meteorological data showed that wind on the north side of the fire, at the Emergency Operations Center, was moving from the north-northeast at 13 miles per hour (mph), whereas in Stanton, southeast of the fire, the wind was gusting to 47 mph.
“It was a very different situation on the south side versus the north side of the fire,” James noted. “Fine-scale convective storm cells can create that type of variability in the wind. That’s something the firefighters weren’t anticipating.”
Staying Safe on the Front Lines
First responders should have access to more information about microbursts, the Embry-Riddle researchers said. Even as an initial thunderstorm may seem to be waning, “It may spawn new storm cells that are extremely focused and intense, and incredibly small sometimes, yet they can wreak havoc,” Kaplan said.
To help raise awareness of the risks of microbursts, James and Kaplan recently shared their findings at the Annual Meeting of the American Meteorological Society. The work has also been published by the journal Climate and the journal Atmosphere.
The next step for the research, Kaplan said, is to run higher-resolution model simulations coupled with a fire behavior model. If all goes well, this “forensic meteorology” approach will show the motion of the fire as it moved through the complex terrain toward the firefighters at Yarnell Hill. At a resolution of 50 meters, “That would get us pretty close to the scale of what the firefighters actually saw that day,” Kaplan said. “That’s our goal.”
In addition to James and Kaplan, the research team includes Mark R. Sinclair, of Embry-Riddle; North Carolina A&T State University researcher Yuh-Lang Lin and his graduate students; and Andrew A. Taylor of the National Weather Service. The research involved the use of the Cheyenne supercomputer at the National Center for Atmospheric Research and is funded by the National Science Foundation.
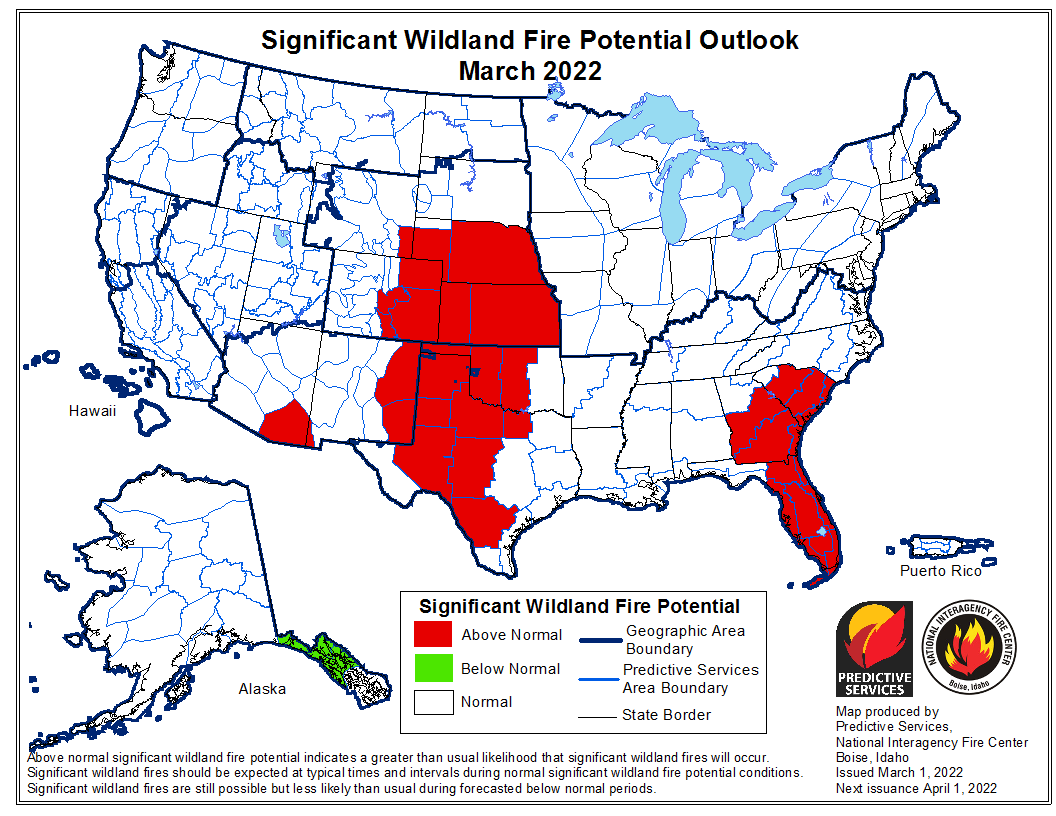
The forecast for wildland fire potential issued March 1 by the National Interagency Fire Center predicts that in March the potential for wildfires will be higher than average in Florida, Georgia, South Carolina, and the central and southern plains.
The data from NIFC shown here represents the cumulative forecasts of the ten Geographic Area Predictive Services Units and the National Predictive Services Unit.
Below:
Excerpts from the NIFC narrative report for the next four months;
Additional NIFC monthly graphical outlooks;
NOAA’s three-month temperature and precipitation forecasts;
Drought Monitor;
Keetch-Byram Drought Index;
Soil moisture.
“Most of the West, Plains, and Texas remain in drought, with abnormally dry conditions now across Florida and continuing in portions of the Carolinas.
“Climate outlooks through spring indicate areas receiving below normal precipitation will likely expand generally south to north across the West, with below normal temperatures likely continuing across the Pacific Northwest and northern Rockies. Much of the Great Lakes and Northeast are forecast to have above normal precipitation through spring, with near to above normal temperatures across the central and eastern US. Additionally, there are indications for an active severe weather pattern this spring from eastern portions of the Plains into the Southeast and Ohio Valley. Critically dry and windy periods will accompany the severe weather for much of the Plains, especially the southern and central High Plains.
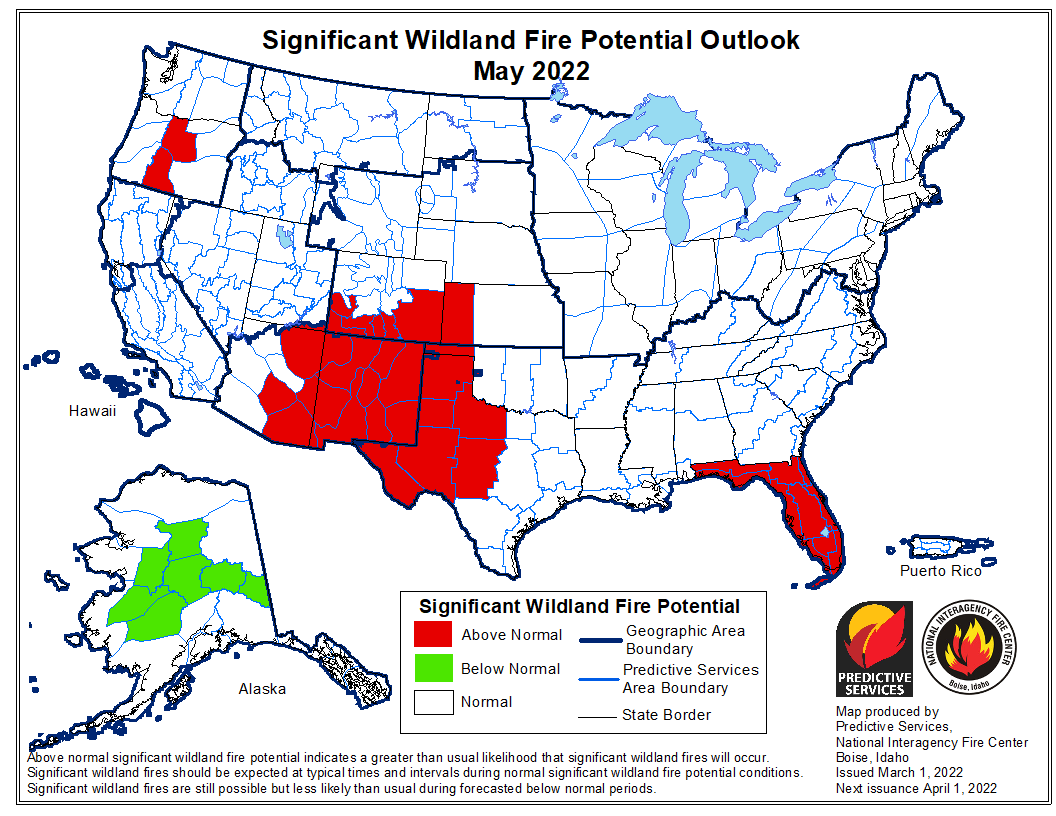
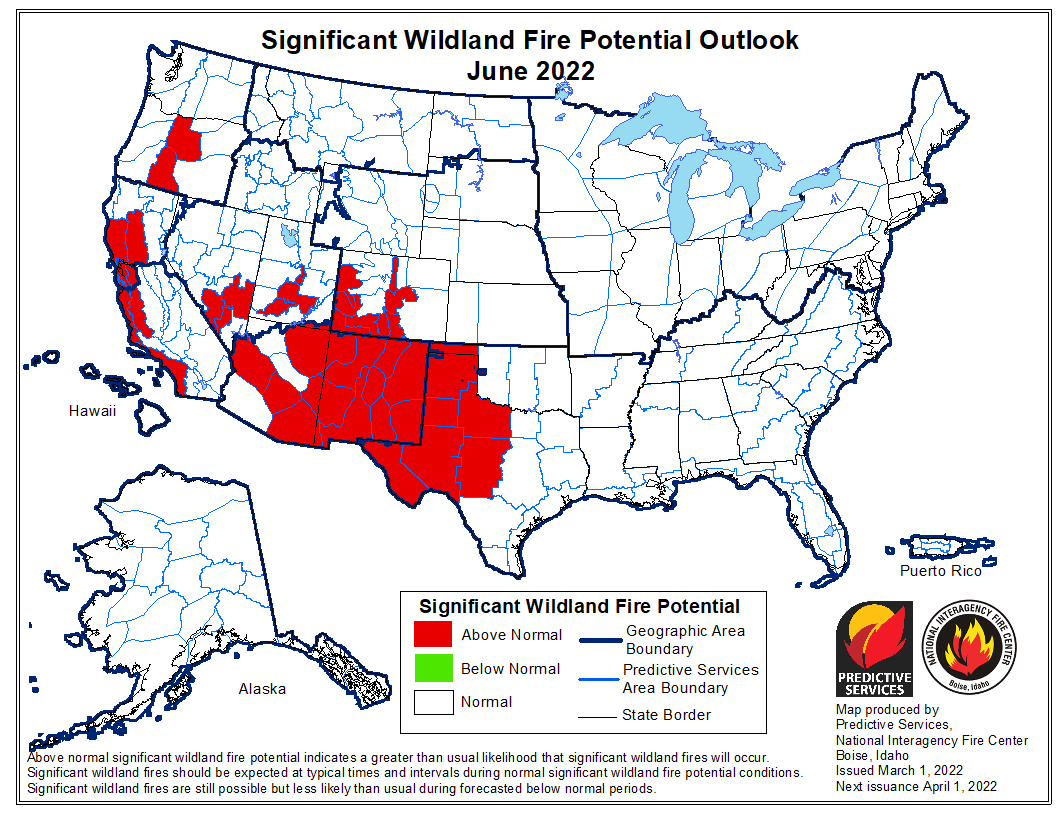
“Above normal significant fire potential is forecast to expand across Florida, Georgia, and the Carolinas during March and April, with lingering above normal potential forecast to remain in Florida during May. Much of the central and southern Plains are expected to have above normal significant fire potential into April, while persisting on the High Plains and eastern slopes of the Front Range into June. Above normal potential is forecast in portions of south Texas and the Hill Country during March, with the westward retreat of above normal potential in Oklahoma, Kansas, and Texas following the expected green-up procession.
Most of the Southwest is forecast to have above normal significant fire potential in May and June, with potential increasing across southern and western Colorado and southern portions of the Great Basin. Central Oregon is likely to have above normal significant fire potential in May and June, with above normal potential forecast across much of coastal California by June. Alaska is forecast to have below normal potential in its panhandle through April, with below normal potential expected across large portions of the Interior in April and May.
Temperature & precipitation outlook, 1 and 3 month. Feb. 28, 2022.
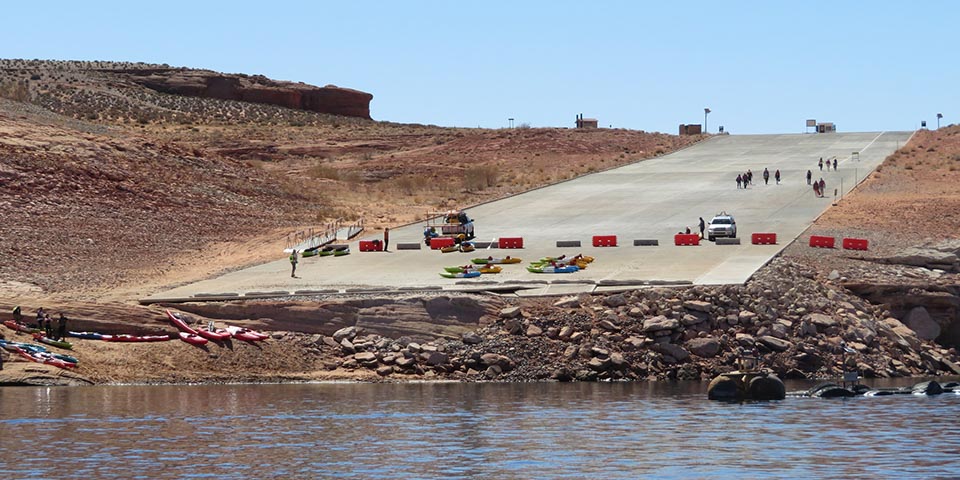
The public launch ramp at Antelope Point in late March, 2021 at Lake Powell, Glen Canyon National Recreation Area. NPS photo.
New research published this month shows that the current drought in the Western United States is the worst seen in data going back to the year 800. Scientists developed estimates of precipitation during previous centuries using tree-ring reconstruction and found 2000–2021 was the driest 22-year period in the last 1,200 years.
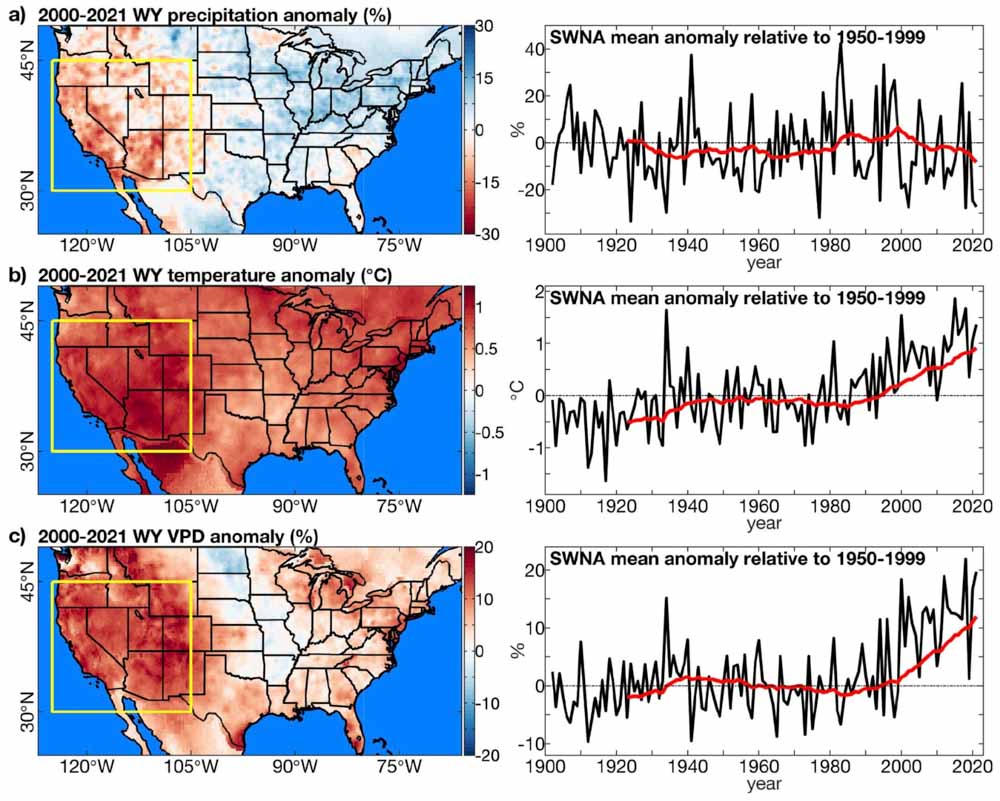
Observed climate anomalies. Anomalies in water-year (WY: October–September) (a) precipitation total, (b) temperature, and (c) vapour-pressure deficit (VPD). Maps on left show the average WY anomaly during 2000–2021. Yellow box: Southwestern North America (SWNA) study region. Anomalies are relative to 1950–1999. Time series on right show regionally averaged WY anomalies in SWNA (black) annually and as (red) 22-year running means visualized on the final year in each 22-year period. Geographic boundaries in maps were accessed through Matlab 2020a. From the paper.
Since the year 2000, southwestern North America (SWNA) has been unusually dry due to low precipitation totals and heat, punctuated most recently by exceptional drought in 2021. From 2000 to 2021, mean water-year (October– September) SWNA precipitation was 8.3 percent below the 1950–1999 average and temperature was 0.91 °C above average.
In summer of 2021, water levels at Lakes Mead and Powell, both on the Colorado River, reached their lowest levels on record, triggering unprecedented restrictions on Colorado River usage, in part because the 2-year naturalized flow out of Colorado River’s upper basin in water-years 2020–2021 was likely the lowest since at least 1906. Despite an active North American monsoon in 2021, the United States Drought Monitor classified more than 68 percent of the western United States as under extreme or exceptional drought for nearly all of July–October, 2021.
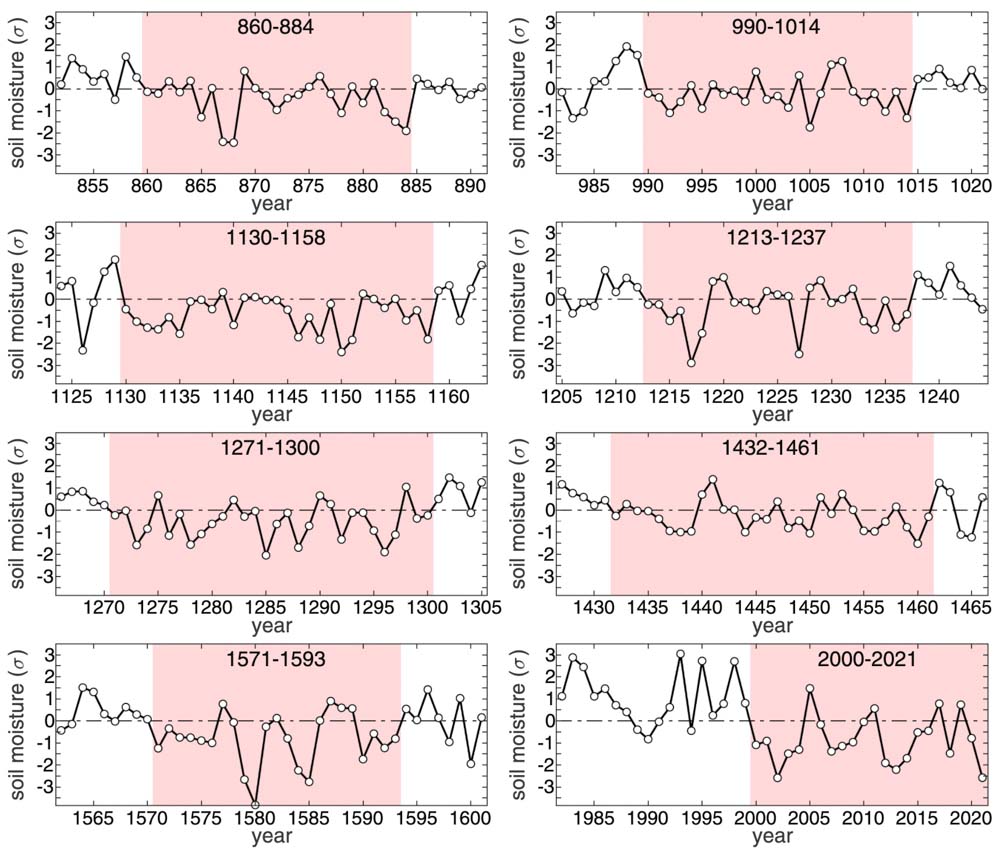
Extended drought events. Summer soil moisture anomalies, expressed as standard deviations from the 800–2021 mean (σ), during the longest 8 extended drought events during the 800–2021 study period. The pink background bounds the years of each extended drought event. The horizontal dotted black line represents the 800–2021 mean. For the first 7 droughts shown, soil moisture anomalies come from our tree-ring reconstruction. For the final drought (2000–2021), anomalies come from our observation-based record. From the paper.
The researchers concluded that anthropogenic climate change accounts for 42 percent of the SWNA soil moisture anomaly in 2000–2021 and 19 percent in 2021.
Drought can have a very significant effect on wildland fire behavior. It affects vapor pressure deficit (VPD), soil moisture, relative humidity, and moisture in live and dead vegetation, or fuels. VPD is an absolute measure of the moisture deficit of the atmosphere and is more closely related to water stress on vegetation than relative humidity.
Soil moisture is a particularly important integrator of drought. Of all 22-year periods since 800, only two (1130–1151 and 1276–1297) contained more years with negative soil moisture anomalies than the 18 observed during 2000–2021.
The authors wrote that the 22-year long current drought is highly likely to continue through a 23rd year.
Extreme and exceptional drought in the western United States (US). Weekly percentage of western continental United States (west of 103°W) classified by the United States Drought Monitor (USDM) as under extreme or exceptional drought from January 1, 2000 to December 28, 2021. Calculations were made form weekly shapefiles of USDM drought classifications, available at https://droughtmonitor.unl.edu/DmData/GISData.aspx as of January 9, 2022. The USDM is developed by the National Drought Mitigation Center (NDMC), the U.S. Department of Agriculture (USDA) and the National Oceanic and Atmospheric Administration (NOAA). From the paper.
The research was conducted by A. Park Williams, Benjamin I. Cook, and Jason E. Smerdon.
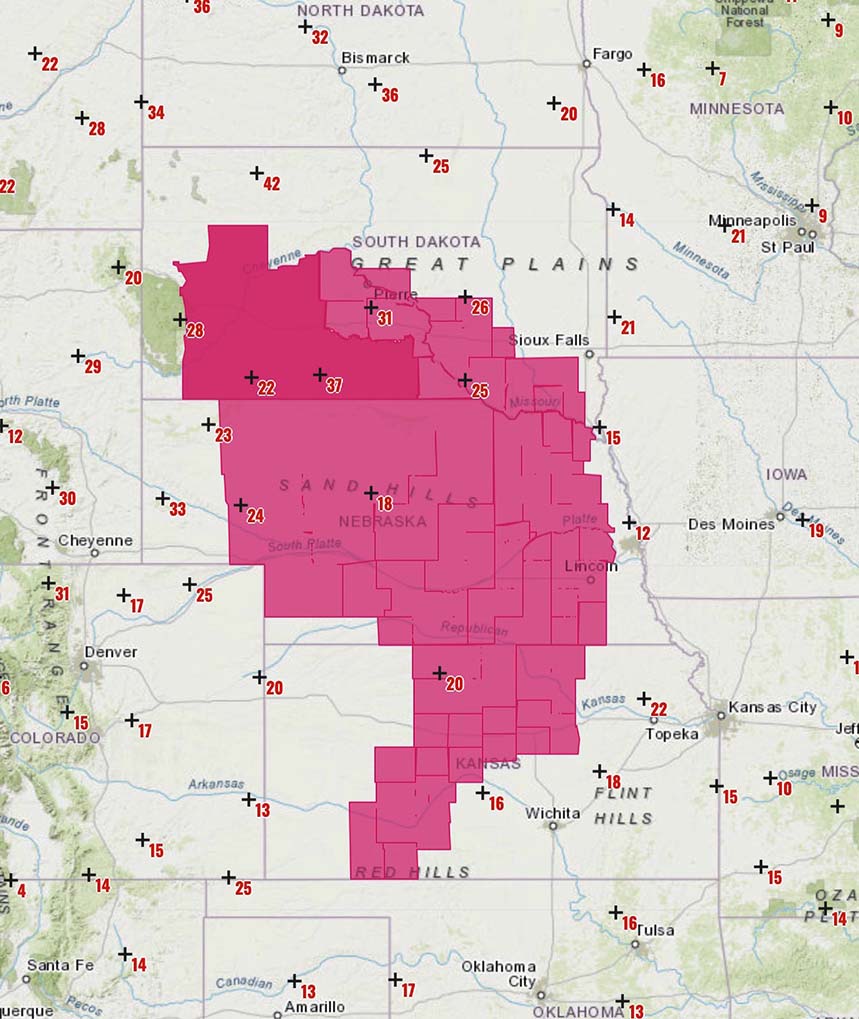
Red Flag warnings, Central Plains. Map shows wind gusts at 10:45 a.m. CST Feb. 8, 2022. NWS.
A Red Flag Warning is in effect February 8 for low humidity and strong winds in parts of the Central Plains Tuesday, affecting areas in South Dakota, Nebraska, and Kansas. The warnings expire around sunset.
The forecast from the National Weather Service calls for increasing winds in the morning, tapering off in the late afternoon:
South Dakota: 20 to 25 percent RH with 20 to 45 mph winds gusting at 50 to 65 mph.
Nebraska: 15 to 25 percent RH with 20 to 30 mph winds gusting to 45 mph.
Kansas: 17 percent RH with 20 to 25 mph winds gusting to 40 mph.