The Hot-Dry-Windy Index (HDW) is a new tool for firefighters to predict weather conditions which can affect the spread of wildfires.
It is described as being very simple and only considers the atmospheric factors of heat, moisture, and wind. To be more precise, it is a multiplication of the maximum wind speed and maximum vapor pressure deficit (VPD) in the lowest 50 or so millibars in the atmosphere.
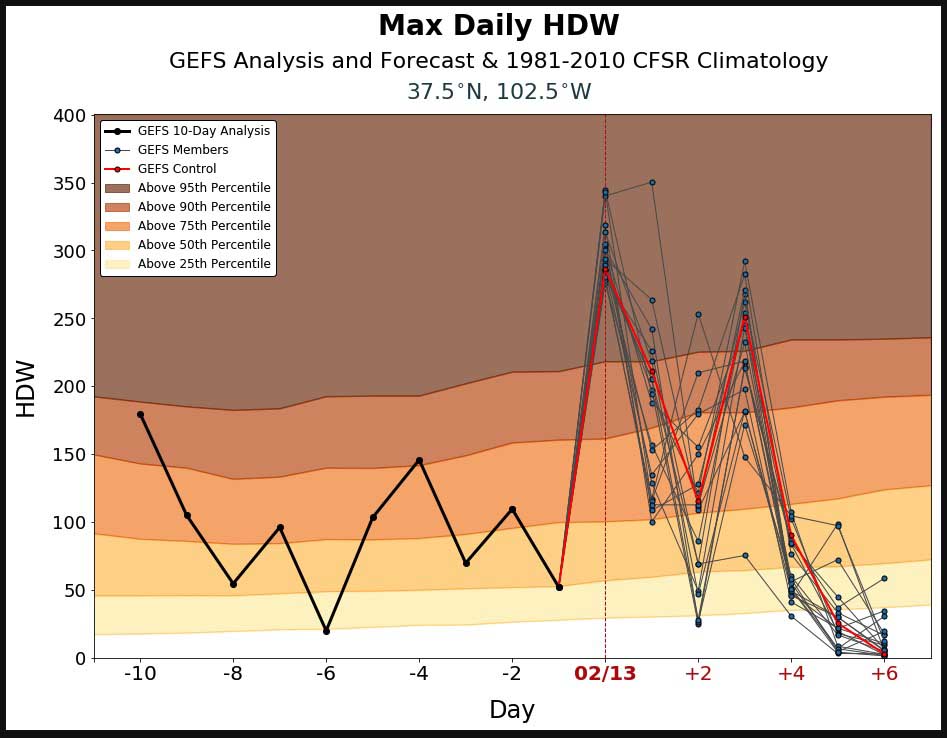
On a website bearing the logos of the U.S. Forest Service, Michigan State University, and St. Cloud State University, you can click on the map to display the HDW for any area in the contiguous United States. Then the displayed chart shows the index for the preceding 10 days and the forecast for the next 7 days. For the current and following days you will see results of the Global Ensemble Forecast System (GEFS), which is a weather forecast model made up of 21 separate forecasts, one control (in red) and twenty perturbations. The reasoning for showing 21 different forecasts is to quantify the amount of uncertainty in a forecast by generating an ensemble of multiple forecasts, each minutely different, or perturbed, from the original observations.
The HDW only only uses weather information – fuels and topography are not considered by HDW at all. If the fuels are wet or have a high live or dead moisture content it will not be reflected in the data.
Another thing to keep in mind is that the rating which is shown on the percentile gradient compares the HDW to the average for that date, from 1979 to 2012, at that location on a 0.5-degree long/lat grid spacing, rather than to a year-long average.
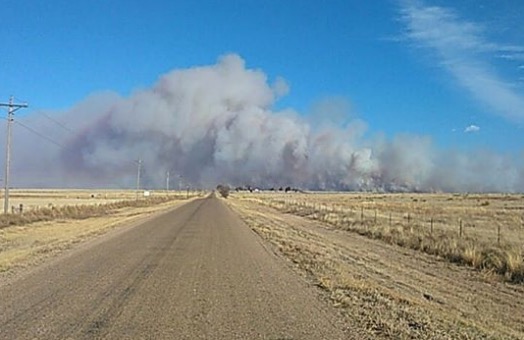
Yesterday, February 13, the CR34 fire in southeast Colorado burned 3,800 acres. Judging from the way the smoke column was laying over it was pretty windy.

At the top of this page is the HDW prediction for yesterday at the location of the CR34 Fire, showing the predicted index for February 13 above the 95th percentile for that date.
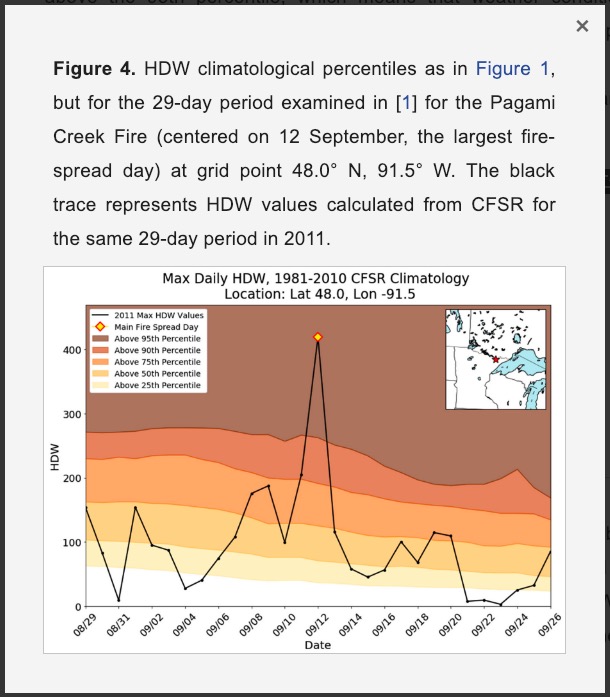
The actual HDW below is centered on the most active day on the Pagami Creek Fire which was managed, rather than suppressed, for 25 days, until it ran 16 miles on September 12, 2011 eventually consuming over 92,000 acres of the Boundary Waters Canoe Area Wilderness in Minnesota. Eight USFS employees were caught out in front of the fire in canoes, with some of them having to deploy fire shelters. Like for the CR34 Fire, the HDW was well above the 95th percentile for the date.


Last year a paper was published about the Hot-Dry-Index, written by Jessica M. McDonald, Alan F. Srock, and Joseph J. Charney.
UPDATE: February 20, 2019: Brian Potter, a research meteorologist with the U.S. Forest Service, provided some preliminary results looking at how HDW performed during the 2017 Chetco Bar Fire in Oregon, as well as how the Haines index performed during that fire.


Respectfully, I don’t really see a lot of value in a system that doesn’t consider fuel. Utilizing this system may confuse folks to think conditions are dangerous even if they are not due to damp, un-burnable fuels.
I believe the lack of a fuel component limits the use of the HDW. If, for instance, it was used on a daily basis in mass media, it would not be practical to explain, for example, “Even though it shows we’re at the 95th percentile today, it rained yesterday so ignore the scary-looking chart.”
However, it could be useful among fire and weather professionals who monitor the daily fire danger and weather and understand how to interpret the analysis. There are only so many fire danger related inputs a fire manager can routinely track. The Haines Index has been one of them for years, but since Mr. Potter says, “there’s no evidence it provides any value”, maybe the HDW could replace it. (He said he’d supply data to back that up.)
And yes, someone attuned to the weather can walk outside and feel that it’s a hot day, and they can often get a general sense of the relative humidity, but I don’t know anyone who can hold their finger in the air and measure the vapor pressure deficit, which research indicates is a very important factor that influences fire behavior. In addition, seeing the data for the preceding ten days and the forecast for the next seven can be valuable.
FYI — This website and the comment section are open to anyone who follows the terms of service. So we need to be careful about evaluating opinions in the comment section (even if they are verbose and strongly worded) that are expressed here especially if the writer insists on remaining anonymous. They could be written by someone with no training or experience in wildland fire.
UPDATE: February 20, 2019: Brian Potter, a research meteorologist with the U.S. Forest Service, provided some preliminary results looking at how HDW performed during the 2017 Chetco Bar Fire in Oregon, as well as how the Haines index performed during that fire.
Mr Potter,
You might touch bases with Paul Chamberlin.
When he was with the Missoula Smokejumpers in the early 2000’s he and another jumper were working on something similar. They also tried to make it field/user friendly by identifing high risk days with a color coded system – red / orange / yellow, etc.
Not sure where Paul is these days, pretty sure he has since retired, but the MSO base would know.
I’m one of the co-creators of HDW, and I’ve worked on Haines Index related questions. AL S.’s questions are absolutely appropriate, and in fact these were the first questions we felt needed answers, before we produced HDW or put anything out on the web.
I’ll start with the Haines Index. Don Haines has been telling me for 25 years that it should be replaced. It was never intended to be used as it’s been used – it was designed to be used as a “start day” assessment of how bad a fire would be. But people say it has value, it helps identify the problem days, so maybe the way it’s used, it works. From a scientific standpoint, though, there’s no evidence it provides any value. I’ve looked at 40+ fires and how the Haines values performed, and it’s only marginally better than a random guess. (I’ll put links to publications at the bottom).
We knew that firefighters need and want some sort of summary weather index, and we wanted to provide something that was based on solid science. We tried saying look at the whole picture – much like AL’s descriptions of incidents and weather patterns, but people really like, and want, an index.
There’s no question, scientifically or in terms of common sense, that hot, dry, windy conditions are worse for fires. We started from that. The one piece that HDW captures that just looking around does not give you is, the way we compute it now, we look at the conditions from the ground up to about 1500’ above ground. That’s a height where we can argue the air could easily come down and affect the fire – with dryness, wind, or both. We tried using just the surface conditions, but found that they often miss the big events – something *is* going on above ground that affects the fire, and the current HDW seems to get that.
One of the issues with the Haines Index was, it wasn’t well tested. We are in the process of testing HDW in several ways. Last year, we targeted it at Incident Meteorologists so we could get their feedback. We need feedback from the field, because that’s a critical part of figuring out how the science best serves the firefighting community. If anyone has science questions or observations about any of this, I’ll be happy to answer what I can, here or via email.
A general discussion of problems with the Haines Index: https://www.publish.csiro.au/wf/pdf/WF18015
A data-driven study of Haines Index performance: https://www.mdpi.com/2073-4433/9/5/177
The first HDW paper, prior to the one Mr. Gabbert cited: https://www.mdpi.com/2073-4433/9/7/279
Brian — thank you for your explanation of your HDW project. In regard to your algorithm, specifically your ground to 1500 feet data, while that might work well in some areas, I’m not sure how well it would work in the Rogue River-Siskiyou National Forest (RRSNF).
From the Chetco River and the Chetco Bar, it is over 2800 feet to the top of the ridge, below which is where the Chetco Bar Fire (CBF) started. It’s a VERY steep ridge and I have no idea what the elevation above sea level might be; either at the Chetco Bar or at the top of the ridge.
That ridge is unique, although the entire RRSNF is comprised of both VERY similar and completely dissimilar ridges, with wildly varying heights and face angles, some being very similar and some completely dissimilar to the ridge where the CBF began life. One size most definitely does not fit all.
As a result, wind direction and speed can be difficult to impossible to accurately judge, much less measure. You can move a few hundred or a few thousand feet, and the wind could be anywhere from 90 degrees to 180 degrees displaced from the direction you started from, with the wind speed varying just as wildly. Get ABOVE all those ridges and 200′ tall Douglas Firs and you’ll feel and measure the TRUE wind speed and direction.
Once the Chetco Effect is in full force, the wind comes out of the northeast and blows southwest, directly into Brookings; a near perfect, straight line. Smoke and ash fills the air, and until the Chetco Effect dissipates, 5 or 6+ days later, we ALL suffer.
At any rate, and while I continue to be skeptical, for ALL our benefit, I wish you nothing but the best of luck in making a difference to firefighters and to those who manage the fires during the coming fire season, which is only 5 months away.
AL, you just raised a great list of “next steps” and “other areas” topics we need to understand.
* One of the biggest gaps in our fire weather knowledge is how much shifting wind directions matter for fire behavior, and how to capture those in some tool.
* HDW as we produce it on the website is pretty low resolution – once per day, and half a degree of latitude and longitude. We did that because we could see that it does show some value there. We’re working on several studies to see whether it has value at shorter time or smaller spatial scales.
* Is there an adaptation of HDW that works for local effects, like the Chetco Effect? I haven’t heard of that before, but it sounds like a relatively small scale Santa Ana type wind. Several years ago I toured the Biscuit area, and I hope to do the same with Chetco Bar. Maybe I can answer this question better after I’ve done that.
* How did the Haines Index and HDW perform during the Chetco Bar fire? I actually have that data at work. It’s not reviewed or critiqued yet, but I will post a short working draft summary when I’m back at the office tomorrow.
* When and how should firefighters use an index? That’s a big question, but the easy answer is: to get started. Assuming the index works, it should point you to situations of concern. Then you dig in, either using local knowledge to figure out how things will develop, or to see just why the bigger scale situation is changing and what it means. It’s like the Zen saying about the finger pointing at the moon – don’t look at the finger, look at the moon!
In all of this, in my experience, the most significant factor is local knowledge. It can’t be approximated by a tool or index, and we still need people who are familiar with the lay of the land, the fuels, and how the weather acts when the forecast says a particular thing is going to happen.
Brian — having lived in Colorado (Denver area), Southern California (San Diego area), and Oregon (Brookings), I am intimately familiar with all three ‘wind effects’ associated with those locations; Chinook Winds (CO), Santa Anna winds (SoCal), and Chetco Effect (SW OR). As I’m sure you know, the vast majority of those wind effects begin as a result of high pressure fronts moving into and across the Western Great Basin.
Here in SW Oregon, the Chetco Effect can also begin as the result of high pressure fronts moving into the area from the North, Northwest and West. Collecting historical info and data on those and other ‘wind effects’ should be fairly easy, given that they have been observed and documented for at least 150+ years now.
As to using ‘local knowledge’ (expertise) on a fire, during the Chetco Bar Fire, the USFS did not want, did not ask for and would not accept the offer from locals who have lived here their entire life, retired foresters with 30-40 years experience in our forest, anyone who KNOWS our forest and could, at the very least, show them where homes and private property are located and where NOT to start backburns. Nor would they listen to the dire warnings and predictions from locals about the Chetco Effect that, from a smoldering 1/4 acre fire, ultimately caused the burning of 192,000 acres and the destruction the homes, property and lives of 14 local families.
In fact, during one of several public meetings at the Brookings High School gym, and in front of well over 100 local citizens, USFS Incident Commander Bob Houseman declared loudly and with authority that, “There is no such thing as a Chetco Effect!”
It would be GREAT if the USFS would listen to and consult with local experts in our area, but they don’t and they won’t. If an ‘imaginary’ Chetco Effect kicks in, GREAT! It’ll just burn up more forest and ground fuel they would otherwise have to spend LOTS of money on removing, IF they did controlled burns in the RRSNF and Kalmiopsis Wilderness. They haven’t done any appreciable amount of that in going on 40 years now.
The USFS doesn’t ‘manage’ wilderness forests; they let them burn, whether homes and/or lives are in the way or not. They DO, however, manage fires, but they DON’T put them out anymore. They stopped putting fires out a LONG time ago. Now they go ‘big box’ and wait until the fall rains (Mother Nature) put a fire out … or not. Either way, they really don’t care.
According to their daily incident reports, they do indeed get weather reports, and even Haines Index reports, none of which actually changes either their tactics or their attitude; it’s just another fire and it WILL continue to burn.
Excuse my skepticism, but where the USFS is concerned, it is learned through experience and is WELL documented; 1986 Silver Fire, 2002 Biscuit Fire, 2017 Chetco Bar Fire, 2018 Klondike Fire, and whatever name they pick for the 2019 fire that’s only 5 months away. We have 1.8 million acres of unmanaged wilderness forest, and the USFS has bearly put a dent in it.
Really? Wildfire managers and their crews need SOFTWARE to predict what a fire will do when it’s HOT, DRY and WINDY? Did IQs suddenly plummet? Does NO ONE actually STEP OUTSIDE anymore to see what weather conditions are like?
And by the way, what happened to the Haines Index, and why isn’t THAT number being folded into this shiny, new algorithm?! If you’ve never heard of the Haines Index, here ya go;
“The Haines Index is a weather index developed by meteorologist Donald Haines in 1988 that measures the potential for dry, unstable air to contribute to the development of large or erratic wildland fires. DUH!
No, we’re not unique, but here in Southwestern Oregon (Brookings), when it’s HOT, DRY and WINDY, that means there’s a Chetco Effect blowing, and the Haines Index is at or near its highest level; 6. An index of 5 is still bad. It also means that if there’s a fire burning, it’s already WAY beyond our, the USFS, the ODF, CFPA or anyone else’s ability to either control OR extinguish.
What that also means is that yet another Megafire is going to transform yet another huge chunk of the Rogue River-Siskiyou National Forest and/or the Kalmiopsis Wilderness into more dead, burned, blackened snags that WON’T be logged but WILL remain standing to provide a continuing safety hazard to firefighters, so the USFS can yet again apply the MIST policy, go ‘Big Box’ and LET IT ALL BURN.
Those same weather conditions apply in Southern California (Santa Anna winds), Colorado (the Chinook Winds), and many other areas of the West that are similarly effected. Generally, it starts with a high pressure front moving into the area, and progresses from there. NOT oddly enough, this has been going on for CENTURIES, so it’s not like any of it is brand new or had never occurred before ‘climate change’ became on issue.
It does beg the question though; what changed that suddenly the Haines Index is NOT a good or completely valid predictor of what a fire will do? Anybody want to take a shot at that one? Or is this new weather software just another excuse to pat each other on the back and ignore the REAL reasons our forests are being reduced to ashes?
You appear to be very confident in your opinion. https://en.wikipedia.org/wiki/Dunning%E2%80%93Kruger_effect
While I, and I’m sure others, certainly appreciate the link to the description of your mental condition, I really don’t see how that contributes to the current discussion.
The Haines index only includes atmospheric moisture content and atmospheric instability (measured by the lapse rate). It doesn’t include actual wind speeds or the influence of temperature. It is a very useful algorithm but this new index should provide better correlation with current and forecast conditions and extreme fire behavior.
Or, one can simply walk outside and assume that if it’s HOT, DRY and WINDY, that the wind conditions will push a fire along at a fairly snappy clip, that the dry conditions will contribute to keeping ground fuels nice and combustable, and that the heat will make life miserable for the firefighters. Are those NOT fair assumptions?
The USFS employed modeling software during the 2017 Chetco Bar Fire, and again in 2018 during the Klondike Fire, and both times the fires blew up in their faces and the Chetco Effect turned them into Megafires. How does modeling software help you fight a fire that’s being driven by 40-60 MPH winds, in single digit humidity and 100+ degree heat?
What do you suppose will happen when you start setting backburns in those same conditions? Who in their right mind would set a backburn in 40-60 MPH winds and NOT expect it to contribute to the conflagration?
But, that’s exactly what the USFS did, and the modeling software did WHAT to change the final result or advise the Incident Commanders to do anything other than get out of the way of the fire and HOPE conditions change for the better?
If you put the fire out while it’s still small (the ODF way), all other issues dissapear. Let a fire burn in the Rogue River Siskiyou National Forest / Kalmiopsis Wilderness during fire season, and when the Chetco Effect kicks in, the end result is always the same.
Try and convince the 14 Brookings families who lost EVERYTHING to the Chetco Bar Fire that weather and/or fire modeling software would have saved their homes. When that fire was detected, it was a smoldering 1/4 acre; no flames, just smoke, and the USFS went ‘big box’ and let it burn.
When the ODF, South Coast Lumber and Mother Nature finally put the fire out, it had consumed 191,125 acres, and we, the citizens of Brookings, had breathed smoke for 60 straight days.
What would weather modeling software change in that equation?