
When Don Haines developed what became his namesake index, he never intended it to be used operationally. As a meteorologist for the US Forest Service, at one point he was given two tasks — determine how weather conditions led to the escape of the 1980 Crane Lake prescribed burn in Michigan, and create a fire weather tool to prevent future tragedies. The escaped prescribed burn became the Mack Lake Fire which killed one person, destroyed 44 structures, and burned 20,000 acres.
In 1988 the result of his work was published in National Weather Digest, titled “A lower atmospheric severity index for wildland fire.” He retired shortly after, but made it clear he intended his work to be the beginning, not the finished product, of the development of a fire weather index after refinement and feedback from subject matter specialists.
It became known as the Haines Index, described by NOAA as “Based on the stability and moisture content of the lower atmosphere that measures the potential for existing fires to become large fires.”
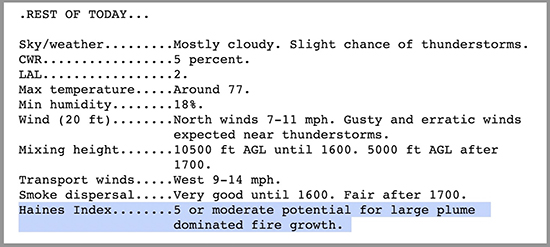
It is widely used and often included in fire briefings and weather forecasts. It is based on two components, the temperature difference between two prescribed pressure levels; and the moisture component, the dew point depression at a prescribed pressure level. Some may think of it as a measure of atmospheric stability, but as you will see below, that may not be appropriate. With an unstable atmosphere there is less resistance to the vertical movement of air, which can make it easier for a convection column of rapidly rising air and smoke to form over an intensely burning fire, affecting the rate of spread. Add a strong wind, high mixing level, low humidity, low fuel moisture, and steep slopes and a fire can be over the hill before you can get the wind gauge out of your pocket.
“Fire science is not rocket science—it’s way more complicated.”
Robert Essenhigh, Professor Emeritus, Mechanical and Aerospace Engineering, Ohio State University.
In “The Haines Index — it’s time to replace it” published in 2018 in the International Journal of Wildland Fire, Dr. Brian Potter, a Research Meteorologist with the US Forest Service wrote:
Subsequent studies have sought to evaluate the Index, with results that do not support its use in the original form. Yet it is used operationally across the United States, and elsewhere. Mills and McCaw (2010) produced a modified Index, following the sort of refinement Haines stated was necessary. In its present form, the Haines Index cannot be considered a scientifically designed, complete or verified metric that provides any information on fire behaviour or fire danger.
Dr. Potter also wrote a more detailed analysis of the Haines Index published the same year in MDPI Atmosphere, “Quantitative Evaluation of the Haines Index’s Ability to Predict Fire Growth Events.”
On June 3 Darren Clabo, the State Fire Meteorologist for South Dakota, posted two seven-minute videos on YouTube, Part 1 and Part 2 of “Don’t Use the Haines Index.”
“The idea for these videos grew out of conversations with many of my colleagues across the country, with notable head nods to Dr. Brian Potter and Larry Van Bussum,” Mr. Clabo told Wildfire Today. “Dr. Potter has been working to rid the field of the Haines Index for two decades now and these videos are just an extension of that work.”
Hot-Dry-Windy Index
A possible alternative to the Haines Index which was introduced in 2019 is the Hot-Dry-Windy Index. It is described as being very simple and only considers the atmospheric factors of heat, moisture, and wind. To be more precise, it is a multiplication of the maximum wind speed and maximum vapor pressure deficit (VPD) in the lowest 50 or so millibars in the atmosphere.
In 2019 McKenzie G. Kulseth, a graduate student at Michigan State University, wrote her thesis about the HDW Index, titled “An evaluation of the Hot-Dry-Windy Index using historical fire events and meteorological analysis datasets.” She concluded:
The results of this study suggest that the original HDW formulation is capable of identifying the largest fire spread day for between 56.5 to 78.3% of the twenty-three wildland fire events used in this study.
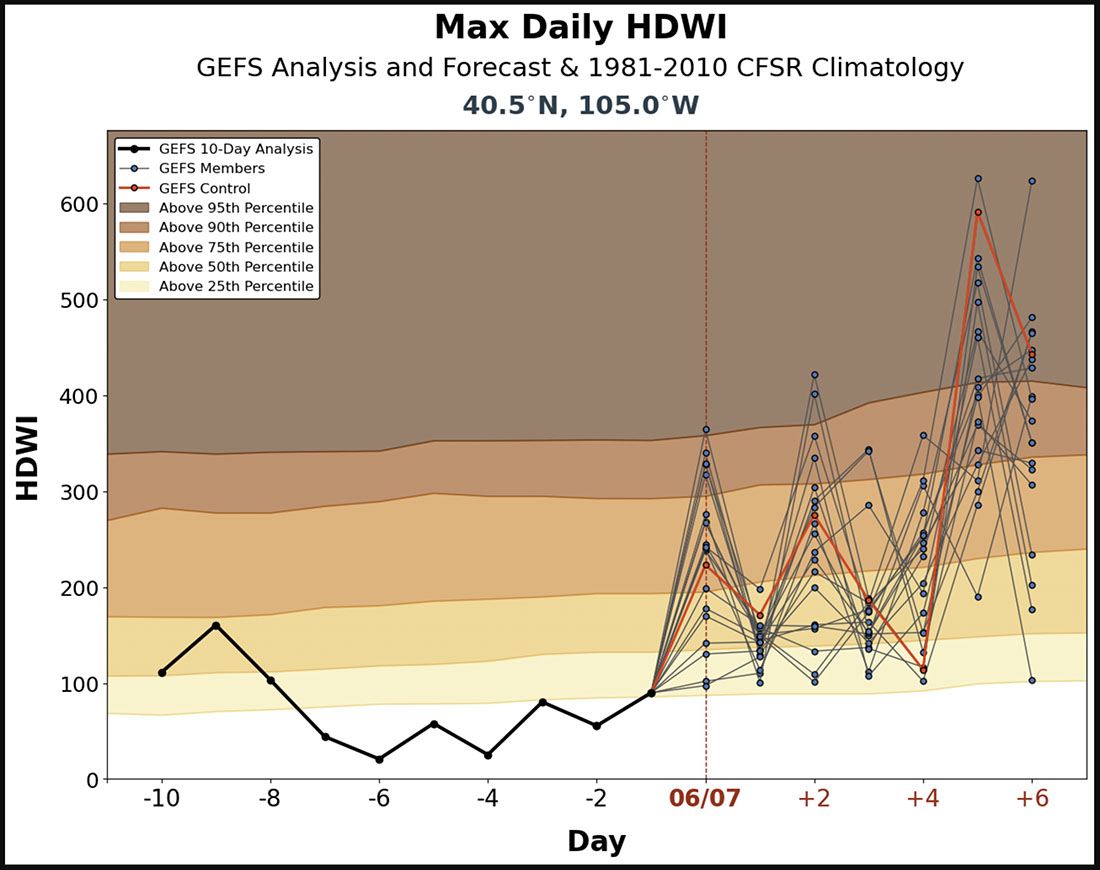
On a website bearing the logos of the U.S. Forest Service, Michigan State University, and St. Cloud State University, you can click on the map to display the HDW for any 0.5-degree long/lat grid spacing area in the contiguous United States. Then the displayed chart shows the index for the preceding 10 days and the forecast for the next 7 days, compared to a 30-year average for each day. For the current and following days you will see results of the Global Ensemble Forecast System (GEFS), which is a weather forecast model made up of 21 separate forecasts, one control (in red) and twenty perturbations. The reasoning for showing 21 different forecasts is to quantify the amount of uncertainty in a forecast by generating an ensemble of multiple forecasts, each minutely different, or perturbed, from the original observations.
The HDW only only uses weather information – fuels and topography are not considered by HDW at all. If the fuels are wet or have a high live or dead moisture content it will not be reflected in the data.
We asked Mr. Clabo, since he ruled out the use of the Haines Index, what should firefighters use, the HDWI?
“We need to first ask the question, what are we looking for?” he said. “If you are interested in a first-glance product for situational awareness, I think the Hot-Dry-Windy Index is a fantastic tool. If you are trying to diagnose the potential for plume-dominated fire growth, I think you need to critically assess your fuel moisture/fuel loading and terrain first and then look to see if the atmospheric conditions are favorable for pyrocumulus or pyrocumulonimbus development. If you are trying to assess whether or not large fire growth is likely, it might be better for you to look at maximum wind speeds.”
Our take
The lack of a fuel component limits the use of the HDW. If, for instance, it was used on a daily basis in mass media, it would not be practical to explain, for example, “Even though it shows we’re at the 95th percentile today, it rained yesterday so ignore the scary-looking chart.”
However, it could be useful among fire and weather professionals who monitor the daily fire danger and weather, can factor in current fuel moisture data, and understand how to interpret the analysis.


