In a comment on the earlier post about the Hot-Dry-Windy Index (HDW), Brian Potter, a research meteorologist with the U.S. Forest Service, offered to provide some preliminary results looking at how HDW performed during the 2017 Chetco Bar Fire in Oregon, as well as how the Haines index performed during that fire.
The HDW is a new tool developed for firefighters to predict weather conditions which can affect the spread of wildfires. It is described as being very simple and only considers the atmospheric factors of heat, moisture, and wind.
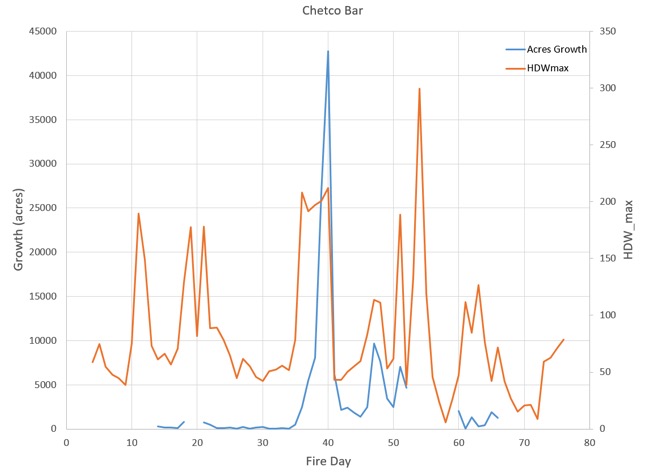
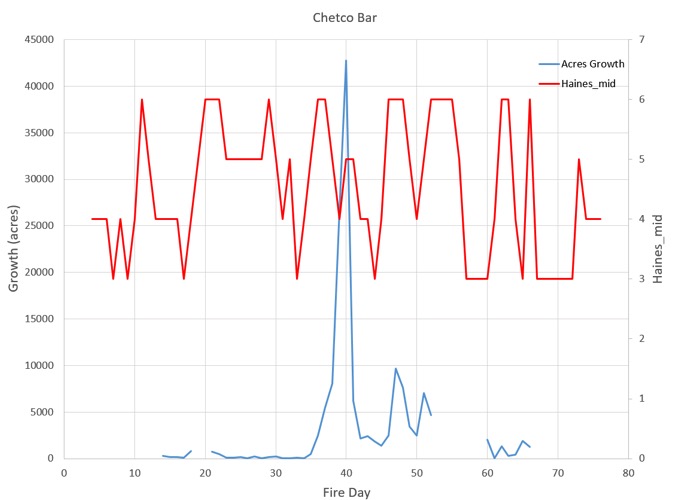
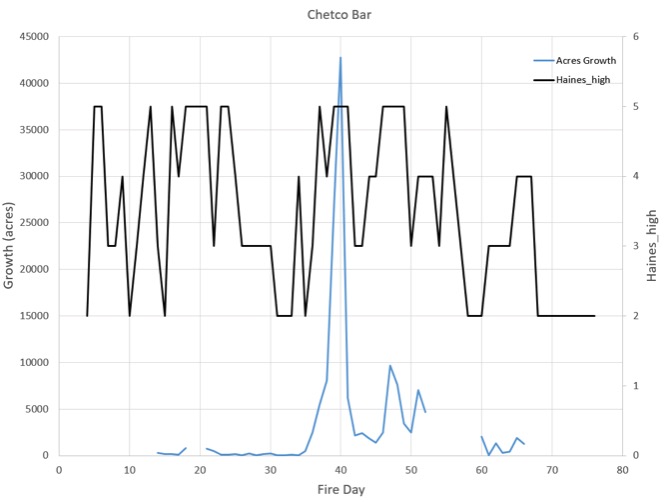
Mr. Potter has provided three figures showing the weather indices computed from the National Weather Service’s NAM model analyses. Because they use a different model from the HDW website, he does not have historic percentile values for HDW, but they are illustrative, nonetheless. These are preliminary data and have not been through peer review or evaluation.
Here is a graph of HDW values compared to growth on the Chetco Bar Fire:
Here are the Haines Index values for the mid-elevation version of the Index:
And the high elevation version of the Haines Index:
Mr. Potter said he has some thoughts about the graphs, but is interested in hearing what others take away from them.
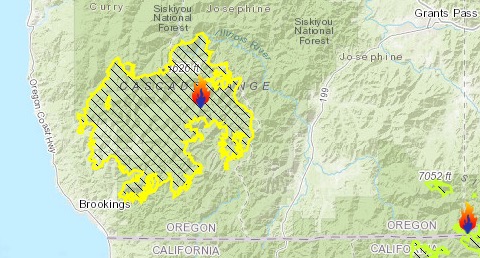
The Chetco Bar Fire in southwest Oregon started July 12, 2017 and burned over 191,000 acres.


The graphs are interesting but of limited use because of too few data points to really establish correlation. The one thing I did note on the HDW graph that might be interesting to explore is the cumulative HDW in the days preceding the large fire growth periods. You’d expect a good relationship between how long it had been hot, dry, and windy (hence reducing fuel moisture) and the propensity for large fire runs. I’m sure the authors have already done this but I’d be curious about changing the relative weighting of the factors in the index or perhaps looking at a non-linear relationship in the index between how long it had been hot and dry before the importance of wind picked up.
Just idle speculation.
You make two excellent points. Yes, this is just one fire and about 50 points. The paper introducing HDW did just that – introduced it. We wanted to get it into the science literature because that’s how we can encourage others to start testing and evaluating it. The original authors (myself, and Drs. Alan Srock, Jay Charney, and Scott Goodrick) each have our own projects looking at different aspects of HDW. The “40+” fires I referenced in an earlier post are part my of effort to bring together many more data points, something like 800.
Your other point about looking at cumulative HDW is also part of that study. We believe HDW works for broad-scale, daily guidance on when the trouble days occur, but even that needs the rigorous testing you and others have mentioned. There are logical and physical reasons to think it might work for other things, but those require a similar amount of testing.
The excellent questions and comments people have been posting here are opening a window to look in at what goes on in research. There’s no finish line, and there’s always more testing. But getting to the testing can require publishing a paper on the basics so that others join in. When Don Haines published the Haines Index (LASI, originally) in 1988, he intended for that to be the first paper, in what he believed would be a long series of studies that would ultimately lead to a much better, and probably very different, index. But he retired shortly after that, and while a few people published work looking at how the original formulation did on individual fires, little was done to refine it. Adding a wind component was one of Don’s biggest hopes, and has never been done. So stay tuned, and keep providing feedback on what you see as strengths, weaknesses, and potential uses of HDW and HDW-like measures. (And as several others have done, feel free to email or call me if you prefer.)
One idle thought that occurred to me was to use the HDW as an intermediate to a “ready-to-burn” index. The idea would be to establish a threshold (or series of them) that would cause the RTB index to move up or down with a bit less amplitude than the HDW or Haines indices do.
Start off with a neutral RTB of 0. For each day above a threshold HDW (say 150) the RTB would increase towards 1 (cumulative ratio of some kind). For each day below the threshold (say below 100) the RTB would decrease back to 0. For days between 100 and 150, it would stay neutral at whatever the previous value was.
The thresholds would take some tweaking, perhaps testing HDW against traditional fuel moisture measurements to see how they are related. The end result might not be too far different than traditional fire-danger rating systems so it might end up just trying to re-invent the wheel. But this is all just idle conjecture on my part, something I tend to do a lot of.