A report published this week by researchers in Montana indicates that century-old policies to suppress wildfires as quickly as possible is actually contributing to more severe and larger fires over time. The study, published Monday in the journal Nature Communications, examines what the researchers call “suppression bias.”
They identify “suppression bias” as the consequences of knocking down low- and moderate-intensity fires: Other fires will burn hotter and scorch broader areas of forest and land, and people experience more of the most destructive fires, according to a story in the Daily Montanan. “Over a human lifespan, the modeled impacts of the suppression bias outweigh those from fuel accumulation or climate change alone. This suggests that suppression may exert a significant and underappreciated influence on patterns of fire globally,” lead author Mark Kreider, a doctoral candidate at the University of Montana, said. “By attempting to suppress all fires, we are bringing a more severe future to the present.”
On the other hand, the researchers said less suppression of lower-intensity fires might make firefighting easier in the future. Kreider authored the paper along with four other UM researchers and professors and an ecologist with the Aldo Leopold Wilderness Research Institute in Missoula.
The Big Knife Fire outside of Arlee, Montana, on the afternoon of Sunday, July 30, 2023. (Photo by Nicole Girten, Daily Montanan)
They compare suppression bias when it comes to fire management to doctors overprescribing antibiotics. “In our attempt to eliminate all fires, we have only eliminated the less intense fires (that may best align with management objectives such as fuel reductions) and instead selected for primarily the most extreme events (suppression bias) and created higher fuel loads and more ‘suppression-resistant’ fires.”
The USFS estimates that 98 percent of wildfires are fully suppressed before they reach 100 acres in size – most of them within 72 hours. In Montana, fire managers try to contain fires as quickly as possible; Gov. Greg Gianforte said last year that crews kept 95 percent of fires in Montana to 10 acres or less in 2022.
Montana’s state fire policy, adopted in 2007, specifies that minimizing property and resource loss is the priority in fighting fire and is “generally accomplished through an aggressive and rapid initial attack effort.” The policy also says that forest management including thinning and prescribed fire improves forests and that inadequate practices to reduce interface risk could jeopardize Montanans’ constitutional right to a clean and healthful environment.
But as more development, particularly in the West, encroaches on the wildland/urban interface, a century of fire suppression and climate change has ballooned federal suppression costs from hundreds of millions a year in the 1990s to an average of $2.8 billion a year from 2018-2022 (NIFC data). Total annual acreage burned has doubled, on average, from what burned in the mid-1980s, and traditional fire seasons have increased by a month in duration, according to federal fire managers.
But the new research suggests that reducing suppression for low-intensity fires and allowing them to burn when conditions are good could mean that fire managers won’t face so many extreme fires in the future.
A Bridger Aerospace CL-215T scooper drops water on the Colt Fire in late July. (Photo courtesy Colt Fire Incident Management / Inciweb)
Last year, federal agencies updated the Cohesive Wildland Fire Management Strategy to include more prescribed burns and more fuels treatments to reduce risk of wildfires and to better account for climate change when modeling future forecasts.
Philip Higuera, a co-author of the paper and a professor of fire ecology at UM, said it may seem counterintuitive, but the research shows that accepting that more wildfires should burn (when it’s safe) should be the main takeaway. “That’s as important as fuels reduction and addressing global warming,” he said.
~ Thanks and a tip of the hardhat to Dick for this one.
In the northwest portion of Lake Superior is a chunk of land of about 132,000 acres that is both a geographic novelty and an International Biosphere Reserve. The Isle Royale National Park is 56 miles off Michigan’s shore and 18 miles from Minnesota’s mainland. Congress designated the 50-mile-long island as a national park in 1931, but even before that it was apparent the island’s boreal forests had a close history with fire.
“Official fire record keeping began in 1847, when the first General Land Office survey of Isle Royale was conducted,” according to the park’s website. “These records show 31 fires between 1847 and 1898. Data suggests fire was more frequent and/or severe in the boreal forest of the island’s northeast end, compared with the northern hardwoods of the southwest end.”
The island’s dense concentration of high-flammability trees, e.g. balsam fir, black spruce, and jack pine, heightened the risk of wildfires igniting when lightning struck. A zoologist in 1931 recognized the important role fire played in the island’s unique ecosystem, but his ideas were discarded in favor of the system-wide preference toward fire suppression.
Flammable species on Isle Royale
“In planning for improvements and facilities on Isle Royale, the National Park Service consulted with University of Michigan Zoologist Adolph Murie,” the park said. “Murie visited Isle Royale in June 1935 and recommended that no new trails be cleared by the CCC and all efforts be made to ‘guard against any sort of development which will reduce space or increase travel.’ He also recommended that forest fires be allowed to occur on Isle Royale, but this idea was rejected, and instead, an aggressive anti-forest-fire point of view was adopted.”
Officials would soon come to regret dismissing Murie’s ideas. Park historians describe the summer of 1936 as hot and dry. Hundreds of CCC enrollees arrived at the heavily logged and mined island to establish the park. On July 25, a fire started near the Consolidated Paper Company and, while a cause was never determined, the “Fire of 1936” would have the most profound effect on the natural and human history of Isle Royale compared with any other historical event.
Around 200 CCC members and loggers tried in vain to fight the fire as it grew from 200 to 5,000 acres over 10 days. The fire was reported as contained on August 4, but two spot fires that had ignited on August 2 would become much larger problems. By August 18, the three fires burned 27,000 acres before they were officially declared out after heavy rainfall.
Multiple factors contributed to the high number of acres burned in the fire, park historians said. The island’s ground was, at the time, mostly covered in highly flammable mosses. In-fighting between the park system and CCC members, including a short CCC strike when tobacco supplies ran out, likely made matters worse.
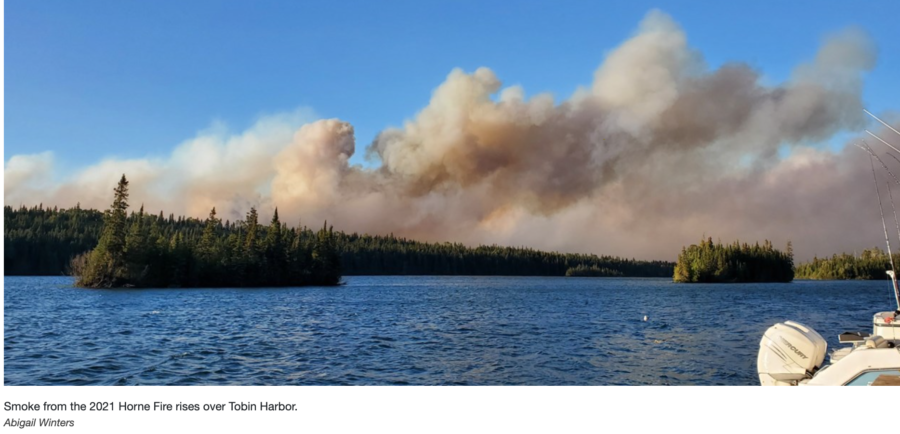
The island wouldn’t see significant wildfires again until the 2021 Horne Fire and the 2022 Mount Franklin Fire, which burned 335 acres and 6 acres respectively. In the fires’ wake, scientists and researchers hope to use the burned areas to learn more about the dynamics between fire and the island’s life.
“The area may look different, but wildfire is an agent of necessary change,” the park said. “At the site of the Horne Fire, Isle Royale ecologists now have a living laboratory, and these researchers can begin to study the relationships between fire, living things, and an island environment.”
It’s been four years since a near-perfect storm hit the U.S. West. COVID-19 was officially declared a pandemic by the World Health Organization in March 2020, just months before the worst wildfire season in recorded history.
The interactions between wildfire and COVID-19 were large and sweeping, research in the years since has shown. The 2020 season left lasting impacts on the wildland firefighting force, both systemically and personally.
Wildland firefighters are at high risk for both COVID-19 infection and, when infected, experiencing severe illness from the virus, research published in the National Library of Medicine and Science academic journals found. Researchers in one study examined potential health and workforce capacity impacts by modeling the movement of suppression resources across the country over a season and the corresponding potential for disease spread and cascading outbreaks across wildfire incidents.
The increased risk stems primarily from firefighters’ exposure to wildfire smoke, limited access to hygiene supplies, and constantly being physically near other wildland firefighters and the public.
IHC superintendents were surveyed by USFS researchers a year after the fires burned. At the beginning of the pandemic, the agency launched a wide range of new practices for hotshot crews to limit the spread of COVID-19 while also, it was hoped, improving operational efficiency. New practices included changes in pre-fire preparation, using virtual paperwork and briefings, and reformatting traditional fire camps to a more widespread layout. The USFS also created a COVID-19 Incident Risk Assessment Tool for fire managers; it measured numerous factors including camp size, mitigation techniques, and number of positive cases to estimate how at-risk each crew was.
The researchers wanted to know if superintendents were interested in maintaining any of those practices in daily hotshot crew use in the years after 2020, regardless of COVID-19. The survey found that the majority of practices contributed positively to operational efficiency in addition to crewmember safety and well-being. Most respondents preferred the ease of virtual vs. in-person paperwork and briefings, they liked having crews spike on or near the line with the full-scale ICP camp away from the fire, and they felt better physically and mentally as a result of these changes.
Wildland firefighter well-being — and proper pay — are still a major focus for the USFS post-2020 as retention becomes an increasingly worrying issue. Research conducted this year on retention found that highly skilled wildland firefighters with a high number of assigned days, payment of additional annual earnings, and gained experience throughout the firefighter’s career all had positive effects on retention. Local wages of alternative occupations in a firefighter’s local area had no significant effect on retention.
The future of wildland firefighter physical health may also see improvements thanks to technological developments stemming from COVID-19. Respiratory illnesses like coronavirus, and other long-term health risks firefighters face such as lung cancer and cardiovascular disease, may be seen in firefighters less and less as mobile respirators proceed further in development.
California fitted wildland firefighters with a mobile respirator prototype last October while they dug firelines or cut down trees with chainsaws. The results were mixed.
“Plenty broke. Hoses popped out of sockets. Straps snapped. Masks slid down sweating faces. Filters became dislodged,” Julie Johnson wrote for the San Francisco Chronicle.
During this event, firefighters from Cal Fire, L.A. County and the USFS took turns trying out several types of mask. They hiked down a slope and then back up, then pulled off their masks, sweating and breathing hard in triple-digit temps. Each round took only about ten minutes.
Firefighters shared their impressions with observers: Felt like a muzzle. Was too bulky. Too tight. It slipped off my face once I began to sweat.
Hearing one of her colleagues say “it’s better than nothing,” Cal Fire’s Sol Espinoza spoke up. “I’d rather take nothing,” she said.
The test is one of many completed or planned throughout the country as the fire agencies look to lower firefighter mortality from diseases increasingly found to be worsened through wildfire smoke inhalation. Experts have hedged their bets on technology frequently used to keep COVID-19 patients hospitalized with severe cases alive. Adaptations in the technology are still under development as researchers figure out which version might be best suited to meet the dynamic needs of firefighters in the field.
Espinoza, a firefighter with Cal Fire in San Bernardino. Espinoza said she could never imagine wearing a constrictive device that makes it harder to breathe.
The “beating heart of the American wine industry” has had to reckon with this question since 2017 when numerous wildfires spread across northern California’s famed wine country. The Tubbs, Atlas, and Nuns fires burned hundreds of thousands of acres, caused numerous deaths, and destroyed multiple wineries and vineyards in Napa and Sonoma counties.
The total acreage burned and widespread property damage caused the 2017 wildfire season to be the most destructive in California’s history. That record-breaking year was quickly surpassed by the 2018 and 2020 fire seasons. The 2020 season, in particular, also broke burn records in the other top American wine-producing states of Oregon and Washington, and even Canada in 2021. Wildfires in the years following impacted international wine markets as well, including Italy, France, and Australia.
Intense flames aren’t the only threat wildfires bring to vineyards; it’s also the smoke they produce. A condition called “smoke taint” causes wine grapes exposed to smoke to acquire “unmarketable smoky, burnt, ashy, or medicinal sensory characteristics,” according to the Australian Wine Research Institute (AWRI).
Agriculture-based technological developments, however, can only do so much to keep a fire-sensitive crop alive after it’s planted on fire-dependent lands. Grapes, while not technically invasive, have invaded portions of the Western United States’ lands and have largely usurped once highly forested regions where fire played an important ecological role. As prescribed fire establishes a larger role in modern Western land management practices, how long can an industry based on fruit that needs a smokeless environment survive and thrive?
What’s not well-recorded is how agricultural land conversions cleared millions of acres of conifer and oak forests throughout the state to make way for vineyards and other crop fields. In Napa and Sonoma counties specifically, areas now known as the pinnacle of “wine country,” modern vineyards sit on land that once supported massive oak forests culturally maintained by the area’s various Indigenous tribes.
“While almost all of the valley oaks are gone from Napa — the savannas were largely cleared to make way for intensive agriculture in the late 19th century — a few pockets remain,” a New York Times article on the Napa Valley Historical Ecology Atlas said. “The oldest trees, dating back more than 300 years, were alive when the Caymus, Napa, Canijolmano and Mayacma tribes managed the valley to produce abundant acorns, deer, salmon, and other staples.”
The clearing of these woodlands was coupled with a government-mandated suppression of cultural burning, a kind of prescribed burning Native Americans used to promote culturally significant foods and resources within a landscape. After a century of fire suppression, the USFS has begun to understand how significant cultural fire is to promoting biodiversity and creating healthy landscapes.
“Colonization and subsequent governmental fire policy mandates have disrupted the cultural use of fire, which in turn has disrupted ecological functions where those fires are absent,” USFS research said. “As society grapples with the devastating impacts of wildfires and the loss of biological diversity, many Indigenous people see traditional fire use as a key to mitigation of devastating losses while retaining traditional livelihoods associated with burning.”
In hopes of preventing future megafires, California increases prescribed burns throughout the state, including wine country. Even though research shows smoke from prescribed burns tends to be less harmful and toxic compared with smoke from wildfires, the grapes themselves don’t seem to care.
“Studies have shown that grapes need to be exposed to only a single smoke event, irrespective of the source, to become ‘tainted,’” AWRI said. “Bushfires, forest fires, planned burns, grassfires, and agricultural burns can all cause smoke taint if smoke from those fires is present in a vineyard at a high enough level for a period of time. Current research suggests fresh smoke presents the greatest risk for smoke taint, but smoke that has drifted hundreds of kilometers has also resulted in smoke taint.”
Efforts have been made for fire planners and wine producers to work together to minimize smoke’s negative effects on wine grapes, but thus far have mostly been in vain. AWRI and other wine industry researchers recommend the best time to conduct prescribed burns to limit smoke taint is during the height of wildfire season between May and October; before grapevine flowering and after grape harvest. The “usual” best times to set prescribed burns, mid-spring or in the fall, are the most at-risk times for smoke taint in grapes.
The contradiction is clear: Grapes, at least those that winemakers don’t want smoke-tainted, can’t exist in an area with regularly prescribed burns, e.g. California.
Grapes themselves are partly to blame for this. A concept called “terroir” has been used for centuries to describe the deep ecology behind why grapes grown in different places and in different ways acquire different qualities. Everything including temperature, soil, geology, elevation, water quality, wind direction, farming practices, and the winemaking process influences grapes and, by extension, the wine made from them. Even if researchers could 100 percent prevent smoke-taint issues in wine grapes, the grapes themselves would still be affected by the inevitable changes the fire-dependent landscape will experience in years to come.
The irony is that California does have native grapes, which thrived in the state’s pre-colonized and fire-dependent forests. In fact, the global wine industry wouldn’t exist today without California Wild Grapevines, as the species was used to save the European wine industry between 1870 and 1900 when most wine grapes were killed by leaf- and root-attacking aphids. Winemakers, in a last-resort desperate bid, used Califonia Wild Grapevine roots and grafted them onto European grape varieties. The result was a plant with the root resilience of a wild grape and the desirable taste of a European grape.
California wild grapes themselves, however, were originally discredited by European colonists for being too “foxy” and not containing enough sugar. But in a state destined to have more smoke, the more fire-resilient California Wild Grape, whose burnt vines can resprout, may soon be the California wine industry’s only option. One farmer in Sonoma County agrees and is experimenting with more than 30 different native grape hybrids in response to climate change.
The global wine industry is one of stubborn tradition. The industry’s desire to find easy “solutions” to existential problems without systemic change paints a worrying picture of the role California’s vineyards play in the state’s fight against future wildfires. Winemakers can only hide behind the industry’s $70 billion price tag for so long.
There comes a point at which economic benefit is outweighed by potential ecological destruction, and the industry will soon have to decide whether it will play a role in California’s solutions to megafires or actively hamper efforts to help make the state’s landscape healthy. Winemakers in California may soon have to answer the question of “when should this industry die?”
Researchers are still learning the full impact of the Australian brushfires that burned nearly 60 million acres, or 24 million hectares, between 2019 and 2020.
The most recent report on the bushfires focused on how they affected the nation’s tourism industry, specifically how previous reports underestimated the financial losses.
“Our novel research into the losses from the tourism shutdown resulting from Australia’s 2019-20 fires found that flowing on from direct impacts of AU $1.7 billion, indirect impacts along supply chains resulted in $2.8 billion in total output losses and $1.6 billion in reduced consumption,” the University of Sydney researchers’ report said. “We calculated significant spill-over costs, with total output losses being an increase of 61 percent on top of the direct damages identified.”
The study was reportedly the first time researchers documented changes throughout Australia’s entire supply chain, rather than focusing on specific parts of the Australian economy. Researchers said the ability to fully quantify disasters’ effects on a nation’s economy will become more important as climate change intensifies natural disasters.
“Natural hazards may increase economic inequalities, with the burden of climate adaptation and mitigation adding to the costs of governments already struggling under business-as-usual,” the report says. “Australia’s reputation as a pristine destination could become permanently damaged in the longer term under global warming, with fewer people traveling in Australia in our peak summer holiday season; similarly, people may start to avoid other countries and regions that are increasingly in the media for their wildfires and other natural hazards.”
Researchers are still learning the full impact of the Australian brushfires that burned nearly 60 million acres, or 24 million hectares, between 2019 and 2020.
Numerous reports have looked into different facets of the disastrous season, including the massive loss of plant life and firefighter experiences during the bushfires.
Wildfire seasons have been getting longer since the 1970s, according to (among others) the USDA Climate Hubs.
“The wildfire season in Western states has extended from 5 months to over 7 months in length,” the department said. Since the 1980s, the annual number of large fires and area burned has significantly increased (according to a report by Anthony Westerling, Hugo Hidalgo, Daniel Cayan, and Thomas Swetnam in the journal Science). The average burn time of individual fires has grown from 6 days (between 1973 and 1982) to 52 days (between 2003 and 2012).
The increase in another wildfire phenomenon may spell the end of wildfire seasons altogether and turn wildland firefighting into a year-round effort, more than it already is.
“Zombie fires,” or wildfires that smolder underground during the winter before reemerging in the spring, are becoming more common in Arctic forests, according to a 2021 study published in Scientific American. The most likely cause was attributed to climate change.
“Contrary to the hypothesis that overwinter fires sustain themselves in carbon-rich, organic soil layers known as peat, the researchers learned that most of them had burned in drier, upland sites with dense tree populations; the find suggested fires had instead smoldered underground in woody tree roots,” another Scientific American article on the subject said.
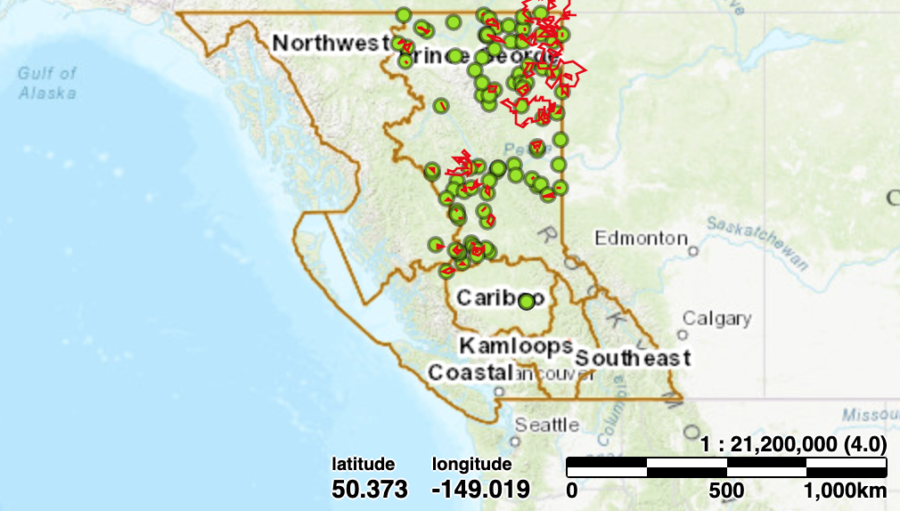
The woody tree roots in British Columbia’s boreal forests are feared to be the next place where a zombie fire could emerge, continuing Canada’s record-breaking wildfire season of last year. As of January 18, the BC Wildfire Service map shows that around 100 active wildfires are still burning in the province, some of which are still smoldering underground and threaten to kick off yet another disastrous wildfire season this year.
BC Wildfire Service map — current fires — 01/26/2024
It wouldn’t be the first time zombie fires foretold a bad fire season. At the beginning of 2023, British Columbia recorded 16 “carryover” fires, according to the Canadian newspaper The Globe and Mail, and BC Wildfire Service data shows that in most years since 2014, only five or fewer carryover fires were reported.
“A lot of people have talked about the 2023 fire season being over, but it’s not over,” said Sonja Leverkus, a BC wildland fire crew leader. “It is not over in northeast British Columbia. Our fires did not stop burning.”


 The island wouldn’t see significant wildfires again until the