Klamath County, Oregon develops system for tracking firefighters and mapping structure information

Half of our Holy Grail of Firefighter Safety is for firefighters and their supervisors to know the real time location of firefighting resources working on an incident. The other half is to know the real time location of the fire. These two pieces of information would greatly enhance the situation awareness and safety of the personnel. Not knowing this information has led to dozens of firefighter fatalities.

Keno, Oregon has spearheaded the development of a system that takes care of the the first half of the Holy Grail — showing the location of firefighters on a map. This is one of several systems nationwide that is being used by local organizations in the United States. Theirs goes far beyond that, however, and can display detailed information about structures.

Gene Rogers helped put the system together which has grown to include Klamath County. He sent us this description.

****

Klamath County Situation Analyst (KCSA) and Situation Analyst Field Tool (SAFT)

Decades of collaboration and experience with incident management challenges formed the premise of the goals and objectives developed by a rural fire chief, a retired federal fire manager turned consultant, and a state district forester. Brainstorming sessions often focused on a theme of what would make emergency management more efficient. The need for current information on emerging incidents that could be easily shared across the spectrum of cooperators was a goal. Their vision was to collect incident information at initial response that could be easily passed on as the incident evolved to extended response and ultimately to an IMT (Incident Management Team). Another goal was to minimize repetition, redundancy and confusion throughout any incident.  Applicability to any incident; structure fire, wildland fire, rescue, flood, earthquake, weather event, was a fundamental objective. Traditional paper maps and hand written notes contain information not readily shared with incoming responders. KCSA and SAFT are applications to enhance the sharing of information and greatly increase public and responder safety. These applications offer real-time, shareable, interoperable information on a common operating platform.

Following the completion of the Keno, Oregon Community Wildfire Protection Plan (CWPP) in 2003 attention was turned to gathering structure and parcel fuels data for Wildland Urban Interface (WUI) properties. In 2006 grant funds were used to recruit and train summer interns to collect the data on 10,000 Klamath County WUI residential properties.
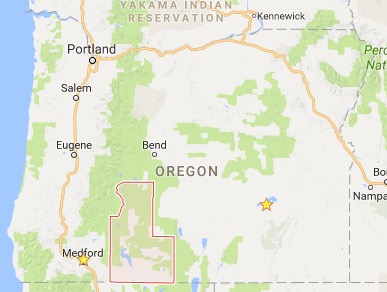
Klamath County, Oregon map
Klamath County, Oregon, outlined in red.

Current technology allowed for data collection on handheld data recorders, GPS units, and digital cameras. The data was assembled using commercial software from RedZone Software. Individual reports on each WUI structure and parcel included construction attributes (roof, siding, etc.), wildland fuel conditions, a photo of the structure and a composite risk score. The collected data was distributed to responding districts and agencies on compact discs and hard copy maps. The data and resultant hazard ratings were used in the 2007 Klamath County CWPP. The information was valuable but the project managers also wanted technology that allowed rapid sharing of data across the emerging technology of smart phones, tablet computers, and laptops.
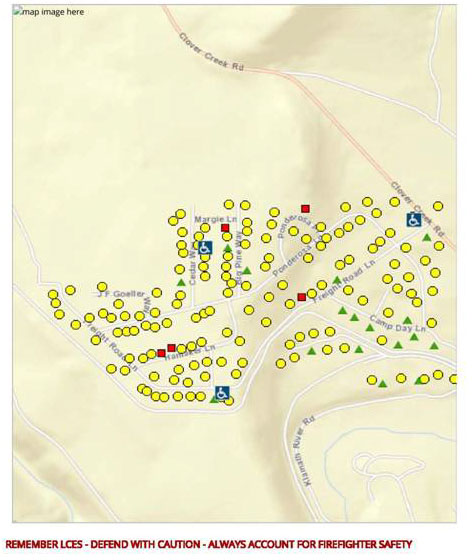
By 2013 the project steering committee had selected Intterra, a company specializing in geospatial information technologies, to integrate the Klamath County structure survey data, collection process, and other information into a modified version of their Situation Analyst named KCSA. Additional capabilities requested included Automatic Vehicle Location (AVL), real-time incident mapping on touch screen devices, structure pre-plan data collection, and a property owner feedback process. The Yarnell Hill Fire of June 2013 emphasized the need for managers to know the location of incident resources. KCSA and SAFT incorporate the capability to track resources by cell phone GPS or commercial GPS tracking devices on vehicles and personnel. The 2016 Klamath County CWPP update discusses the uses of KCSA and SAFT.
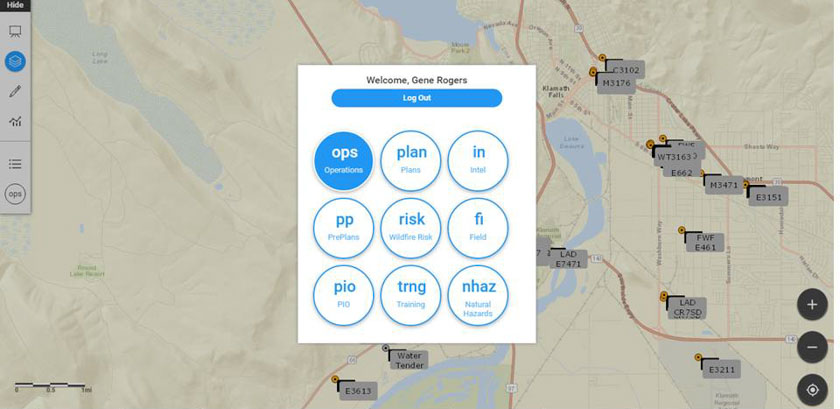
Firefighting resources mapped
Firefighting resources show up on the display.

KCSA is an application for connected devices that offers the full array of system capabilities. SAFT is an application that can be downloaded to mobile devices (from the App Store or Google Play). SAFT can be used whether or not the device is connected to the internet. Mapping, collected data, and pictures can be shared to users of KCSA when the device is connected. Example: field data can be collected in terrain without connectivity, then uploaded to the KCSA system when connectivity is achieved. Use of either application requires a Login ID and Password. Permissions to various capabilities are assigned when the user profile is established. This can be done pre-incident locally or at an incident when checking in arriving resources.

Permissions to use features in the applications relate to specific users and their level of qualification on incidents. For example: a Field Observer (FOBS) cannot edit the map prepared by someone with Operations permissions (OSC1/OSC2, OPBD, DIVS). Other capabilities relate to specific tasks. The Pre Plans (PP) module allows structure fire departments to map buildings with key information critical to their fire and rescue work. The available workspaces are tailored to the needs of that functional area, e.g., Plans or Public Information Officer.

The Risk module compiles the wildfire risk survey data for structures and parcels in the surveyed data. An onsite survey for a new structure and parcel can be completed in minutes. This is particularly useful for structure protection and evacuation planning in areas where surveys have not already been completed.  evacuation zone identification
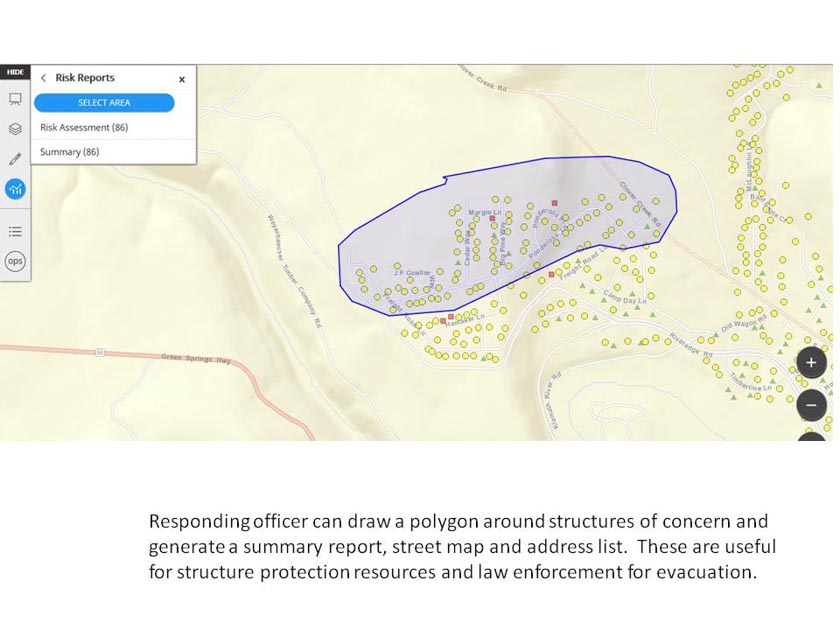
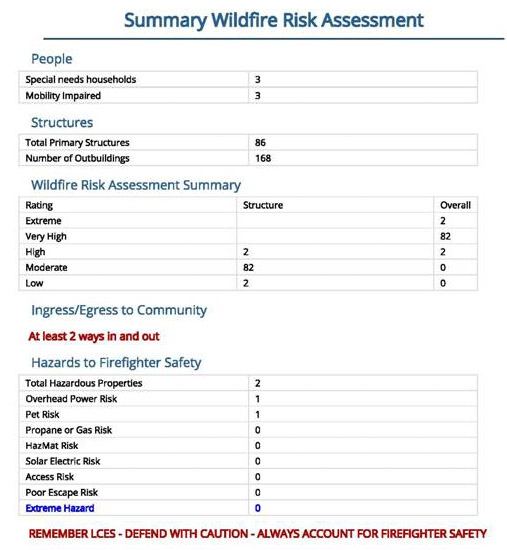
Evac area summary
Summary of the circled area.

Once surveyed, the user can circle the structures of concern and produce a map and address list to pass to Law Enforcement for evacuation. This takes seconds when the structures have been previously surveyed. Home symbol and color correspond to assigned risk score and rating adjective.  Homeowners can view their risk score at www.kcrsg.org.

Use of the applications is spreading in the emergency management organizations of Oregon.  The Oregon State Fire Marshal (OSFM) is supporting the use of the applications by OSFM Incident Management Teams. KCSA was used on wildfires in the southeast states in 2016. Klamath County fire districts, Oregon Department of Forestry, and federal wildland fire agencies are currently using the software.  Use of the applications is spreading into several other counties in Oregon. Grant monies funded the development of the applications.  Future expenses will be nominal and shared proportionally by users for the cost of the hosting server.  The software is free of charge.

This is a brief discussion of the development and capabilities of the KCSA and SAFT applications. Those interested in further information about Situation Analyst should contact Intterra at info@intterragroup.com.  Questions about the use of KCSA and SAFT can be sent to firechief@kenofire.com.

Wildfire preparedness for a changing climate

States were evaluated for how ready they will be to manage and mitigate wildfires in coming decades.

Above: Wildfire preparedness, according to StatesAtRisk.org

Two organizations have collaborated to develop what they call America’s Preparedness Report Card (StatesAtRisk.org), laying out their scores for how America’s 50 states are preparing for a changing climate. They came up with ratings in five categories:

  • Extreme Heat
  • Drought
  • Wildfires
  • Inland Flooding
  • Coastal Flooding

According to their web site, ClimateCentral.org, one of the two organizations, is “An independent organization of leading scientists and journalists researching and reporting the facts about our changing climate and its impact on the public.” The other, ICF International, is a private company that appears to offer a very broad range of consulting services.

We were most interested in their analysis of wildfire issues. The states colored gray on the map above are labeled “n/a”, which means wildfire was not identified as a threat. The methodology used was to determine the average number of days each year when the Keetch-Byram Drought Index exceeded 600. This was weighted by the county-level population living in the wildland-urban interface (WUI). They did not take into account fire history, the number of homes destroyed by fire, or vegetation.

We noticed, for example, that wildfire was not identified as a threat in Colorado in spite of the fact that in 2012, the Waldo Canyon Fire burned more than 18,000 acres, destroyed 347 homes in Colorado Springs and killed two people. Almost exactly a year later, the Black Forest Fire ignited east of the city and burned more than 15,000 acres, 486 homes and killed two people.

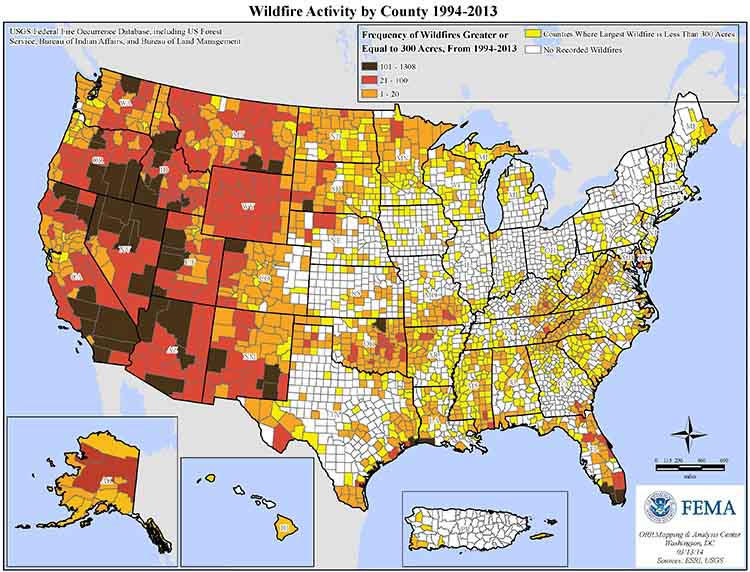
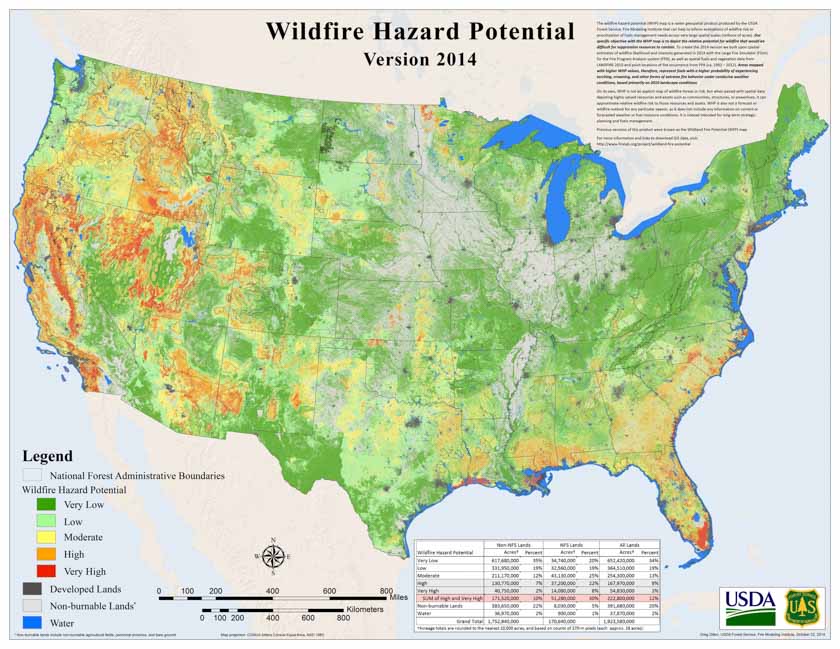
Their map is different from the ones below created by the U.S. Forest Service (showing the frequency of wildfires greater than 299 acres from 1994 to 2013) and FEMA’s map of wildfire hazard potential.

map wildfires by county

2014 Wildfire Hazard Potential

In looking at two other states, Alabama was given an “F” in wildfire preparedness while California earned an “A”.

The list of factors that were considered in determining the grades included:

  • Current wildfire vulnerability assessments and hazard mitigation and emergency response plans;
  • Guidelines or requirements for resilient activities (e.g., construction);
  • Wildfire adaptation policy or guidelines;
  • Communication with residents about mitigating for wildfire.

Below are graphical wildfire preparedness summaries from StatesAtRisk.org for Alabama and California:

Continue reading “Wildfire preparedness for a changing climate”

Wildfire potential, March through June

Posted on Categories UncategorizedTags ,

On March 1 the Predictive Services section at the National Interagency Fire Center issued their Wildland Fire Potential Outlook for March through June. The data represents the cumulative forecasts of the ten Geographic Area Predictive Services Units and the National Predictive Services Unit.

Below are the highlights of their report. Following that are NIFC’s graphical outlooks for April through June, NOAA’s temperature and precipitation forecasts, and the NOAA/USDA Drought Monitor.

****

“A typical transition of fire season activity is expected this spring beginning with the southern tier of the country. Fire activity will increase across portions of the southern plains and along the Atlantic Coast from the Carolinas south through Florida where the heavy loading of dry fuels coupled with warmer and drier than normal conditions is expected to create a potential for above normal fire activity. The increase in fire activity will be most noticed during high wind and low humidity weather events brought on by the seasonal transition from winter to spring. Other locations across the nation will see an increase in pre-green up fire activity as well, but this is not unusual. Southeastern Georgia and Florida may show a more significant increase in fire activity due to the emergence of long term drought conditions. Wetter than normal conditions across the Lower Mississippi River and Tennessee River Valleys are expected to lead to below normal fire potential during March. Look for the areas with below normal potential to be scaled back to mainly Tennessee and Kentucky from April onward as precipitation amounts received decrease to normal levels.

“Entering the latter periods of the outlook, Florida and Southeastern Georgia will remain in an elevated state for fire potential as drought lingers. The Southwestern and Alaskan fire seasons will begin in May as is typical. While normal fire season activity is expected across a majority of both regions, there are areas within both regions where an elevated potential for fire activity exists. Areas along and east of the Continental Divide in New Mexico have been and are expected to experience warmer and drier than normal conditions. In Alaska, the south central portion of the state has been abnormally dry which has resulted in a winter snowpack that is below normal. Given expected warm and dry conditions in May and June, an above normal potential for fire activity is expected to exist. Below normal fire potential is expected across the Central Rockies and the Sierra Mountains along the California-Nevada State line where the abundant winter snowpack should translate to a later than normal melt-off which could delay the start of the western fire season in the higher elevations.”

****

wildfire potential April 2017 wildfire potential May June 2017

**** Continue reading “Wildfire potential, March through June”

Wildfire probability Feb. 28 – March 5

The above map is a National Weather Service product that is new to me. According to meteorologist Nick Nauslar it is derived strictly from a fire history database. It is plotted on a 40km grid with some smoothing and it does not take fuels or weather into account. It is not available online yet, but there is an expectation that it will be soon.

And below apparently is the same data displayed in a different manner.

wildfire occurrence

Use an app to send precipitation observations to the NWS

Many areas where wildland firefighters are working do not have great coverage from weather radar because of the distance from the transmitter or steep terrain blocking the signals. You can help the National Weather Service produce better forecasts by using an app on your phone that can let them know what is happening at your location.

The message below from the National Weather Service in Rapid City uses local examples, but the principles are relevant in other areas:

****

Want to be a citizen scientist and help us determine what type of precipitation (snow, rain, sleet, hail, etc.) is falling?

Download the mPING app and use it to report various precipitation types as they occur. This data is incredibly helpful, especially because the terrain in SD and WY impacts radar coverage (can make it difficult to know what is happening at the surface far from the radar location in New Underwood, SD). Determining precipitation type can be rather tricky without observations at the surface. This is especially true when the temperature is just right that some places receive rain, while others get snow. That’s where the power of mPING comes in handy!

All reports are anonymous – only the location (latitude/longitude), time, and precipitation type are recorded.

The app can be downloaded on Android and iOS devices. If you have any questions, feel free to contact us or check out the mPING FAQ. We appreciate your willingness to help!

Links to the app here: http://mping.nssl.noaa.gov/

mPING FAQ: http://mping.nssl.noaa.gov/faq.php

Cancer and the San Diego Fire-Rescue Department

Above: Screenshot from Jason Curtis’ film about San Diego firefighters and the occurrence of cancer.

The San Diego Fireman’s Relief Association has produced a short 8-minute documentary about the occurrence of cancer within the membership of the San Diego Fire-Rescue Department, interviewing 15 firefighters who talked about their job and the disease. Many of them looked back knowing what they know now, and wished they had done some things differently.

(UPDATE March 2, 2017: the film was available at the website of the company hired to make the film, but it has been removed until the cancer awareness program associated with it has been rolled out. It may be available again on YouTube or another site in two to three months, according to Robert Bunsold, a board member of the Relief Association.)

The San Diego FD primarily deals with structure fires. The mix of by-products of combustion they are exposed to is different from what a wildland firefighter works in, but unfortunately we don’t know what the significance of that difference is, if any. There are carcinogens in wood smoke but much work still needs to be done to determine the short and long-term effects on wildland firefighters.

Structural firefighters generally wear breathing apparatus (BA) when they are making an interior attack on a structure, and often when they are on the exterior. But wildland firefighters never wear BAs on a vegetation fire because it is not practical. They can be working on a fire miles from their truck for up to 16 hours, but the air bottles only last for minutes.

Some wildland firefighters wear a bandana or dust mask over their nose and mouth, thinking, incorrectly, that they provide some level of protection from particulates. And they have no effect on carbon monoxide and other dangerous gasses.

The smallest and most dangerous particulates in vegetation fire smoke are so small that if one was near an 8-foot high ceiling in a room with perfectly still air, it would take 8 hours for it to fall to the floor. These particles can easily go through a bandana or a cheap mask and make their way to the lungs. Much more expensive respirators with certain types of replaceable filters could provide better air, but they are hot to wear and create too much resistance as the air is forced through the apparatus.

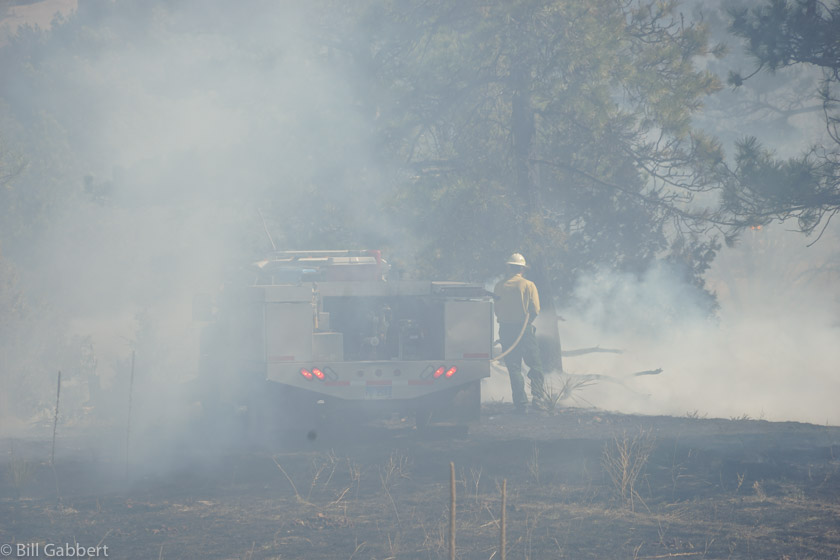
wildfire firefighter smoke
A firefighter works in the smoke on the Water Tower Fire in Hot Springs, SD March 1, 2016. Photo by Bill Gabbert.

There is no registry that tracks their exposure or health during and after their careers. Another bill was introduced in Washington this month to create a registry, but the one introduced a year ago died a quick death, and this newest one has far fewer co-sponsors and so far looks unlikely to pass.