Report released on entrapment of six firefighters on the Cedar Fire in Arizona

Above: Fire whirl on the Cedar Fire, June 28, 2016, around the time of the entrapment. Screen grab from the video.

A report has been released on the entrapment of six firefighters that occurred on the Cedar Fire south of Show Low, Arizona June 28, 2016.

The firefighters were part of the Navajo Interagency Hotshot Crew (NIHC) that remained along with two Type 6 engines and possibly one other crew after the Type 1 Incident Management Team was released the previous day. The assignment of half the crew, nine firefighters, was to “monitor” a part of the southwest side of the fire that had six miles of uncontained fire edge. The other half was working on the southeast side.

Three of the nine personnel on the southwest side served as lookouts while the remaining six were monitoring and checking the fire edge. When a very large fire whirl developed near the six, they realized their escape route was cut off, and took refuge in a previously burned area. The ground fuels had burned, but the canopy was still intact. As the fire approached they deployed their fire shelters, remaining in them for about 30 minutes.
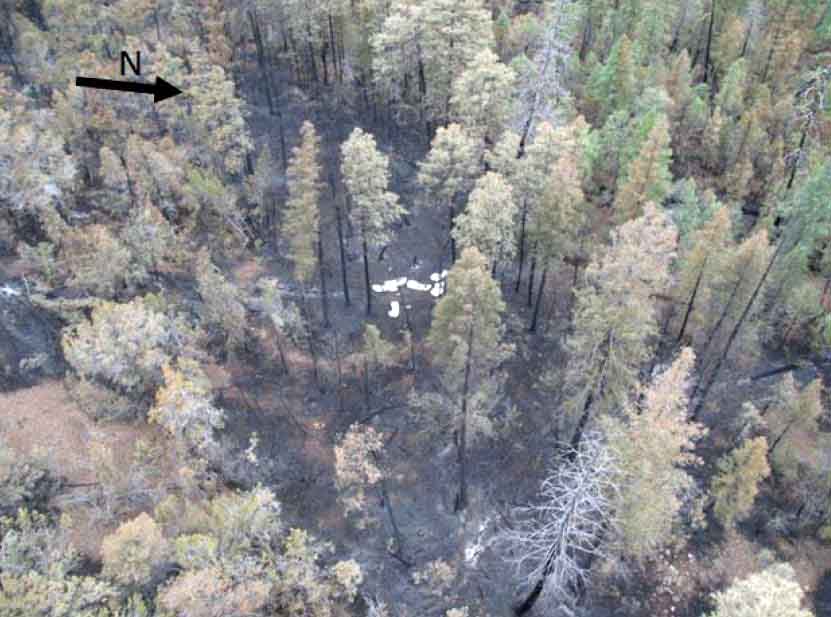
cedar fire entrapment site
The entrapment site at the Cedar Fire.

After the fire whirl subsided, the squad members were able to hike out to staged vehicles. They were transported in three ambulances, medically evaluated, and transported to Summit Hospital in Show Low, Arizona where they were evaluated. Two firefighters were treated for smoke inhalation and all were released by 10 p.m. that evening.

The report says the personnel deployed and entered the shelters just as they had practiced several times in training, and the devices worked as designed. There were no difficulties, as reported at other entrapments, with the PVC bags becoming soft and difficult to open.

Thankfully there were no serious injuries and the training the firefighters had received paid off.

But there are a number of interesting facts about what occurred before the entrapment

Resources on the fire

On June 27, the day before the entrapment, the Type 1 Incident Management Team issued their final update on the 45,977-acre fire just before they were released later that day. Below is a portion of the document.

cedar fire update

The report claims the Type 1 Team recommended that the number of personnel assigned be reduced on Tuesday June 28 to about 400. But on Monday, June 27 all firefighters except for two Type 6 engines were released. With a 70 percent chance of rain in the weather forecast, on Tuesday the local agency decided to replace the Type 1 Team with a Type 4 Incident Commander, two Type 6 engines, and one or two hand crews. The crew(s) had to be re-mobilized on Tuesday after being released. Some aircraft were also assigned on Tuesday.

Video of the large fire whirl

Weather on Tuesday, the day of entrapment

About 20 minutes before the 2:45 p.m. entrapment the weather at the fire was 95 degrees, 21 percent relative humidity, with a 7 to 10 mph wind out of the south. Although “numerous” people observed dust devils and fire whirls before the large fire whirl formed, there was no discussion about modifying fire suppression tactics. Dust devils can be an indicator of the potential for extreme fire behavior.
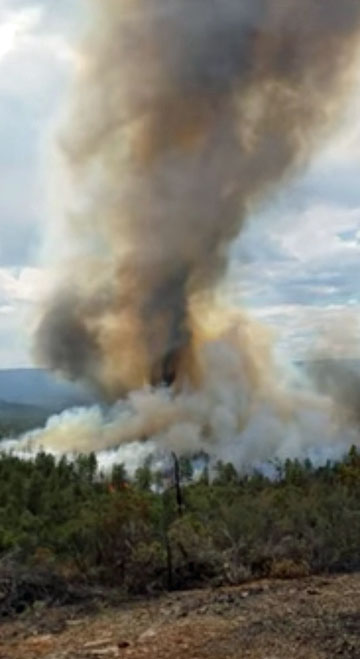
cedar fire entrapment
Fire whirl on the Cedar Fire, June 28, 2016. Screen grab from the video.

Firefighters from across the country assisting with wildfires in the south

wildfires southern area
List of wildfires in the Southern Geographic Area, as shown in the October 31, 2016 daily Incident Management Report. Click to see larger version.

As most areas in the western states are winding down or have already closed out their wildfire season, the fall fire season in the South is appearing on the radar as leaves fall off the trees and frost kills the herbaceous vegetation, providing additional fuel.

The Southern Geographic Area’s daily report includes nine fires over the last couple of weeks that exceeded 100 acres.

The Nantahala National Forest in western North Carolina has five active blazes that have burned 40, 100, 33, 11, and 374 acres. Elevated fire activity on the Forest has prompted fire management officials to transition from district management to a Type 3 organization. Effective Sunday, this enables more effective management of several fires simultaneously under the umbrella of one incident commander.

Additional resources have arrived to assist in suppressing ongoing fires as well as any new starts.  Crews from California, New Mexico, Michigan, Minnesota, Florida and Oregon have joined forces with local firefighters.

None of these fires show up on InciWeb.

fire map southern area
Location of wildfires as reported on October 31, 2016 by the Southern Area Coordination Center.

Thanks and a tip of the hat go out to Perry.

Strong winds and Red Flag Warnings, October 31, 2016

Above: The numbers indicate sustained wind speeds. The solid red areas are Red Flag Warnings. The lines show fronts. Reported at 12:40 p.m. MDT, October 31, 2016.

(UPDATED at 12:58 a.m. MDT October 31, 2016)

As weather fronts move across the Great Plains they are bringing strong winds today. Behind the trough (dashed yellow line) relative humidities are in the teens and twenties.

The National Weather Service has posted Red Flag Warnings for areas in South Dakota, Nebraska, and Colorado.

Red Flag Warnings can change throughout the day as the National Weather Service offices around the country update and revise their forecasts and maps.

fire weather rapid city
Weather forecast for west South Dakota, northeast Wyoming, and northwest Nebraska, October 31, 2016.

Smokey Bear Jack O’Lanterns, 2016

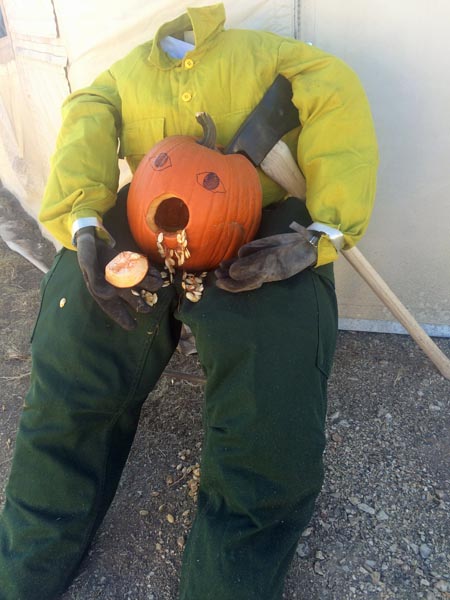
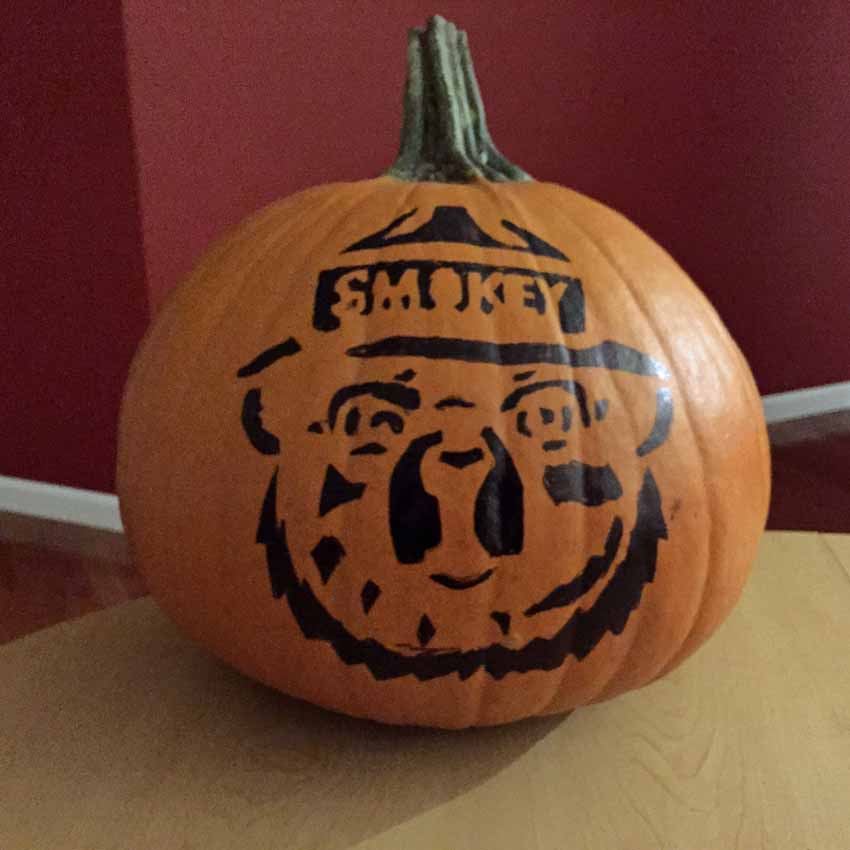
Above: carved by Marta Lujan at the Junkins Fire southwest of Pueblo, Colorado.

Here are photos of Smokey Bear Jack O’Lanterns sent to us by our readers so far this year.

Smokey Bear Jack O'Lantern
Seen at the Junkins Fire southwest of Pueblo, Colorado. Photo by Allen.
Smokey Bear Jack O'Lantern
By Doug Alexander.

Instructions with a template for carving your Smokey Bear Jack O’Lantern.

Thanks and a tip of the hat go out to Allen and Doug.

Rancher says sky lantern caused death of a cow

Sky lantern
Sky lanterns. This photo found on the site of a company that sells the dangerous devices appears to show four of them in the background that have ignited the paper or plastic balloon and are raining down burning debris.

A rancher in the United Kingdom is blaming the death of one of his cows on a sky lantern that landed on his property. These devices are small hot air balloons lofted into the air by fuel burning at the base.

Below is an excerpt from an article at Farmers Weekly:

…Last year, David Rowlands of Grange Farm, Mickle Trifford, Chester, experienced the problems of sky lanterns first hand. The Rowlands family lost one of their pedigree Red Poll breeding cows to a sky lantern around bonfire night.

“She started staggering, so we treated her for staggers, but obviously it had no effect.

“The vets assessment was that the oesophagus had been pierced by wire from one of these wretched things, leading to asphyxiation,” Mr Rowlands explained.

“These sky lanterns have either wire or bamboo frames and essentially they’re cannon balls floating.

“Eventually they land and if they land in a field with cattle grazing, the cattle will investigate.

“The animals are inclined to chew things like this, the wire will splinter, penetrating their throats and causing swelling. It leads to asphyxiation, a horrible death taking about 48 hours.”

“How an animal-loving nation can tolerate this sort of risk to cattle and sheep baffles me,” he toldFarmers Weekly.

But Mr Rowlands hopes if more councils ban them it will help as he says he doesn’t think it is deliberate nastiness of the people releasing them, more that they simply don’t understand the risks.

“Our cows don’t think they are worth the risk,” he said…

Sky lanterns are banned in 39 of the states in the U.S.

Why have fires gotten larger in recent decades?

Above: Junkins Fire, southwest of Pueblo, Colorado. Photo provided by the Incident Management Team on October 19, 2016.

There have been many discussions recently on this website, in the scientific community, and in the more public arena about why the number of acres burned in wildfires has been increasing rapidly over the last several decades. From the mid-1980s through 2015 the average number of acres burned has grown from about 2  million acres a year to around 8 million. Some people like to claim that this was caused by climate change, environmentalists preventing timber from being harvested, or other factors. However, to complicate the issue, some data appears to indicate that between 1920 and 1950, 10 million to 50 million acres burned each year.

It is very difficult to say that one factor caused fire occurrence to change. While comparing acres burned in the early part of the 20th century to what we are seeing in recent decades, many variables need to be considered:

–Weather and climate trends. This has been vigorously discussed in many venues.

–The capacity to suppress wildfires. In the first two-thirds of the 20th century the ability of land managers to suppress wildfires was very different from what we have today. Fire engines now carry many times more water, and transportation systems enable quicker initial attack response. Helicopters and air tankers were brought into the equation. Heavy equipment became more prolific and capable. More efficient communication and dispatch systems were created. Fires are detected more quickly. Firefighters are routinely brought in from hundreds or even thousands of miles away.

–The wildland-urban interface is growing. More people are living and recreating where previously there was less human activity. This can increase the number of fire starts, and the endangered structures often have an effect on the priorities of firefighters and where they are deployed, as opposed concentrating forces where they are most likely to contain the fire.

—Changes in how timber is managed and harvested.

–Fire suppression can result in longer fire return intervals and increases in the amount of fuel available for the next fire.

–Fuel treatments: mechanical and prescribed fire.

–Changes in the vegetation: non-native species, insects, disease.

number of fires wildfires

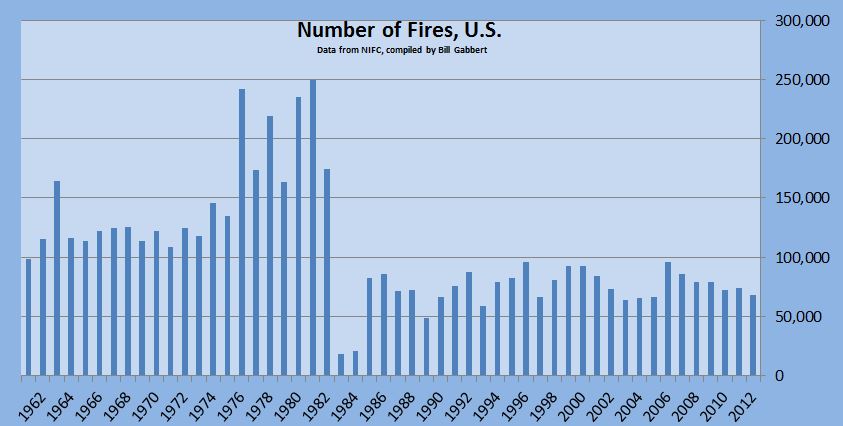
–Accuracy of the fire occurrence data. Can the data for 1920 be compared with the data from 2016? The fire occurrence data at NIFC for 1962 through 2015 shows a huge swing beginning in 1983 and 1984, with the number of fires overnight dropping by about 50%, a trend that continued through 2015. This leads one to lose confidence in the data. One would think that the more modern era, post 1984, would have more accurate information than previous decades.

–Changes in wildfire management policy: full, limited, or no suppression.

Our readers will probably suggest even more factors that affect the number of fires and acres burned.

Considering all of these variables, I am skeptical of reports saying that just one is responsible for changes in the number fires and acres burned.