Live Storms Media shot this video of a wildfire near Blanchard, Oklahoma on January 29, 2016. At about 0:28 you’ll see the fire crossing a road.
Category: Uncategorized
Wildfire potential February through May
On February 1 the Predictive Services section at the National Interagency Fire Center issued their Wildland Fire Potential Outlook for February through May, 2016. The data represents the cumulative forecasts of the ten Geographic Area Predictive Services Units and the National Predictive Services Unit.
If their forecasts are accurate it looks like mild fire potential until April and May when conditions could become more favorable to the spread of fires in the Midwest and south-central Alaska. Hawaii could become busy starting in February or March.
Here are the highlights from their outlook.
February
- Below normal significant fire potential will persist across most of the Southeastern U.S., mid-Atlantic and Puerto Rico as El Nino storm systems continue to bring significant moisture to most of these areas.
- Significant fire potential is normal across the remainder of the U.S., which indicates little significant fire potential.
March
- Below normal significant fire potential will continue across most of the Southeastern U.S., mid-Atlantic and Puerto Rico as El Nino continues to bring significant moisture.
- Above normal fire potential will also develop across the Hawaiian Islands thanks to long term drought.
- Significant fire potential will remain normal across the remainder of the U.S., though potential for pre-greenup fire activity increases through early spring.
April and May
- Above normal significant fire potential will develop across the Great Lakes into the Ohio and Tennessee Valleys where less precipitation has occurred.
- An area of above normal fire potential is also likely to develop across south central Alaska because warm temperatures and rain have limited snowpack.
- Above normal fire potential will continue across the Hawaiian Islands as drought persists. Below normal significant fire potential will continue across most of the Southeastern U.S. and Puerto Rico.
- Significant fire potential continues normal across the remainder of the U.S.
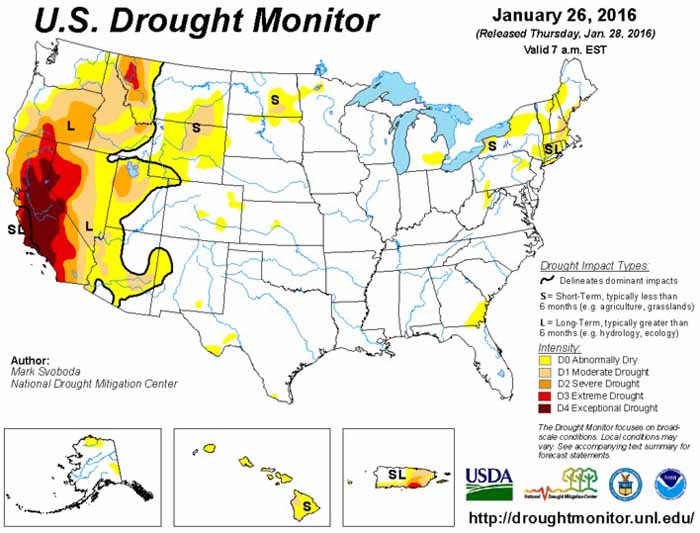
In addition to NIFC’s outlook, here’s bonus #1: the Drought Monitor released January 28, 2016.
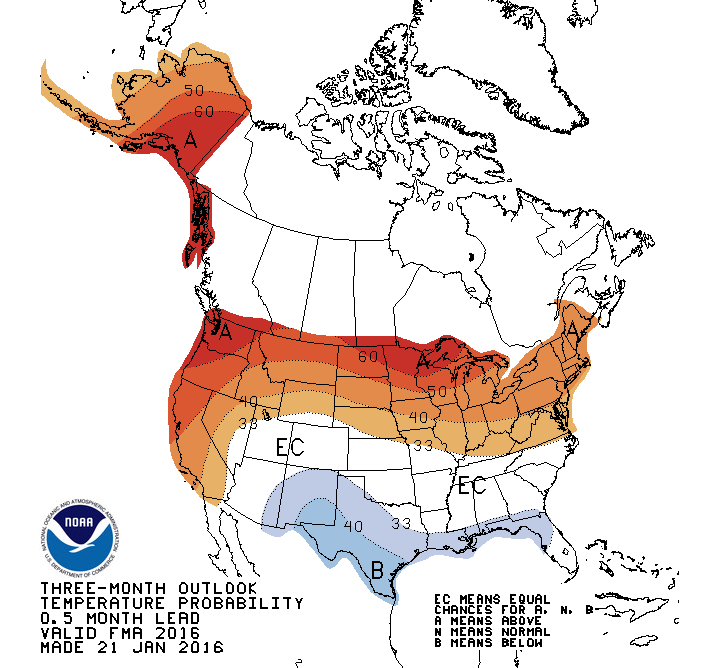
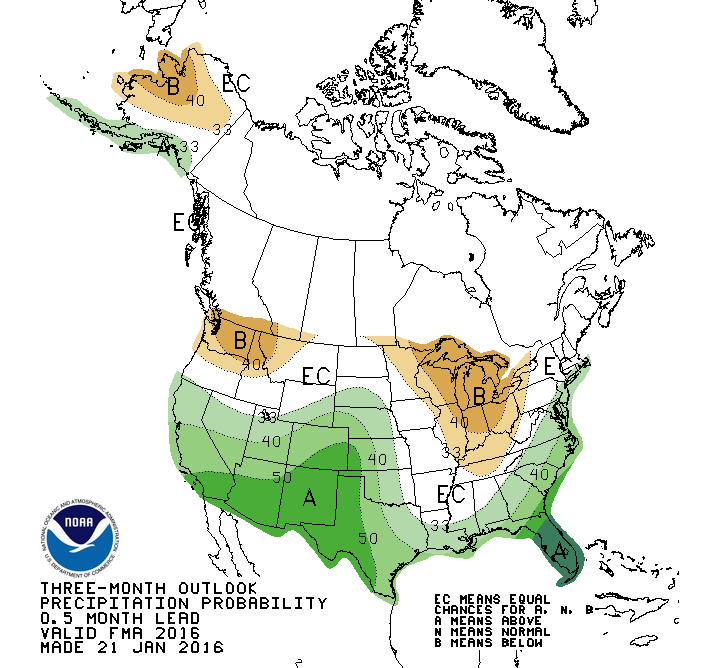
Bonuses #2 and #3, 90-day temperature and precipitation outlooks:
=================
2015 wildfire ignitions in New Mexico were lowest in last 15 years
Image above: number of wildfires and acres burned in New Mexico between 2000 and 2015.
Below is an excerpt from a summary of the 2015 wildfire activity in New Mexico. The complete article posted on the Albuquerque New Mexico NOAA web page, has much, much, MUCH more information, mostly related to weather and how it influenced the occurrence and behavior of fires.
****
Wildfire ignitions across New Mexico were the lowest since a complete record began in 2000. Despite the lower overall numbers there were a few heightened periods of fire activity.
Many areas experienced extensive grass and fine fuel growth during the 2014 growing season while the 2014/15 winter snowpack was sporadic and moisture found within the mountain snowpack was largely below normal. The result was active lowland fire activity during the pre-growing season period of February to mid April. Timely and sometimes extensive wetting events from mid April through the early summer led to a robust green-up and muted fire danger levels. Strong wind events accompanied by low humidity, an unstable atmosphere and an ignition source were also lacking. May through early July generally represents the height of the fire season but just as much fire activity occurred during the pre-greenup and monsoon periods versus the traditional height of the fire season. Fire managers took advantage of the lower fire danger and allowed lightning ignited fires to grow and spread naturally. Sometimes these fires lasted one to three months. Several long-duration managed fires occurred across the state. Notable fires included the Red Canyon (17,843 acres) southwest of Magdalena and the Commissary (2,536 acres) southwest of Las Vegas (Fig. 1). Several more occurred across the Gila region – the most notable was the Moore Fire which burned 3,670 acres. In some cases, incident management teams were ordered to manage the larger fires.
Despite a robust monsoon across the majority of the state, a few dry pockets developed. Large wildfires during the monsoon season are generally rare but on occasion weather, fuel and an ignition source align. Two such examples occurred during 2015. The Fort Craig Fire, along the Rio Grande south of Socorro, was caused by a human source on July 26th and burned nearly 700 acres before being put out ten days later. The Navajo River Fire near Dulce started on August 18th and burned nearly 1400 acres in almost one month’s time.
Prescribed burn activity during the fall period was sporadic due to a few extensive wetting events. There were a few active periods when fire managers could take advantage of the proper alignment of ventilation and dried fuels. The growing season ended later than normal with some lowland areas containing live fuel into early November. The later fall may have also impacted some of the larger broadcast burns due to the green fuel. December ended with mainly pile burns, although a few broadcast grass burns were conducted across the eastern plains before significant snow impacted the area. Graphs found in Figures 2 and 3 show yearly acreage and wildfire ignition trends. Acreage and ignition values for 2015 place the year among the lowest since 2000.
Are there 4 or 5 common denominators of fire behavior on fatal fires?
Our article about adding to the list of common denominators of fatal fires led someone to ask in a comment, “When and why was Wilson`s 5th Common Denominator dropped ?”
In 1976 four firefighters were entrapped on the Battlement Creek Fire, killing three near what is now Parachute, Colorado. Following the tragedy, Carl C. Wilson, who at one time was the Chief of Forest Fire Research at the U.S. Forest Service’s Pacific Southwest Forest and Range Experiment Station, published a paper titled Fatal and Near-Fatal Forest Fires: The Common Denominators.
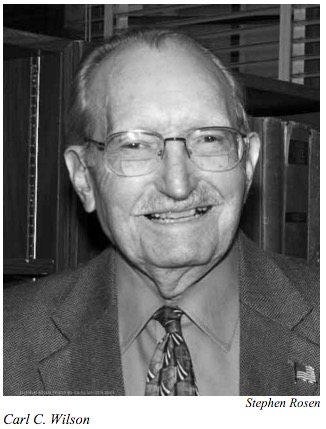 In developing his paper, Mr. Wilson studied 67 fires that occurred during the 61-year period from 1926 to 1976 on which a total of 222 firefighters were killed from “fire-induced injuries”. He also evaluated 31 other “near-fatal” fires, searching for common themes or causes of the deaths in all of the fires. His results were considered ground-breaking. Since then his lists of Common Denominators have been republished, quoted in fatality reports, and included in many standard publications that are very familiar to firefighters.
When we listed his Common Denominators in the January 29 article we used the four that are seen in all of the recent and semi-recent publications that we looked at, including the last paper version of the Fireline Handbook (2004), the 2014 Incident Response Pocket Guide, and the report authored by Dick Mangan, Wildland Firefighter Fatalities in the United States: 1990-2006. The only revision of the Fireline Handbook since 2004 was completed in 2013 and was renamed Wildland Fire Incident Management Field Guide (PMS 210). It does not include the Common Denominators. The 2004 and 2006 editions of the Incident Response Pocket Guide also include the four-item list.
After a great deal of searching we found that there is another list of Common Denominators attributed to Mr. Wilson that has similar but different wording, and has five instead of four. The five-item list was in a 2011 paper by by Martin E. Alexander and Miguel G. Cruz and also in the 1998 version of the Fireline Handbook.
Finally we found a copy of Mr. Wilson’s paper, Fatal and Near-Fatal Forest Fires: The Common Denominators, that was published in 1977 in The International Fire Chief. It has two different lists.
The first, the five-item list, is printed on the first page just below the heading “Common Denominators of Fatal Fires”. Here is the text just below that heading:
“Based on personal knowledge and information obtained from reports and reviewers, the following generalizations can be made about the fatal fires in Tables 1 and 2 [tables 1 &b 2 are fatal fires]:
- Most of the incidents occurred on relatively small fires or isolated sectors of larger fires.
- Most of the fires were innocent in appearance prior to the “flare-ups” or “blow-ups”. In some cases, the fatalities occurred in the mop-up stage.
- Flare-ups occurred in deceptively light fuels.
- Fires ran uphill in chimneys, gullies, or on steep slopes.
- Suppression tools, such as helicopters or air tankers, can adversely modify fire behavior. (Helicopter and air tanker vortices have been known to cause flare-ups.)”
A key to that list is that it only applies to the 67 fatal fires he studied, and not the 31 that were near-fatal.
Toward the end of the paper in the “Conclusions” section, Mr. Wilson wrote:
“There are four major common denominators of fire behavior on fatal and near-fatal fires. Such fires often occur:
- On relatively small fires or deceptively quiet sectors of large fires.
- In relatively light fuels, such as grass, herbs, and light brush.
- When there is an unexpected shift in wind direction or in wind speed.
- When fire responds to topographic conditions and runs uphill.”
We’re not sure why Mr. Wilson broke down the common denominators into fatal and near-fatal fires. I don’t know that it adds value, but can, and has, produced a little confusion when two different versions of the lists are floating around.
Fires break out in Texas and Oklahoma
On the above photo the red squares indicate heat from a wildfire detected by a satellite at 1:39 p.m. CST, January 30, 2016. At that time the fire was two to three miles south of Eula, Texas.
Strong winds and low relative humidities have promoted the growth of several large wildfires in Texas and Oklahoma. One of the blazes causing evacuations, the High Line Fire, is about 12 miles southeast of Abiline, Texas, north of highway 36 and two to three miles south of Eula.
The National Weather Service announced at about 6 p.m. on Saturday that an evacuation has been requested for the Eula area.
Several structures have already caught fire. Residents are urged to evacuate to the north toward Interstate 20. Evacuation shelters have also been set up at the Eula High School, and the First Baptist Church in Clyde. The Red Cross will be on scene at these locations after 6 p.m.
A spokesperson from the Callahan County Sheriff’s Office said the suspected cause is a power line.
Here is the evacuation area for the wildfire near Eula. #txwx #Abilene pic.twitter.com/bwUtMEshOX
— NWS San Angelo (@NWSSanAngelo) January 30, 2016
Residents in Eula now being evacuated. All surrounding FD called in to help including AFD. @KTABTV pic.twitter.com/YaAHHXPSiY
— Stacie Wirmel (@StacieWirmelTV) January 30, 2016
High Line Fire update: 120 acres and 25% contained. Residents in unaffected areas allowed to return per report #txfire #txwx
— TXA&M Forest Service (@AllHazardsTFS) January 31, 2016
Portions of west Texas and Oklahoma are under a wildfire Red Flag Warning.
A fire 20 to 25 miles south of Oklahoma City, southwest of Norman between Blanchard and Goldsby is also causing problems. It put up a large amount of smoke that was detected on weather radar, which is represented by the color blue on the map below.
Quite the smoke plume visible on radar. #okwx #wildfire pic.twitter.com/CpwvDuQqyL
— Robert MacDonald (@Rmacd24) January 30, 2016
Bob Mills SkyNews 9 is flying over a large grass fire between Blanchard, Goldsby. Stay with https://t.co/448iqtN1uI. pic.twitter.com/18b95e8o4X
— News 9 (@NEWS9) January 30, 2016
Firefighters Battle Large Grass Fire Between Blanchard, Goldsby https://t.co/AmLsK8NlMf #News9 pic.twitter.com/U2O83WeYBQ
— News 9 (@NEWS9) January 30, 2016
Are lessons actually learned?
A valuable lesson to all of us. #leadership #wildfires pic.twitter.com/kbPdq6DO2H
— Greater Overberg FPA (@OverbergFPA) January 30, 2016
The Greater Overberg Fire Protection Association in South Africa is an amalgamation of smaller FPA’s. Their purpose is to prevent and control wildfires.
UPDATE February 1, 2016: we put the tweet with the image on the Wildfire Today Facebook page, and here is a portion of the response:
