Trinidad firefighter dies of burns suffered on wildfire

Forest ranger Keith Campbell succumbed to burn injuries sustained while fighting a wildfire along Lady Chancellor Hill, Port-of-Spain, on Friday afternoon, March 25.

Keith Campbell was a forester III in the Forestry Division of the Ministry of Agriculture, Land and Fisheries in Trinidad (map). He became trapped in the fire after a change in wind direction caused the fire to spread rapidly around the firefighters. He died Friday night hours after sustaining third degree burns to 90 percent of his body.

Keith Campbell
Keith Campbell

Mr. Campbell and three other injured firefighters were rushed to the hospital where Mr. Campbell was admitted in critical condition. Of the other three, one has been released from the hospital, a second should be released soon, while the third remains hospitalized after suffering severe burns on his stomach and upper leg

Agriculture Minister Clarence Rambharat announced via social media that Mr. Campbell passed away around 11:45 on Friday night.

Mr. Rambharat said Mr. Campbell had received news of his mother’s death shortly before going to battle the blaze on Friday, but had decided to finish work with his team before going home.

Below are excerpts from an article at TriniBuzz:

…Co-worker Kishan Ramcharan, a Forester I, who worked with Campbell in the division since 2003, described the event as “a complete horror.”

He said Campbell remained in the raging fire for close to 30 minutes as he and other workers looked on in tears, unable to help.

Ramcharan said, “I never experienced anything so devastating and terrifying in my life.” He said Campbell was well-experienced in fighting fires and had a wealth of knowledge of fires habits and how fires operated in specific types of terrains.

He said, Keith was more or less on supervision duties but “everyone lends a helping hand in trying to suppress fires.” They arrived on the scene around 1 pm and conducted a fire assessment but decided it was best to wait on the Fire Service.

On realizing the fire had somewhat cooled down, they ventured in “since nothing was burning as much.” It was Campbell who went in first, equipped with full safety gear and a backpack water pump. Ramcharan said he then went in with his fire rake which Campbell advised him to use. Campbell was about 100 meters away and in his sight. Bain was also inside the forest. But as fate would have it, the winds intensified and it was suddenly “a furnace of fire blazing.”

Ramcharan said, “From a distance, the fire was raging from the valley and our drivers on the hills started screaming, get out! get out!”

He used the fire rake to pull himself out of the precipice and when he got to the top, he saw Bain badly burnt and screamed out for Campbell who was trapped. Satram then arrived on the scene and was joined by Carrington and Duprey who attempted to head down and await rescue from the Fire Service and ambulance who arrived ten minutes later.

Ramcharan said, “I was in a state of shock and disbelief. When they finally got to Campbell and I saw him, he was moving his head just a bit.”

He said Campbell was a dynamic human being with a range of skills and one of the best officers he had worked with.

Our sincere condolences go out to the friends, co-workers, and family of Mr. Campbell. And we hope for a speedy recovery for the three injured firefighters.

California inmate firefighter dies of injuries suffered on wildfire near Malibu

Shawna Lynn Jones suffered major head injuries after being struck by a rolling boulder.

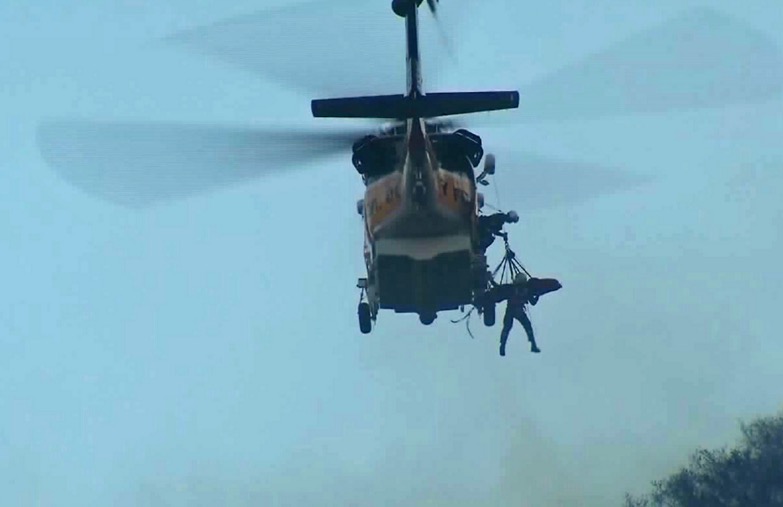
Injured inmate hoist helicopter
The inmate firefighter was airlifted after being injured near Malibu on Feb. 25, 2016. (Credit: KTLA)
The California inmate firefighter that was injured February 25 on the Mulholland Fire near Malibu has died, the California Department of Corrections and Rehabilitation said Friday.

In the early hours of Thursday morning while fighting a wildfire as part of a hand crew, Shawna Lynn Jones, 22, was struck by a boulder that rolled down a hill. She was airlifted to UCLA Medical Center where she was treated for major head injuries. Ms. Jones was removed from life support after her organs were donated, in keeping with her family’s wishes.

Ms. Jones was a Los Angeles County jail inmate who had joined CDCR’s firefighting program in August 2015 and was assigned to the Malibu Camp, which is operated jointly with the Los Angeles County Fire Department. Malibu is one of three camps that house a total of 195 female firefighters.

According to the CDCR Ms. Jones is the third inmate firefighter to die on a wildfire since the camp program began in 1943. Female inmates were incorporated into the firefighting program in 1983.

The Mulholland Fire burned about 10 acres and was contained Thursday night.

Our sincere condolences go out to the friends and family of Ms. Jones.

Another view of our firefighter fatalities graphic

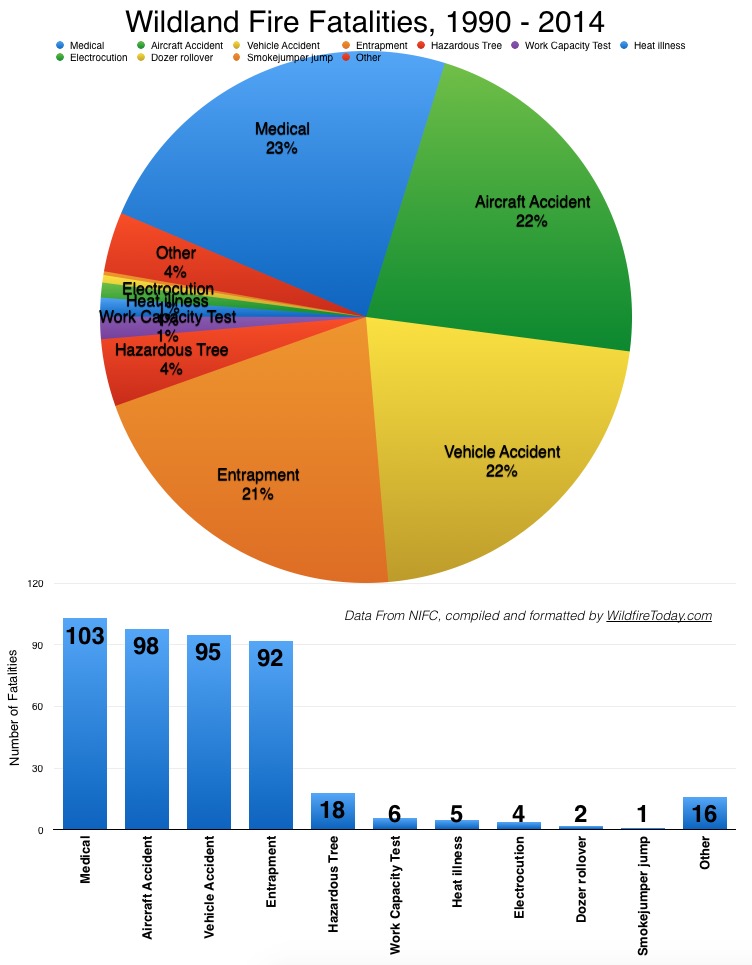
When we published our report on the number wildland firefighter fatalities on January 19, we didn’t include the percentages for each category because the numbers got cluttered among the smaller sections on the pie chart. But in order to discuss it, the percentages are helpful, so in spite of the clutter, we revised the graphic — above — as well as the one in the earlier article.

In text form, here are the percentages for general classifications of fatalities from 1990 through 2014:

  1. 23%, Medical
  2. 22%, Aircraft accident
  3. 22%, Vehicle accident
  4. 21%, Entrapment
  5. 4%, Hazardous tree
  6. 1%, Work Capacity Test
  7. 1%, Heat illness
  8. 1%, Electrocution
  9. Less than 1%: Dozer rollover and Smokejumper jump
  10. 4%, Other

Related:

How do we reduce the number of Fatalities?
Wildfire fatality trends.

Entrapments is the fourth leading cause of wildland firefighter fatalities

Wildland firefighter fatalities 1990-2014For the last several days we have been writing about fatalities on wildland fires —  the annual numbers and trends going back to 1910 and some thoughts about how to reduce the number of entrapments (also known as burnovers). Often when we think about these accidents, what automatically comes to mind are the entrapments. When multiple firefighters are killed at the same time it can be etched into our memory banks to a greater extent than when one person is killed in a vehicle rollover or is hit by a falling tree. Much of the nation mourned when 19 members of the Granite Mountain Hotshots were overrun and killed by the Yarnell Hill Fire in Arizona in 2013. A fatal heart attack on a fire does not receive nearly as much attention.

When we discuss ways to decrease deaths on fires, for some of us our first thoughts are how to prevent entrapments, myself included. One reason is that it can seem they are preventable. Someone made a decision to be in a certain location at a specific time, and it’s easy to think that if only a different decision had been made those people would still be alive. Of course it is not that simple. Perfect 20/20 hindsight is tempting for the Monday Morning Incident Commander. Who knows — if they had been there with access to the same information they may have made the same series of decisions.

An analysis of the data provided by NIFC for the 440 fatalities from 1990 through 2014 shows that entrapments are the fourth leading cause of fatalities. The top four categories which account for 88 percent are, in decreasing order, medical issues, aircraft accidents, vehicle accidents, and entrapments. The numbers for those four are remarkably similar, ranging from 23 to 21 percent of the total. Number five is hazardous trees at 4 percent followed by the Work Capacity Test, heat illness, and electrocution, all at around 1 percent. A bunch of miscellaneous causes adds up to 4 percent.

NIFC’s data used to separate air tanker crashes from accidents involving other types of aircraft such as lead planes and helicopters. But in recent years they began lumping them all into an “aircraft accident” category, so it is no longer possible to study them separately. This is unfortunate, since the missions are completely different and involve very dissimilar personnel, conflating firefighters who are passengers in the same category as air tankers having one- to seven-person crews — from Single Engine Air Tankers to military MAFFS air tankers.

The bottom line, at least for this quick look at the numbers, is that in addition to trying to mitigate the number of entrapments, we should be spending at least as much time and effort to reduce the numbers of wildland firefighters who die from medical issues and accidents in vehicles and aircraft.

How do we reduce the number of firefighter fatalities?

House in the Eiler Fire. Photo by Bill Gabbert.
David Shepard’s house survived the Eiler Fire, 40 air miles east of Redding, California. Photo by Bill Gabbert, August 6, 2014.

Our piece about trends in wildland firefighter fatalities generated discussion of what the data meant and the fact that there was a great deal of variation from year to year. I wrote a comment below the article that grew larger than I originally expected. Here it is:

****

With an average of 17 fatalities over the last 25 years the annual numbers will never be smooth or without spikes. If there were more than 30,000 deaths each year, like with motor vehicles and firearms, there would be less relative variation from year to year and it would be much easier to see a trend. The wildfire environment is dynamic and volatile, but human factors may be what most influences the number of fatalities, and that is difficult to measure or predict.

We have seen some interesting discussion, on this article and others, about how to reduce the fatality rate. A large percentage of the fatalities on wildfires are caused by medical issues or accidents in vehicles and helicopters. For example in 2014 there were 10 deaths on fires, but none involved burnovers. But having said that, off the top of my head, here are a few areas that need to be emphasized in order to reduce the number of burnover fatalities:

  • Realize that firefighter safety is far more important than protecting structures or vegetation. It’s hard to step back and watch homes burn, but it’s far more painful to watch a funeral.
  • Increase the use of simulation tools such as sand tables and computers to train leaders. Try to make it as realistic as possible, but don’t keep throwing problems at the trainee until they fail. Point out mistakes, but the simulation director needs to avoid getting on a power trip. This occasionally was a problem when we used a simulator with a bank of overhead projectors and a rear-projection screen, a system that was extremely flexible.
  • Find a way to make crew resource management more effective so that crew members feel empowered. If they see something, SAY something.
  • The first things every firefighter should consider before committing to a fire suppression effort are escape routes and safety zones. After that, anchor, flank, and keep one foot in the black. Then, escapes routes and safety zones, again and again.
  • Utilize existing technology that will enable Division Supervisors, Operations Section Chiefs, and Safety Officers to know in real time, 1) where the fire is, and 2) where the firefighters are. The Holy Grail of Firefighter Safety. When you think about it, it’s crazy that we sometimes send firefighters into a dangerous environment without knowing these two very basic things. Last month Tom Harbour told me that he was very concerned that, for example, someone in Washington would be accessing the data from thousands of miles away and order that a firefighter move 20 feet to the left. That can be managed. Making the information available to supervisors on the ground can save lives.

What are your recommendations?

Wildfire fatality trends

Last week Secretary of Agriculture Tom Vilsack reported that 13 wildland firefighters lost their lives in the line of duty in 2015. That was an increase from 2014 when there were 10 fatalities, and was about a third of the 34 that were killed in 2013 — that year included the deaths of 19 members of the Granite Mountain Hotshots near Yarnell, Arizona.

The National Interagency Fire Center has statistics about line of duty deaths going back to 1910. During that time, according to their numbers, 1,099 firefighters died.

wildland firefighter Fatalities 1960-2015

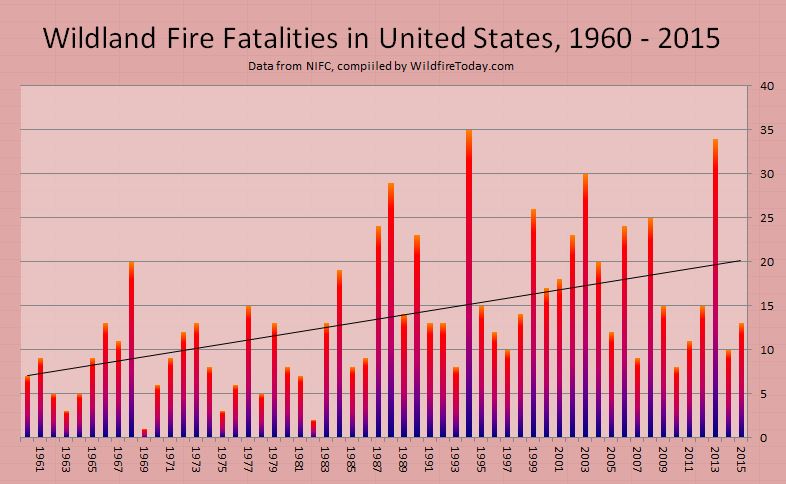
In looking at the 105 years of NIFC data there appears to be an increasing trend. The figures below are the average number of fatalities each year for the indicated time periods:

1910-2015: 10.5
1910-1959: 6.9
1960-1989: 10.2
1990-2015: 17.0

One likely explanation for the apparent increase is that 80 to 105 years ago probably not all fatalities were reported or ended up in a centralized data base, especially those that occurred on state or locally protected lands. Even if we only look at the figures since 1960, as in the chart above, it still shows a steep increase over those 55 years.

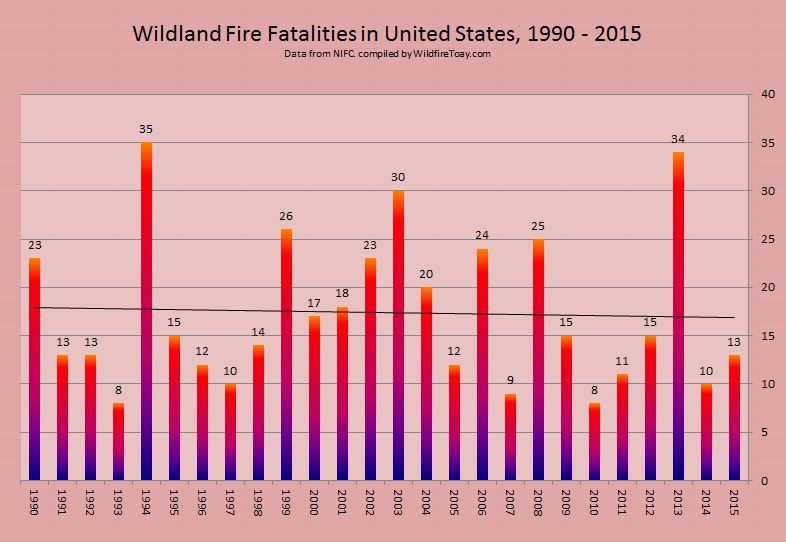
It is possible in the last 25 years the reporting of fatalities and the collection of the data has been somewhat more consistent and complete. The chart below covers that period, from 1990 through 2015, and has a slight downward trend, which would be even more obvious if not for the 19-person crew that passed away in 2013 on the Yarnell Hill Fire.

wildland firefighter Fatalities 1990-2015

I can’t prove that there was under-reporting of wildland firefighter fatalities during most of the 20th century, but if a firefighter was killed on a vegetation fire in Missouri in 1921, I can see how that statistic may not have made it into the data base that is now maintained at NIFC.

So what does all this mean? Individuals can look at the same batch of statistics and develop vastly different interpretations. However, it would not be prudent to assume that the fatality rate almost tripled from the first part of the 105-year period to the last 25 years. There are several ways to analyze data like this. The least complex is to look at the trend of the raw numbers of fatalities year to year. A more complex and meaningful method would be to determine the fatality RATE. For example, the fatalities per million hours spent traveling to and working on fires. That would be impossible to ferret out during most of the last 105 years. But the firefighting agencies should be able to find a way to begin collecting this information, if they don’t have it already.

If the fatality and serious injury rates were calculated over a multi-year period, it should illustrate the effectiveness of a risk management program. Otherwise, the simple number of deaths each year might be affected to an unknown degree by the number of acres burned. Other factors could also affect the numbers, such as fire intensity influenced by fuel treatment programs, fire history, drought, climate change, or arson.

Should firefighting agencies have specific goals about serious injuries and fatalities? Is there an acceptable number? Is 5 a year too many? Is 15 too many? Is it stupid to have a goal of zero fatalities —  or any number?

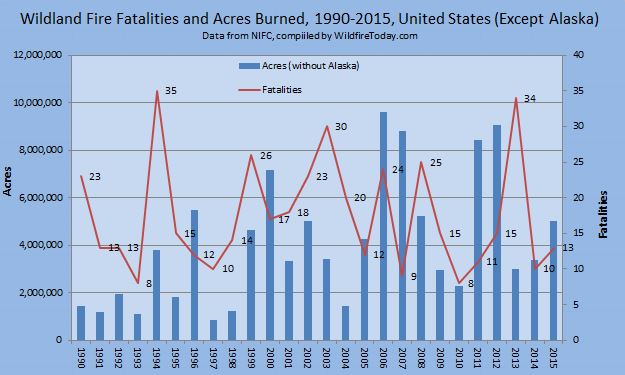
The chart below superimposes the number of fatalities over the acres burned in the United States from 1990 through 2015, but it does not include Alaska since many fires there are not suppressed, or they are only suppressed in areas where they threaten structures or people. In 2015 more acres burned in Alaska than all of the other states combined.

wildfire Fatalities and acres 1990-2015

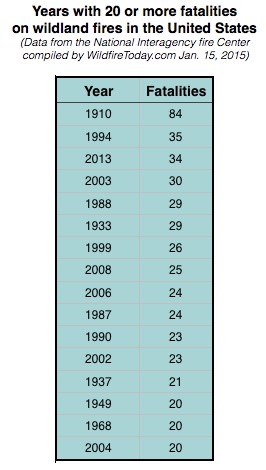
years with 20 or more wildland firefighter fatalities

****

UPDATED January 17, 2016

One of our loyal readers, Bean, has been thinking about this issue and figured that since the amount of firefighters’ exposure to risk is necessary in order to calculate trends, perhaps parameters other than acres burned could be correlated with the number of fatalities. Data that is publicly available as far back as 1990 or 1994 includes mobilizations of incident management teams, crews, overhead, helicopters, air tankers, air attack ships, infrared aircraft, MAFFS air tankers, caterers, military firefighters, and shower units. I considered all of those and concluded that the number of crews mobilized would come the closest to serving as a proxy for accurate data of how many hours all firefighters spent traveling to and working on fires.

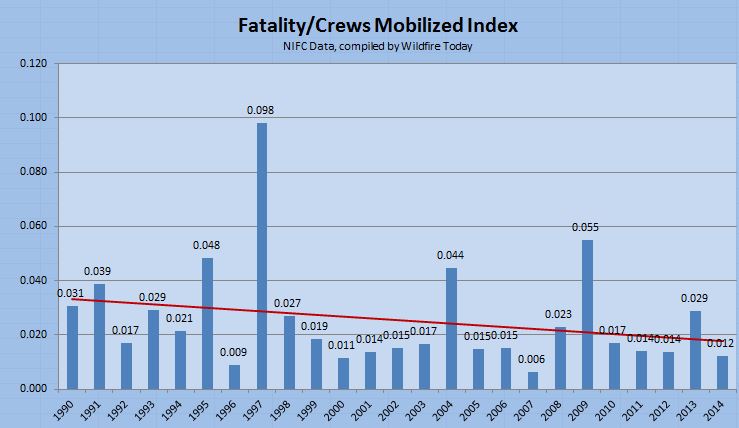
Data for crew mobilizations is available from 1990 through 2014. I divided the number of crews mobilized by the number of fatalities for each year and called this the Fatality/Crews Mobilized Index.

wildfire Fatalities and Crews Mobilized Index 1990-2004

Like the earlier chart comparing fatalities to acres burned, this analysis also shows a decreasing trend in the last 25 years. In a comment posted January 17, Kevin9 said the earlier acres/fatalities analysis is “spiky”.  This newer crews mobilized/fatalities data also has spikes (especially in 1997 and 2009) but not quite to the degree the earlier chart had. During the 25-year period, 1997 had the least number of acres burned and crews mobilized, but still had 10 fatalities. The second lowest number of crews mobilized occurred in 2009 and there were 15 fatalities that year.

As an experiment, knowing that there were mass casualty events in 1994 and 2013 (14 and 19 fatalities respectively), just to see what the effects were, I changed the data in those two years to the average for the last 25 years, which is 17, and there was no major change in the trend line, except it was a little lower across the entire range.

It’s been a long time since I took statistics courses, but here’s what I came up with when analyzing the Fatality/Crews Mobilized Index data:

  • Standard deviation: 0.019
  • Mean: 0.026
  • Coefficient of variation: 0.770
  • Variance: 0.00037