After the atmospheric rivers, a changing outlook

To interpret a wildland fire outlook can be a bit like posting a scenic photo to Instagram. You share the images and phases that capture the moment, with hopes that these will intrigue us into deeper connections to the months ahead.

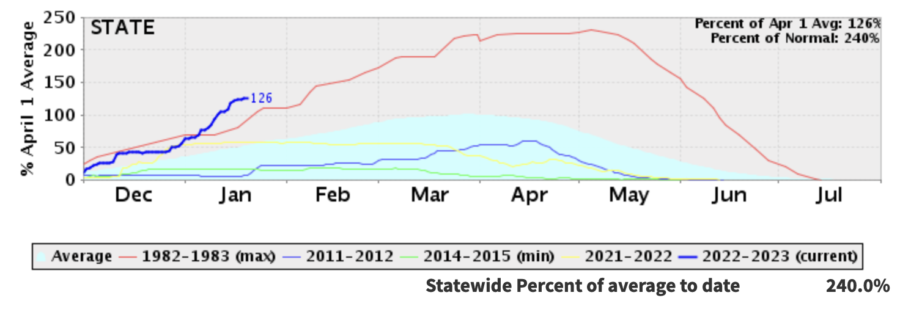
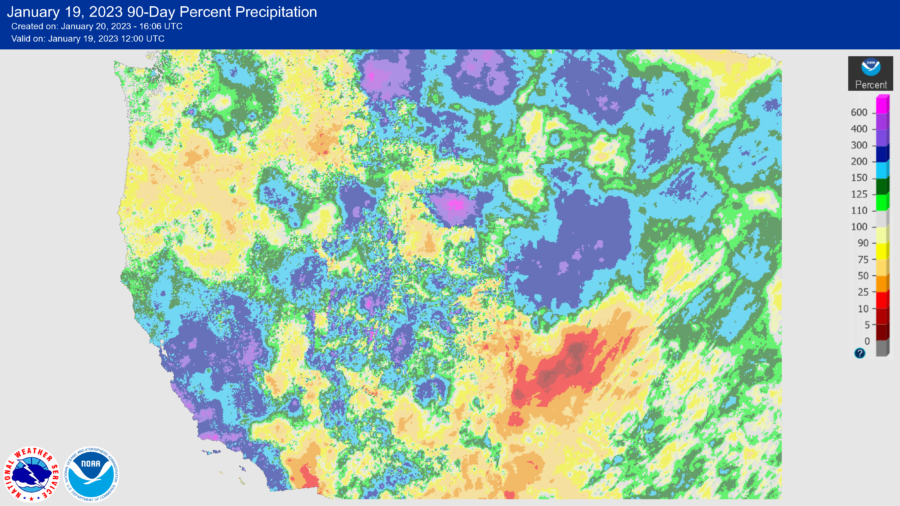
AND THE RAIN AND SNOW FELL … From the latest National Significant Wildland Fire Outlook (for February through May 2013, with hints to the future), one image may lay claim to this month’s Instagram shot. The Total Precipitation Anomaly for January 2023 features a piercing finger of deep-green and blue anomalies from the central California coast eastward to upper Wisconsin – this being the precip falling from “multiple moderate to strong atmospheric rivers,” leading to moisture from 150 to more than 400 percent of normal.

January 2023 Precipitation Anomaly.
January 2023 Precipitation Anomaly. https://www.predictiveservices.nifc.gov/outlooks/precip30day.png.

What this means for fire potential long-term is to be determined. Though this was a wide and significant flow, it was not a universal flood. Wide areas are likely to remain in drought yet many regions, including northern California to Oregon and east into Idaho and Montana, are likely to improve, as depicted by the tan (improvement) and green (out of drought) shading in the U.S. Seasonal Drought Outlook through April.

U.S. Seasonal Drought Outlook through April.
U.S. Seasonal Drought Outlook through April. https://www.cpc.ncep.noaa.gov/products/expert_assessment/season_drought.png.

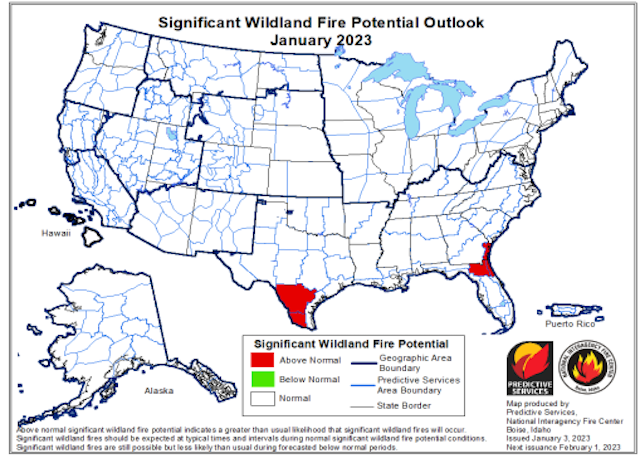
WHAT TO EXPECT: The result of this precip is a fire potential outlook that is nearly Normal by May of 2023, with a slot of Above Normal red from west Texas to central New Mexico and a blob in the Georgia-Florida pinelands.

Significant Wildland Fire Potential Outlook for May 2023.
Significant Wildland Fire Potential Outlook for May 2023. https://www.predictiveservices.nifc.gov/outlooks/month4_outlook.png

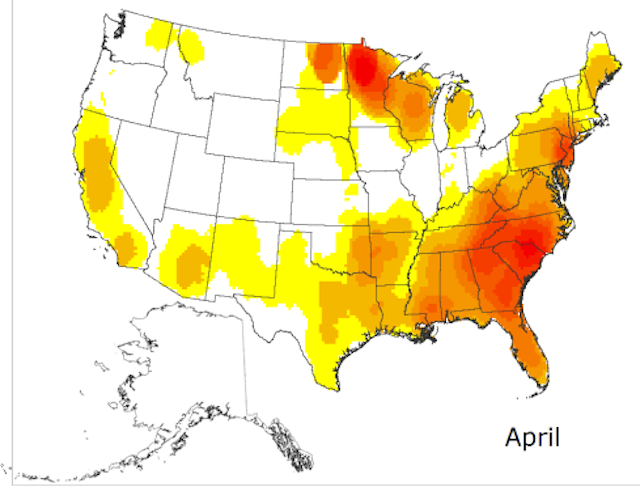
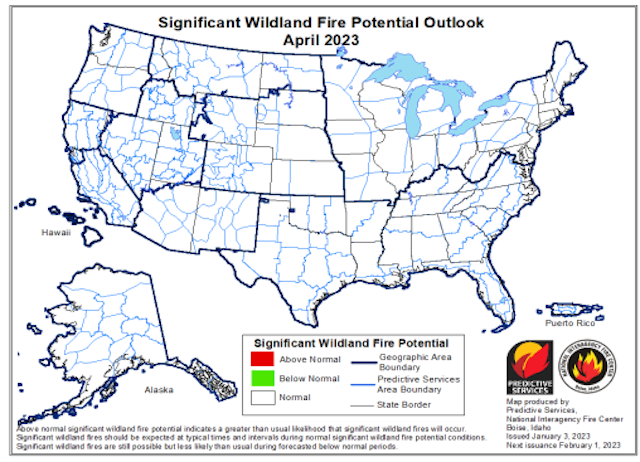
WHAT NORMAL LOOKS LIKE … in a typical season, for March into May, fires (including prescribed fires) may be relatively active on the land, particularly in the Southeast and southern Great Plans into the Trans-Pecos and Rio Grande, as illustrated in this map of normal fire activity for April.

Normal-Fire-Season-Progression-April

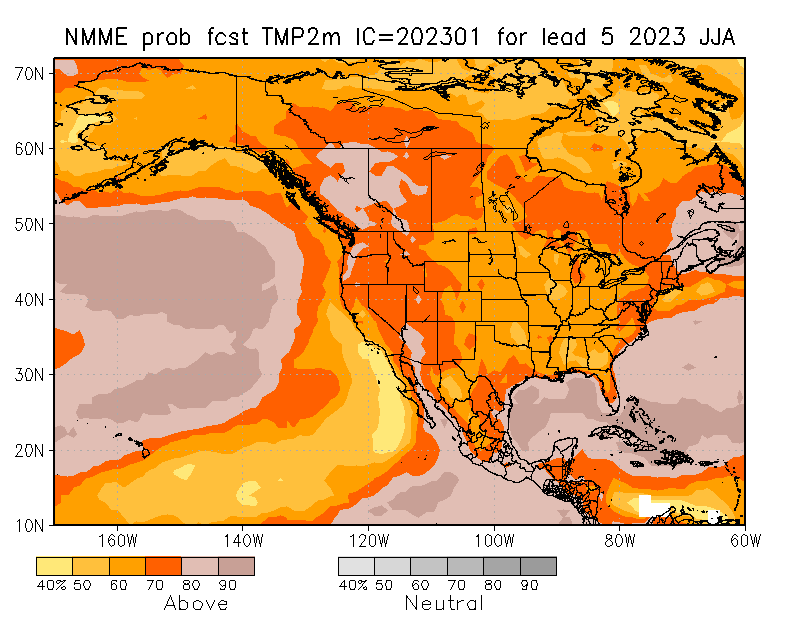
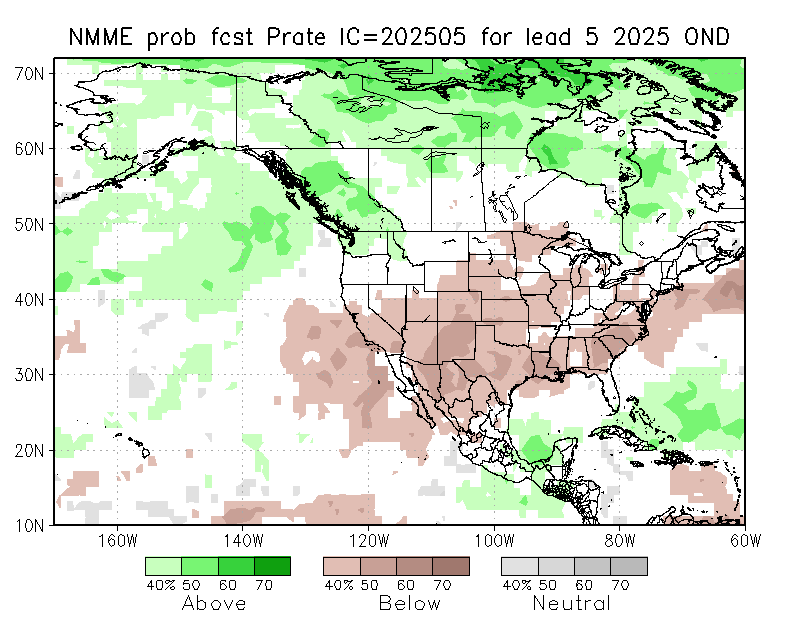
Our tracking with “normal” will be influenced by global transitions as we’re likely leaving a record-long period of La Niña conditions. As the Outlook observes: “The Climate Prediction Center (CPC) is forecasting an 82% chance of neutral El Niño-Southern Oscillation (ENSO) conditions returning in spring. Other teleconnection patterns, such as the Madden-Julian Oscillation, Pacific Decadal Oscillation, Pacific-North American Pattern, and Arctic Oscillation are likely to influence weather and climate during the outlook period.” But we’re not through with the cool-ocean pattern yet: “La Niña is forecast to remain the dominant influence through February.”

So expect some variability to be foretold, as fuels grow into green-up and cure into summer.

For more, see the NIFC Predictive Services’ National Significant Wildland Fire Potential Outlook for February through May 2023.

What a wet West Coast winter foretells for fire season 2023

The above-normal winter precipitation in California and over parts of the American West has already raised the question — even before the floodwaters have receded — of how this winter precip might either dampen the fuel beds or spawn a monster crop of fine fuels come spring and summer of 2023.

There’s a lot of winter and spring to come, and the first-of-the-month fire outlooks are 10 days out, but many are sensing that fire season in wetter locales will begin later. This delay is more likely in California, which is coping with a walloping by deep and repeated atmospheric rivers, resulting in near-record snowpack and flooding that may be familiar historically but not during the most recent drought decades.

Consider the California snowpack as of Jan. 20, 2023. Whether by graph or map, the message is clear: the snowpack is significant and snowmelt periods will likely be extended. Statewide the snowpack is at 126% of the April 1 normal, but 240% for the current water year-to-date.

Calif Statewide Snowpack years 2023-01-20
California Statewide Snowpack as of Jan. 20, 2023. https://cdec.water.ca.gov/snowapp/swcchart.action

With a focus on California’s rapid switch from drought to flood, it’s clearly a banner water year to analyze — which is too painfully clear to the many who are working through a long recovery from flood damages estimated to exceed $1 billion. As CNN reported, at one point an estimated 90% of California’s population was under some form of flood watch, which equates to 10% of the US population.

Per California Water Watch, the state is at 167% of average precipitation for this date, but storms aren’t a universal event. While the map for accumulated water year precipitation beginning Oct. 1 shows higher departure from average over most of the state, the most-intense  “purple” is being collected in the higher elevations in the central and northern mountains, and sopping the lower coastal regions that were hit full-force by the atmospheric rivers.

See California WaterWatch for regular updates.
See California WaterWatch for regular updates: https://cww.water.ca.gov

As damaging as the storms have been for so many communities, much of the West continues to feel the effects of long-term drought. A broader west-wide map of  precipitation of the past three months shows the patchiness of these bomb cyclones.

January 19, 2023 90-Day Percent Precipitation
Precipitation for the past 3 months.

Looking ahead, a range of analysis tools foretell the potential of a warm summer and the likely impacts of long-term drought returning. The five-month lead for June-July-August (JJA), from the North American Multi-Modal Ensemble (or NMME), paints a warm picture for North America, with most of the U.S. West at 70% or higher likelihood for warmer than normal temps. Which will in turn elevate the evaporation potential during growing (and curing) season.

NMME ensemble temperature forecast for JJA 2023.
NMME ensemble temperature forecast for JJA 2023. https://www.cpc.ncep.noaa.gov/products/NMME/prob/images/prob_ensemble_tmp2m_us_season5.png

The same JJA outlook indicates a potential for most of North America to receive normal summer precip (though normal is often quite dry for much of the Western regions), with wetter likelihood for Alaska and drier than normal for western and northern Canada, the Pacific Northwest, the lower Mississippi Valley into Texas and south to Mexico and Central America.

NMME ensemble precipitation for JJA 2023. https://www.cpc.ncep.noaa.gov/products/NMME/prob/images/prob_ensemble_prate_us_season5.png

How these ensemble outlooks play out will depend in part on a projected switch from La Niña to neutral or potentially El Niño conditions. And the impact of the winter’s snowpack will depend on how early and warm the spring temperatures rise. More on that potential when we look at the February outlooks.

Thanks to the Analysts … Many of these resources are digested from the outlooks and links prepared and shared by National and Geographic Area analysts. So a thanks for the work these folks do, season in and season out. This update owes much to the analysts who produced the January outlooks for Northern California and Southern California.

Outlook for January 2023 – normal, with potential for Texas, Florida

It wouldn’t be a new year (or a new month) for US firefighters without the release of the monthly National Significant Wildland Fire Potential Outlook. For January 2023, from winter into spring, the outlook reflects the series of strong winter storms that have crossed the country west to east and a resulting reduction in fire potential. And with La Niña conditions continuing as the dominant weather influence through February, we will likely see a stormy winter and some moderation of drought … though a transition to neutral El Niño-Southern Oscillation (ENSO) conditions are expected to return in spring (with a 71% chance for neutral), when we may see other teleconnection patterns shaping spring and summer. 

For January 2023, significant fire activity is limited to far southern Texas, northeast Florida and southeast Georgia.

Significant Wildland Fire Potential - January 2023.


Significant fire activity for February and March is expected to expand from these areas … but by April, with typical spring green-up expected, the entire US can look for normal fire activity.

Significant Wildland Fire Potential - April 2023.

What is normal for January? While the Outlook doesn’t infer fire size or intensity in these outlook-maps, the monthly fire density maps do convey the expansion of what we often think of as prescribed-fire season — with normal fire activity typically focused in the south and southeast in mid-winter and expanding west and north as we move into April.

Normal Fire Season Progression - January.
Normal Fire Season Progression - April.

Here’s a permalink to the January 2023 Outlook.


Wildfire potential predicted to remain high in California, the Northwest, and Northern Rockies

In August and September, 2021

wildfire potential outlook August

The forecast for wildland fire potential issued August 1 by the National Interagency Fire Center predicts that the Northwest, Northern Rockies, and the mountainous areas of California will have above normal fire potential in August and September. Even into October much of the Northern Rockies, Northern California, and coastal mountains of Southern California will still be above normal.

The data from NIFC shown here represents the cumulative forecasts of the ten Geographic Area Predictive Services Units and the National Predictive Services Unit.

Below:

  • An excerpt from the NIFC narrative report for the next several months;
  • Additional NIFC monthly graphical outlooks;
  • NOAA’s three-month temperature and precipitation forecasts;
  • Drought Monitor;
  • Keetch-Byram Drought Index.

“Climate outlooks indicate warmer than normal conditions are likely for much of the CONUS, especially the West, into fall. The northern Intermountain West is likely to have drier than normal conditions in August, expanding to include most of the West during fall. Near normal precipitation is likely with the monsoon in August, which should continue to alleviate drought. However, drought is likely to expand and intensify across much of the West into fall.

“Much of Southern Area and areas south of the Ohio River are likely to have below normal significant fire potential through September, but much of the Southeast U.S. is forecast to have above normal fire potential in October and November. Normal significant fire potential is forecast for Alaska along with most of Eastern Area.

“Above normal significant fire potential is likely to remain in portions of northern Minnesota into August. Above normal significant fire potential is forecast to continue through September for much of the Northwest, Northern Rockies, and northern portions of the Great Basin and Rocky Mountain Geographic Areas. Most of these areas will return to normal fire potential in October and November. Most mountains and foothills in California are forecast to have above normal potential through September with areas prone to offshore winds likely to retain above normal potential into October and November in southern California. Leeside locations in Hawaii are likely to have above normal significant fire potential into October.”


wildfire potential outlook September

Continue reading “Wildfire potential predicted to remain high in California, the Northwest, and Northern Rockies”

Update on the snow drought

The snow water equivalent is below 50 percent in parts of the southwestern quarter of the U.S.

Snow Drought, April 11, 2021
Snow Drought, April 11, 2021.

I learned years ago that it is folly in February, March, or April to attempt to predict the outcome of the summer/fall wildfire season in the Western United States. If the weather in the summer is relatively cool and wet, the fire season will not be extremely busy.

Having said that, a glance at the snow water equivalent dated April 11 shows that it is far below normal in the Western states except for Washington, Oregon, Montana, and northern Idaho.

It is below 50 percent in some areas of California, Utah, Arizona, South Dakota, and New Mexico. In southeast Arizona it is zero to four percent of average.

Couple that with the higher than average temperatures and lower than average precipitation expected in some of these areas and, dare I say it, if the predictions are correct, there could be more wildfire activity than average in the southwestern one-quarter of the U.S. this year.

The following outlooks were produced about three weeks ago, so they should be taken with a grain of salt.

Precipitation outlook May through July, 2021
Precipitation outlook May through July, 2021.

Precipitation outlook, May through July, 2021
Precipitation outlook, May through July, 2021.

Forecasters expect the West to be warmer and drier than average later in January

The east should be cooler, while the Drought Monitor shows Severe to Exceptional drought in the Four Corners area.

outlook for precipitation January
The outlook for precipitation in the second half of January.

The three to four-week outlook issued January 4 for the second half of January predicts warmer and drier conditions in the Western United States. Areas east of the Rocky Mountains should be cooler. According to the National Weather Service Climate Prediction Center this is tied to tropical teleconnection responses and a building 500-hPa ridge forecast over northwestern North America.

Probably as a result of the partial shutdown of the federal government the Predictive Services section at the National Interagency Fire Center has not issued an updated Wildland Fire Potential Outlook at the beginning of the month as is customary.

outlook for temperature January
The outlook for temperature in the second half of January.

Below is the Drought Monitor released January 3, 2018.

Drought Monitor
The Drought Monitor shows Severe to Exceptional drought in the Four Corners area.

Drought Monitor legend