Wildland fire management in Wyoming

The University of Wyoming has issued a publication about the patterns, influences, and effects of wildland fire in the state.

The University of Wyoming paper covers basic facts about fire, weather, intensity, severity, prescribed burning, as well as fire effects and interactions with soils, plants, livestock, wildlife, and bark beetle outbreaks. The document is 16 pages long with an additional 8 pages of references and a glossary. It was written by Derek Scasta, Assistant Professor and Extension Rangeland Specialist.

A couple of items attracted my attention. One is the graphic at the top of this article, the mean fire return interval for Wyoming. If you’re familiar with the geography of an area, data like this can absorb your interest for a while. The map appears to be a section taken out of the whole country map.

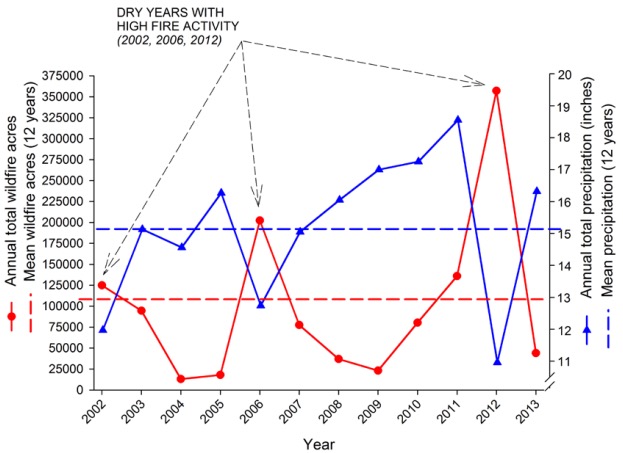
Another topic covered in the publication is the relationship between precipitation and acres burned.

Wyoming precipitation acres burned

The chart above from the paper uses the total Wyoming statewide annual precipitation compared with the total number of acres burned in wildfires each year. We have been thinking that the weather in the summer has a greater effect on acres burned than weather throughout the year. Those weather factors include temperature, relative humidity, wind, and precipitation, and a few others used by the National Fire Danger Rating System. It’s beyond our capacity to analyze all of those, unless we use an index that takes multiple parameters into account, such as the Burning Index or the Energy Release Component.

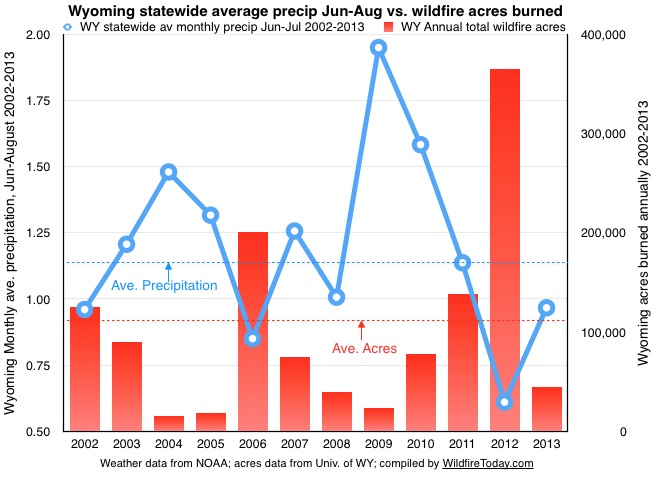
Wyoming precipitation acres burned, WildfireToday

But what we did (immediately above) was to take one weather parameter from the summer and plotted it on a chart similar to the UofW chart– average monthly precipitation each year for June, July, and August. The weather data came from NOAA, and the acres burned was extracted from the University of Wyoming chart.

Included among the disclaimers is that average precipitation across the state does not apply to every square mile. Thunderstorms in the summer could be hammering one area, while a major fire is burning somewhere else. And, using only precipitation does not take into account temperature, relative humidity, and wind, which are all very important.

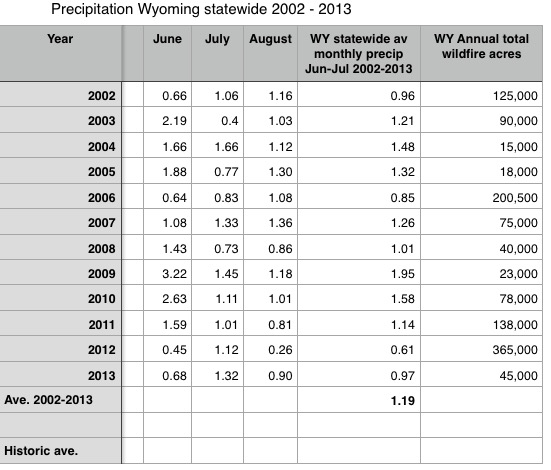
If anyone is interested in analyzing the Wyoming fire occurrence data using another weather factor or NFDRS Index (from the summer months), below are the numbers I used. Or, if you’d like to look at another state or geographic area, that would be fine. It’s important to analyze the acres burned and the weather observations for a large area in order get a sample of sufficient size to make it statistically significant. For example, use 15 to 20 years of information from a large national forest with multiple weather stations to reduce the data-skewing impact of a gully-washer thunderstorm at one location.

wyoming acres burned precipitation

Winter weather — precursor to the 2016 wildfire season

Above: precipitation last 90 days, percent departure from normal. Click to see larger version.

There are three main factors that influence the behavior of a wildland fire: weather, fuel, and topography. Thankfully topography does not change from year to year in any significant manner. If it did, the job of wildland firefighters would be incredibly more difficult. Weather and fuels (vegetation) do change, not only from year to year from but from day to day — even hour to hour as the fine fuels absorb moisture out of the air. The weather is infinitely variable and has a huge effect on fires and fuels. This turns many firefighters into amateur meteorologists in an effort to master their craft and keep themselves and their colleagues safe.

Often at this time of the year as preparations are under way for the western wildfire season we look back at the winter weather.

There is little doubt that precipitation and temperature over the last 90 days will have an effect on summer fires. Many media outlets find it hard to resist the temptation on a slow news day to exaggerate how, for example, a dry winter might lead to disastrous wildfires. But the fact is summer weather has a greater effect on the number of acres burned than the conditions six months before. Hot, dry, and windy conditions in the summer are usually associated with a busy fire season.

Precipitation

As you can see in the map above, large sections of the forested areas in the northwest had above normal precipitation over the last 90 days. There are regions in Montana, Washington, and Oregon that had 150 to 200 percent of average. However, much of the southwest, southern California, and areas within the states of Colorado, Utah, Nevada, and Wyoming were below normal.

CA reservoir levels 3-14-2016
Water levels at selected California reservoirs, March 14, 2016. California Dept. of Water Resources.

Heavy rain this winter in northern California, 110 to 150 percent of normal, has been adding a lot of water to the reservoirs that have been in pretty bad shape for the last couple of years. The two largest reservoirs in the state, Lake Shasta and Lake Oroville, have both refilled to levels above the historical average and are 81 and 73 percent full. Most of the lakes farther south have some serious catching up to do.

Snow Cover

Snow Cover 3-15-2016
Snow cover on March 15, 2016. Rutgers.

———————-

Snowpack, March 1, 2016

Poll: which fire weather mapping product do you prefer?

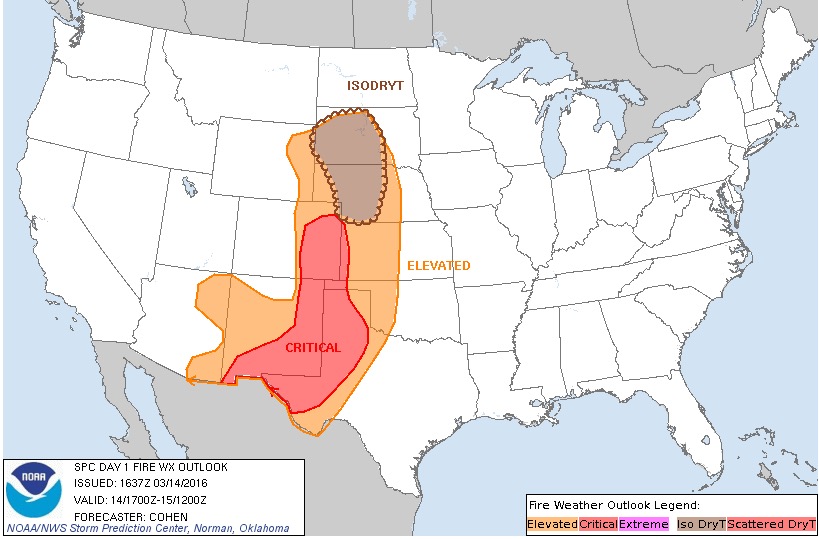
Fire weather 3-14-2016

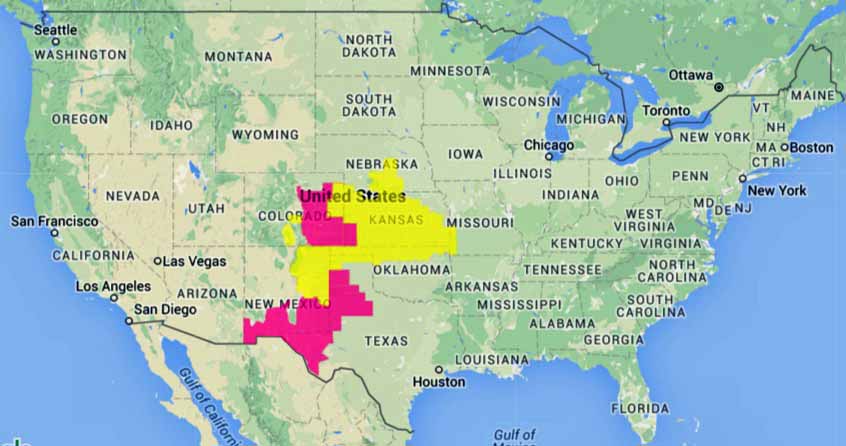
Today we have two very different fire weather mapping products. Both provide information about the predicted fire weather for today, March 14.

The map above is produced by the Storm Prediction Center in Norman, Oklahoma. It does not display Red Flag Warnings or Fire Weather Watches. Instead, it designates areas with “critical” and “elevated” fire weather forecasts. It also shows an area in South Dakota and Nebraska that has the possibility of “Iso DryT” — isolated dry thunderstorms. We checked the more detailed text fire weather forecasts for the Iso DryT areas and only found one that briefly mentioned that issue.

Below is the type of map that we have been using for years on Wildfire Today. It only provides information about Red Flag Warnings or Fire Weather Watches — which is good to know. Especially if you want to supply information to the public using just a few words that can convey an important message.

Both maps can be found HERE.

wildfire Red Flags 3-14-2016

Which map do you prefer us to use on Wildfire Today? Let us know by choosing an answer in the poll below — then click on the hard to see “vote” box below.

Which fire weather map do you prefer for Wildfire Today?

View Results

Loading ... Loading ...

Wildfire potential March through June, 2016

On March 1 the Predictive Services section at the National Interagency Fire Center issued their Wildland Fire Potential Outlook for March through June, 2016. The data represents the cumulative forecasts of the ten Geographic Area Predictive Services Units and the National Predictive Services Unit.

If their predictions are correct, some areas in the eastern U.S., especially the midwest, will experience above normal activity off and on through June.

Here are the highlights from their outlook. Click on the images to see larger versions.

March

march wildfire outlook

  • Above normal significant fire potential from the southern Plains to the Great Lakes due to dry conditions, especially during windy periods.
  • Above normal fire potential will continue across the Hawaiian Islands associated with long term drought.
  • Below normal significant fire potential will persist across most of the Gulf and East Coasts and most of Puerto Rico.
  • Significant fire potential is normal across the remainder of the U.S., which indicates little significant fire potential.

April

April wildfire outlook

  • Above normal significant fire potential will expand across the northern Mississippi Valley and Great Lakes states with increasing dryness in these areas.
  • Above normal fire potential will continue across the Hawaiian Islands and develop over south central Alaska.
  • Below normal significant fire potential will decrease to just coastal areas of the central Gulf and Atlantic coasts and Puerto Rico.
  • Significant fire potential will remain normal across the remainder of the U.S., though potential for pre-greenup fire activity increases through early spring.

May through June

may june wildfire outlook

  • Above normal significant fire potential will develop in the Southwest and continue across Tennessee, Kentucky, Hawaii and Alaska.
  • Fire potential remains below normal along the MidAtlantic coast and Puerto Rico, and drops to below normal in Louisiana and southeastern Texas.

Very strong winds in the greater Black Hills area

Image above from the National Weather Service in Rapid City, @NWSRapidCity

It was very, very windy in northeast Wyoming and western South Dakota from Thursday afternoon through the early morning hours on Friday. The strongest gust measured was 83 mph near Buffalo in northwest South Dakota.

Sustained winds or frequent gusts of 74 mph or above qualify as “hurricane force”. In the chart above, 11 areas had gusts of 74 or more.

The National Weather Service has issued Red Flag Warnings for areas in Nebraska, Kansas, and Missouri today.

As of 1:30 p.m. MST on Friday, we have heard no reports of large wildfires in the last two days in the greater Black Hills region. There were a few of less than three acres. The strong winds are continuing Friday afternoon, as you can see in the map below, showing wind gusts in the greater Black Hills area in the hour ending at 1:44 p.m. MST February 19, 2016.

Wind Gusts Black Hills 144 pm CST 2-19-2016
Wind Gusts in western South Dakota and northeast Wyoming during the hour ending at 1:44 p.m. MST February 19, 2016.

California reservoirs still suffering from drought

Above: the status of the large reservoirs in California as of February 16, 2016, showing the current water levels and the historic average for the date. California Department of Water Resources.

In spite of significant rain over parts of California over the last six months all but one of 12 large reservoirs in the state are still storing water at levels below the historic average for the date. Folsom Lake has 117 percent of average while the other 11 have from 30 to 80 percent.

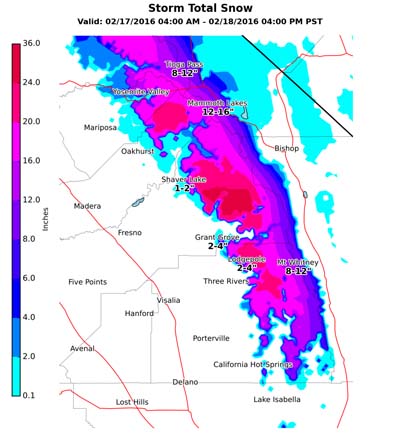
Precipitation predicted for Thursday in the Sierra Nevada Mountains should help a little, with some areas above 7,000 feet receiving a foot or more of snow.

snow Sierras 2-18-2016
Snow prediction Sierra Nevada Mountains, 0400 Feb. 17 through 1600 Feb. 18.

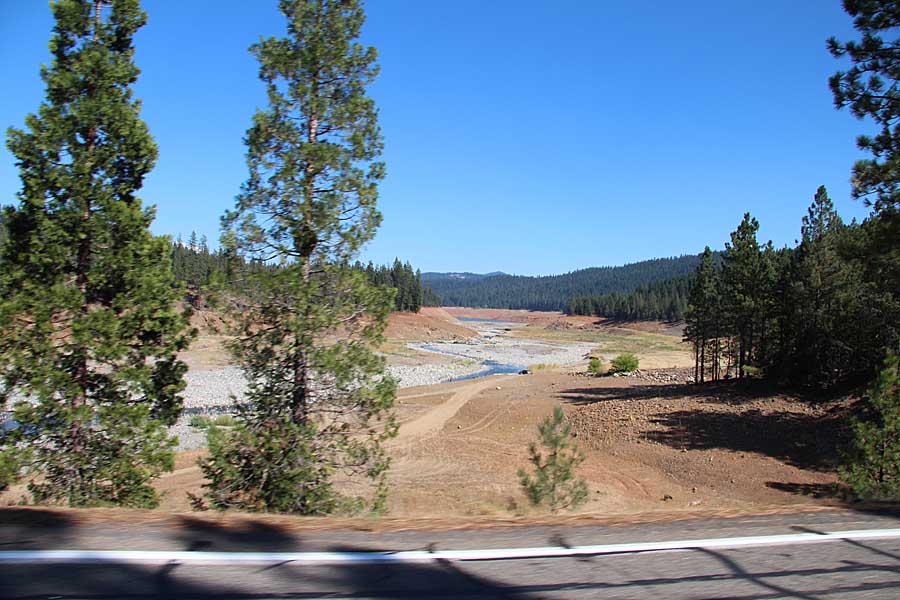
The photo below shows the extreme northern end of Trinity Lake on August 9, 2014 when it held about 40 percent of average. On February 16 of this year it was at 43 percent.

Trinity Lake drought
North end of Trinity Lake in northern California, August 9, 2014. Photo by Bill Gabbert.

It remains to be seen how the winter weather will affect the 2016 wildfire season. It is a factor of course, but more significant is the weather DURING the fire season. If it is hot, dry, and windy, there will be major fires.