
Six months ago we wrote about a project by the First Street Foundation which claimed to have developed a system for calculating the wildfire risk of 145 million properties in the United States.
We tested the system by entering property addresses for homes at two locations that were severely impacted by recent wildfires.
- The Marshall Fire near Boulder, Colorado last year destroyed 1,091 homes and damaged 179. We looked up the Risk Factor for three properties in a community that had total destruction. The result was that they all had a 3 of 10 “moderate fire factor”, and individually a 1.84, 2.0, 1.84 percent chance of being in a wildfire over the next 30 years.
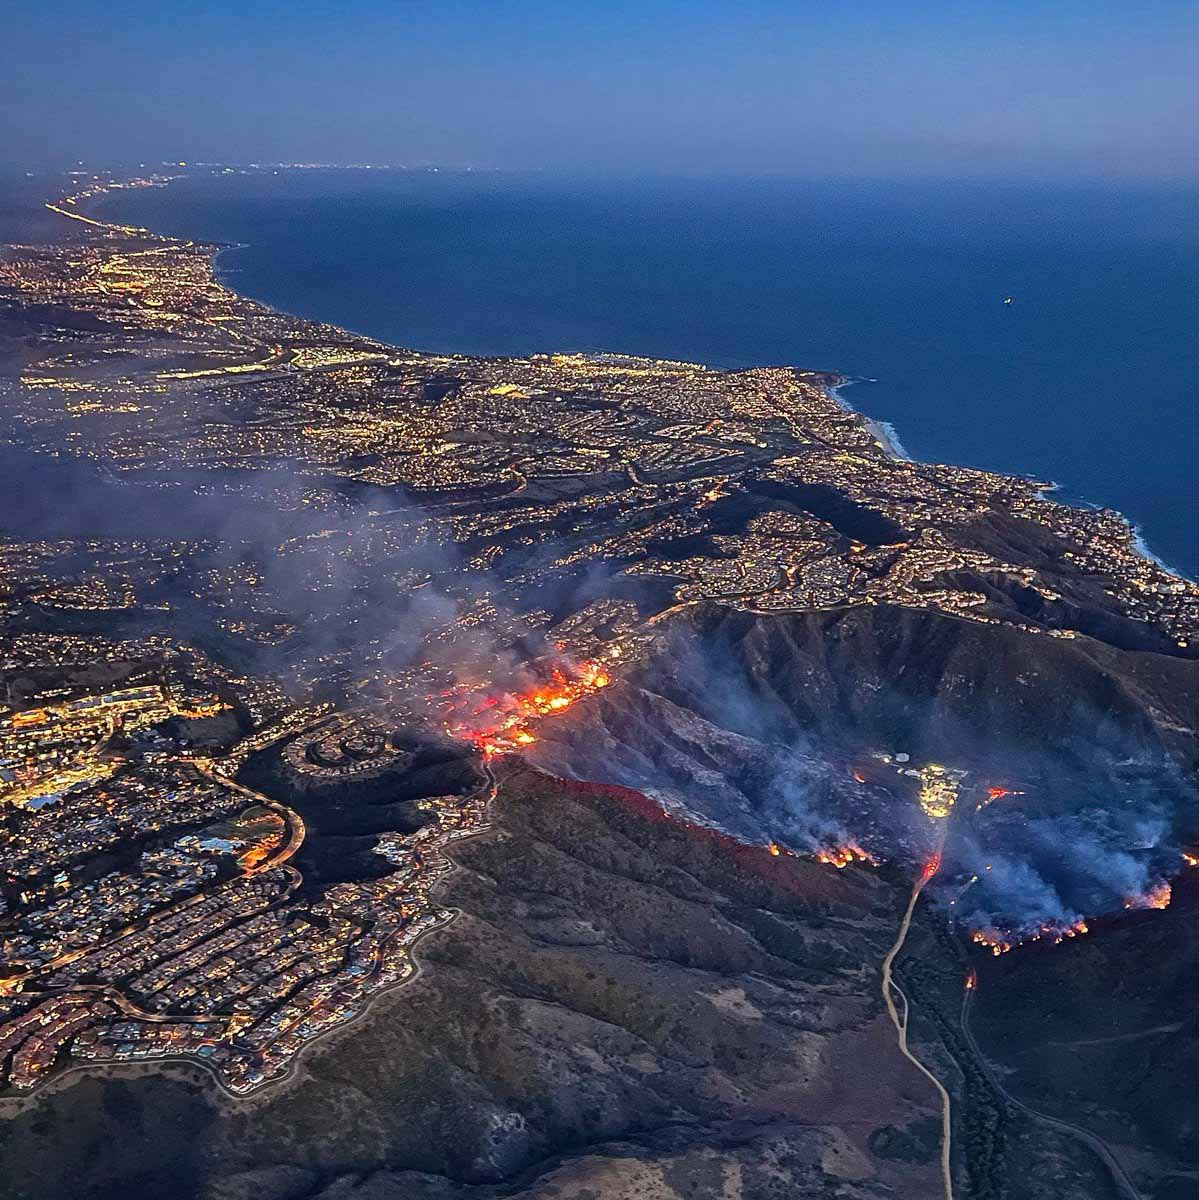
- The Coastal Fire (see photo above) destroyed 20 homes in Laguna Niguel, California and damaged 11. The two we looked at in the zone with severe destruction received a 3 of 10 “moderate fire factor” with a 0.93 and 1.54 percent chance of being in a wildfire over the next 30 years. The homes were at the top of a steep brush-covered slope.
Another system
Colorado State University engineers have developed a model that they say can predict how wildfire will impact a community down to which buildings will burn. They say predicting damage to the built environment is essential to developing fire mitigation strategies and steps for recovery.
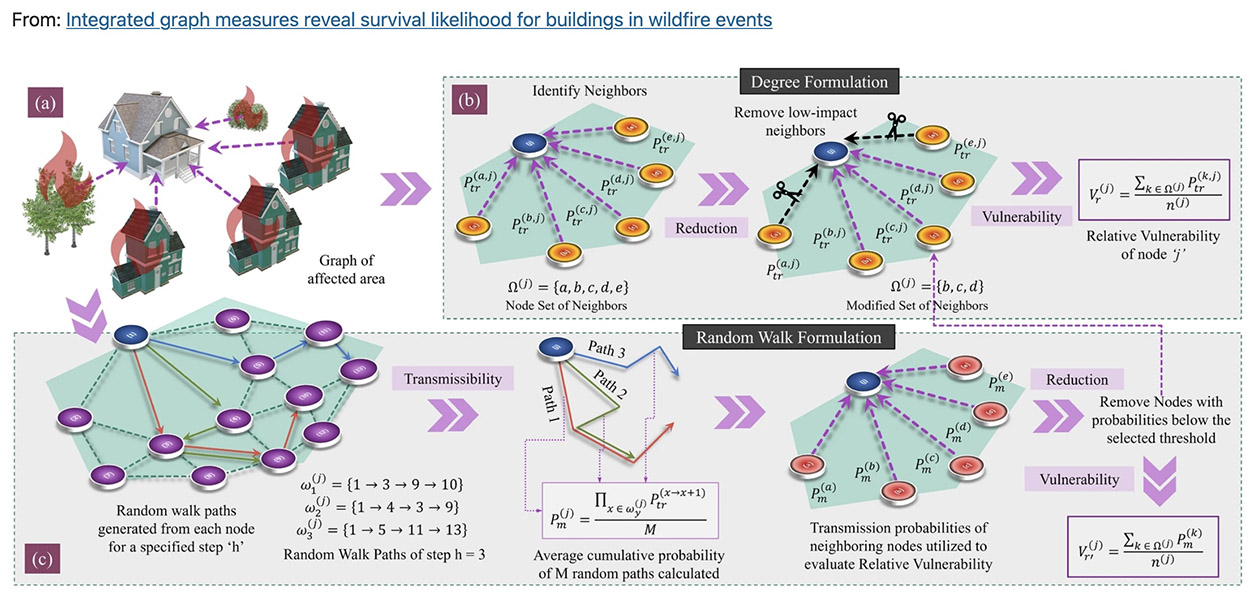
For years, Hussam Mahmoud, a Civil and Environmental Engineering professor, and postdoctoral fellow Akshat Chulahwat have been working on a model to measure the vulnerability of communities to wildfire. Most wildfire mitigation studies have focused on modeling fire behavior in the wildland; Mahmoud and Chulahwat’s model was the first to predict how a fire would progress through a community.
“We’re able to predict the most probable path the fire will take and how vulnerable each home is relative to the neighboring homes,” Mahmoud said. “We put a spin on the original model that allows us now to determine the level of damage in each building, whether the building will burn or survive.”
Using data from Technosylva, a wildfire science and technology company, Mahmoud and Chulahwat tested their model on the 2018 Camp Fire and 2020 Glass Fire in California. The model predicted which buildings burned and which survived with 58-64% accuracy. Since publishing their results in Scientific Reports, they have predicted which buildings burned with 86% accuracy for the Camp Fire by adjusting how the model weighs certain factors that contribute to damage.
Mahmoud says a holistic approach is needed to understand wildfire behavior and bolster resilience. Models that incorporate a community’s wildland and built environment features will give decision-makers the information needed to mitigate vulnerable areas.
Wildfire is like a disease
To develop their model, Mahmoud and Chulahwat employed graph theory, which is used to analyze networks. These methods also are used to study how diseases spread.
“Wildfire propagation in communities is similar to disease transmission in a social network,” Mahmoud said. Fire spreads from object to object in the same way contagions pass from one person to another.
Wildfire mitigation strategies are like the tactics used to control the spread of COVID-19, he said. A community’s immune system can be boosted by mapping a structure’s surroundings (contact tracing), clearing defensible space around structures (social distancing), reinforcing structures to be more fire resistant (immunization), and creating a buffer zone at the wildland-urban interface (closing borders).
Some homes are like super-spreaders — they are more at risk of fire and more likely to transmit fire to other homes. By targeting certain homes or areas for reinforcement, policymakers could maximize a community’s mitigation efforts, Mahmoud said.
As wildfire risk is compounded by more people moving to wildland-adjacent areas and climate change drying out the landscape in arid regions, the researchers hope their model will help protect communities from the devastating losses wrought by wildfires.
“Fire science is not rocket science—it’s way more complicated.”
Robert Essenhigh, Professor Emeritus, Mechanical and Aerospace Engineering, Ohio State University.

The devil really is in the details, and while computer programs tend or pretend to handle more variables than old-fashioned science, I sometimes wonder about inappropriate use by insurance underwriters, the bs factor, and other limitations.
Are there any cases where fires have occurred in rated areas and studied with respect to their resemblance to those ratings. In other words, have predictive abilities been demonstrated?
Having a healthy respect for the specter of GIGO, I wonder about the input data quality and relevance of connections to fire dynamics and shifts in context.
Estimates of wildfire burn probability are also available from a US Forest Service website at: https://wildfirerisk.org/. Unfortunately, to get the actual risk numbers, you have to download your state’s data and bring it into a GIS program. I did that for California and found that the burn probabilities estimated for my area by the US Forest site were much higher than those produced by the Riskfactor program from the First Street Foundation.
Another source of wildfire occurrence risk for California is an online map produced by Pyrologix under contract with the US Forest Service. It can be found at: https://wildfirehazard.com/. You can click on the web map to get an estimated burn probability for any location in California. The Pyrologix model for California uses higher resolution fuels and weather data than the national data at wildfirerisk.org. It also updates risk to 2020 based on wildfire trends. The estimates derived from this map are also much higher than the First Street Foundation results for my area. A report that details the California assessment is available at: http://pyrologix.com/reports/Contemporary-Wildfire-Hazard-Across-California.pdf
Nothing beats a fire line anecdote. What’s the best source of further info? Where did it start and how?
“The Coast Fire” area where those residences were destroyed was in my (OCFD) Laguna Niguel Fire Station’s first-in area as a firefighter in 1969. We preplanned and trained on fire there; it was/is just one of many areas at risk along that section of coastline. I personally felt the vegetation fire load needed a lot of work, in an ongoing effort.
Interestingly I just received an email today:
“…. Risk Factor Pro™ builds upon the basic premise of Risk Factor™ to help people understand their specific property’s environmental risk. The Pro experience expands on the already existing experience that makes it easy for anyone to find their property’s past, present, and future flood, extreme heat, and wildfire risk, and provides more utility to deep-dive into that risk through interactive maps and adjustable damage calculations. Risk Factor™ simplifies extreme heat, wildfires, and flooding so anyone can find their risk, understand the science, and make informed decisions to prepare for the future.
Create an account and unlock your property for free and explore the new features!…..”
I’m encouraged to see models like this that recognize that fire is granular (because the fuels are granular) and not a fluid (even though the atmosphere it exists in, and interacts with, is a fluid). Perhaps the epidemic model can inform the wildfire model in order to incorporate both the granular and fluid properties of an active wildfire. In both cases spread is by close contact and through the air.
I’d be interested in further elaboration of your thoughts, Robert.
It’s been my casual observation that most urban fires that are started by wildfires involve wind and a storm of burning material (embers or firebrands) “finding” something readily combustible to ignite (dry weeds, grasses, and other flash-fuels like domestic trash). Some structures burn from the inside-out, so tight structures can help, but heat and blowing debris break glass. While some ignitions are due to the flame front, such structure ignitions seem relatively rare and could be prevented by an on-site, preferably independent, fire suppression system. Such a system might prove more valuable, especially as a retrofit on older structures. Even masonry structures burn, and contribute to convection and radiation as well as their own airborne burning material. If there needs to be a 30 or 100-foot “defensible” space between the relatively short-lived and lower-temperature wildland fire and structures, it follows that an even greater separation should be required between structures. Advisory assistance rather than punitive measures are perhaps more likely to gain cooperation. Selection of structures most likely to ignite might be a useful consideration in a community fire suppression plan, as once the first structure goes (especially in the real world of jammed-together structures), the rest are a lot more likely to be ignition sources themselves. Look at unburned and incompletely burned material (e.g. trees) left behind in many destroyed neighborhoods. Detailed post-burn assessments also could be more useful than the appear to be now.
And so on.
I welcome any new research, and analogy may help, but I grow suspicious when I see a couple of decimal points on model output figures.