Researchers study factors that affect long-distance spotting of wildfires

The results could lead to more accurate models for spotting and fire behavior

map spot fires wildfire Australia
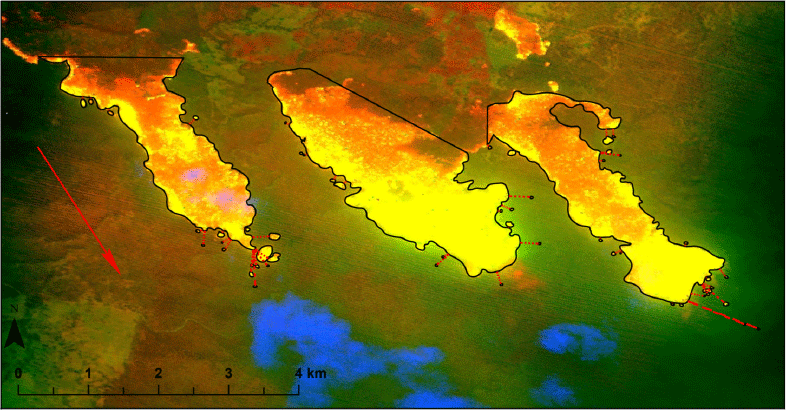
New South Wales Rural Fire Service line scan showing three separate source fires (three largest polygons). Most actively burning fire is yellow, orange is still hot after main fire front has passed, brown is extinguished, green is unburnt vegetation, blue is part of the smoke plume. Red dotted lines indicate spot fire (small polygons) distances measured for analysis. Red arrow indicates spread direction. (from the research)

Data collected in an Australian study could lead to the development of more accurate predictive models for wildfire behavior and spotting, especially for extreme wildfires.

Burning embers driven ahead of a wildfire can dramatically increase the rate of spread and the danger faced by firefighters and the public. Under moderate burning conditions a small number of spot fires might be suppressed if enough firefighting resources are available, but on large plume-dominated fires pushed by strong winds spot fires far from the  main fire can burn together making suppression at the head of the fire impossible. In many cases ember showers have been the primary ignition source for the destruction of structures in the wildland urban interface.

During the 2009 Black Saturday bushfires in eucalpyt-dominated forests in Australia the maximum spot fire distances were 30 to 35 km (18 to 22 miles) and during the 1965 wildfires in eastern Victoria were 29 km (18 miles). Spot fires in North America have been documented at distances of up to 19 km (12 miles).

A research paper on spotting distance in Victoria and New South Wales was published earlier this week by the International Journal of Wildland Fire, written by Michael A. Storey, Owen F. Price, Jason J. Sharples, and Ross A. Bradstock, titled “Drivers of long-distance spotting during wildfires in south-eastern Australia.”

The researchers took advantage of the increasing use of airborne mapping technologies on wildfires in Australia, including infrared and multispectral line scanning, to analyze data from 338 observations. (See map above.) They used ArcGIS to manually draw polygons and determine the size of the actively burning areas of the fire, which they called “source fire area”, and measured the distance to spot fires and the size of each. They also collected fuels, weather, and topography information.

Below is an excerpt from the research:

Maximum spot fire distances ranged from 5.0 m to 13.9 km (mean, 0.9 km; 95th percentile, 3.9 km). The mean number of spot fires per source fire (irrespective of distance) was 13. The distribution of maximum distance values appeared exponential, with a high proportion of shorter distances (Fig. 4a). Very long-distance spotting was rare; only 11 source fires had a maximum spotting distance >5 km.

maximum spot fire distances
Frequency distribution histograms of (a) maximum spot fire distance values from each source fire and (b) number of long-distance spot fire (>500 m) values from each source fire. (from the research)

Eleven of the fires had spotting distances more than 5 km (3.1 miles). The longest distance measured to a spot fire was 13.9 km (8.6 miles).

The analysis of 338 wildfire line scan observations found the size of the active area of the source fire to be the strongest predictor of long-distance spotting. Important secondary effects were fuel, weather, and topography.

Excerpts:

Wind speed was important to both Maximum-distance and long-distance Spot-number. Upper-level wind speed had weaker but still significant effects in the models. Wind at different levels can influence many aspects of wildfire behaviour, including plume development, plume turbulence and tilt, fire intensity, vorticity development, firebrand transport and ignition likelihood in receiver fuels.

A steep slope somewhere within the source fire (i.e. source fire max. slope) increased the maximum spot fire distance and the probability of spot fire occurrence >500 m. TRI [Terrain Ruggedness Index] performed similarly but was highly correlated with slope (>0.9), so was not included in the same models. An area of relatively high wind exposure (e.g. exposed ridge) also increased maximum spotting distance. Slope and wind exposure may be important through interactions with wind, changing wind speed, increasing turbulence and potentially enhancing pyroconvection, leading to enhanced firebrand generation and transport.

[W]e did not find a commonly used measure of bark spotting potential to be a significant predictor. Our results suggest that to accurately predict long-distance spotting, models must incorporate a measure of source fire area. Gathering data on spotting and plume development at wildfires over a range of intensities (including measuring intensity and frequent line scans) and improving fuel maps should be prioritised to allow for the development of reliable predictive spotting models.

The fibrous or stringy bark on some eucalyptus species is particularly suited aerodynamically for being lofted in a convection column and traveling for long distances while still burning, and is one of the primary ignition sources for long range spotting in Australia. The bark on North American trees is different, but the methods used by the Australian researchers could be used to collect similar spot fire occurrence data in the United States and Canada which could lead to improved spotting and fire behavior models.
Two Hollows Fire burns over 2,000 acres in south Mississippi

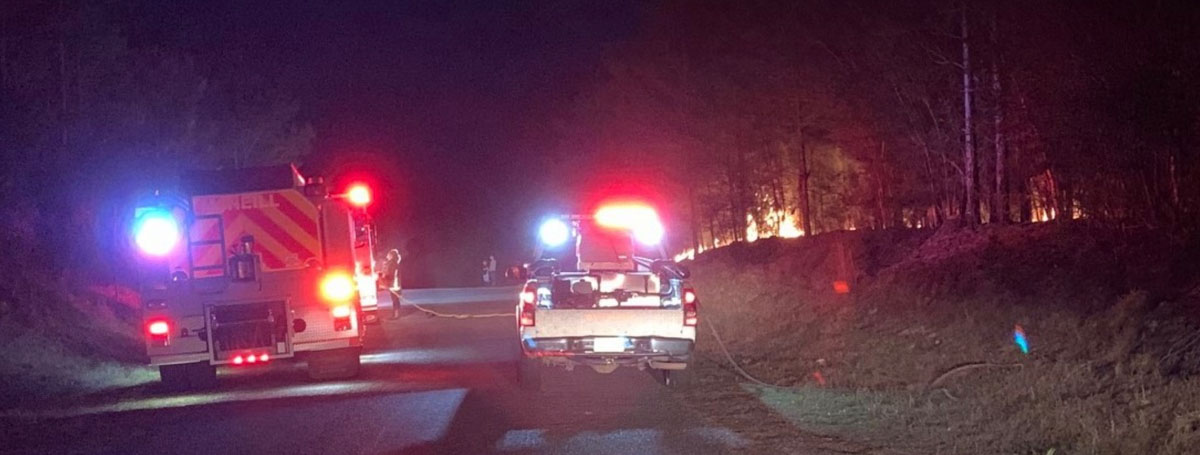
Mississippi Fire Feb 28 2020 MFC photo
Two Hollows Fire Feb. 29, 2020. MFC photo.

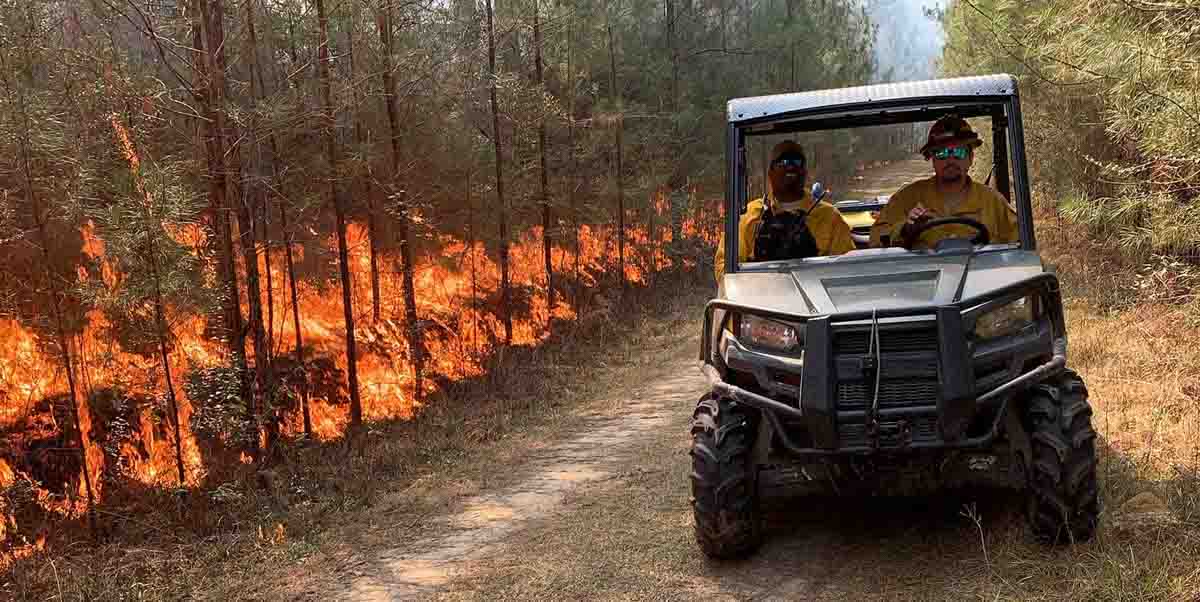
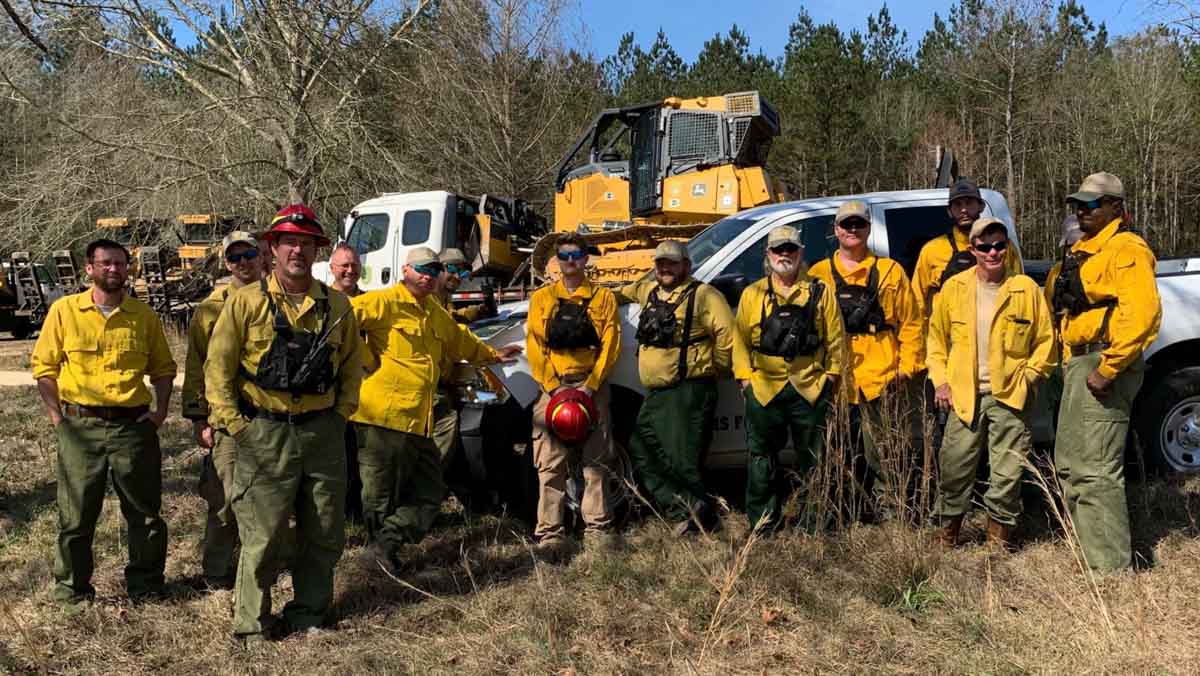
The Two Hollows Fire burned about 2,200 acres of industrial timber land in Pearl River County, Mississippi, approximately nine miles southeast of Poplarville. Jason Scott of the Mississippi Forestry Commission said 22 homes and 18 outbuildings were threatened but all were saved. The MFC responded with  19 employees, one fixed wing aircraft, seven bulldozers, and one drone. Multiple VFDs also responded with six engines and one water tender.

The fire was reported Saturday night, February 28. It took 12 hours to contain, and the Mississippi Forestry Commission monitored the fire for an additional 48 hours.

Two Hollows Fire
Two Hollows Fire Feb. 29, 2020. MFC photo.

The cause of the fire is still under investigation.

Mississippi Fire Feb 29 2020 MFC photo
Two Hollows Fire Feb. 29, 2020. MFC photo.

If you are having trouble playing the video below, you can view it at YouTube.

Satellite image of fires in Arkansas, March 5, 2020

Fires also detected in eastern OK and southeast MO

fires and smoke in Arkansas, Oklahoma, and Missouri
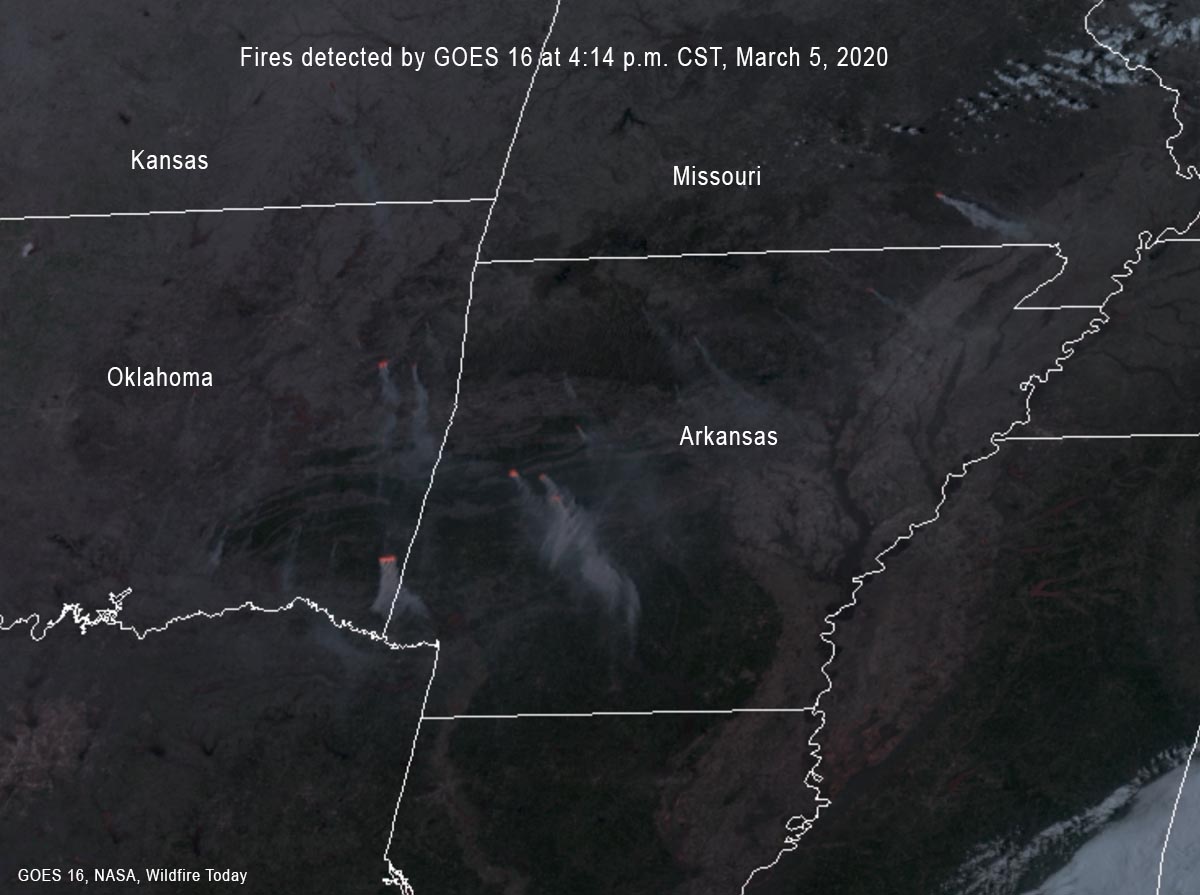
At 4:14 p.m. CST the GOES 16 satellite detected fires and smoke in Arkansas, Oklahoma, and Missouri. NASA data, processed by Wildfire Today.

At 4:14 p.m. CST on March 5 the GOES 16 satellite detected fires and smoke in Arkansas, eastern Oklahoma, and southeast Missouri. It is difficult to tell if they are wildfires, prescribed fires, or agricultural burning, but most of them appear to in forested areas.

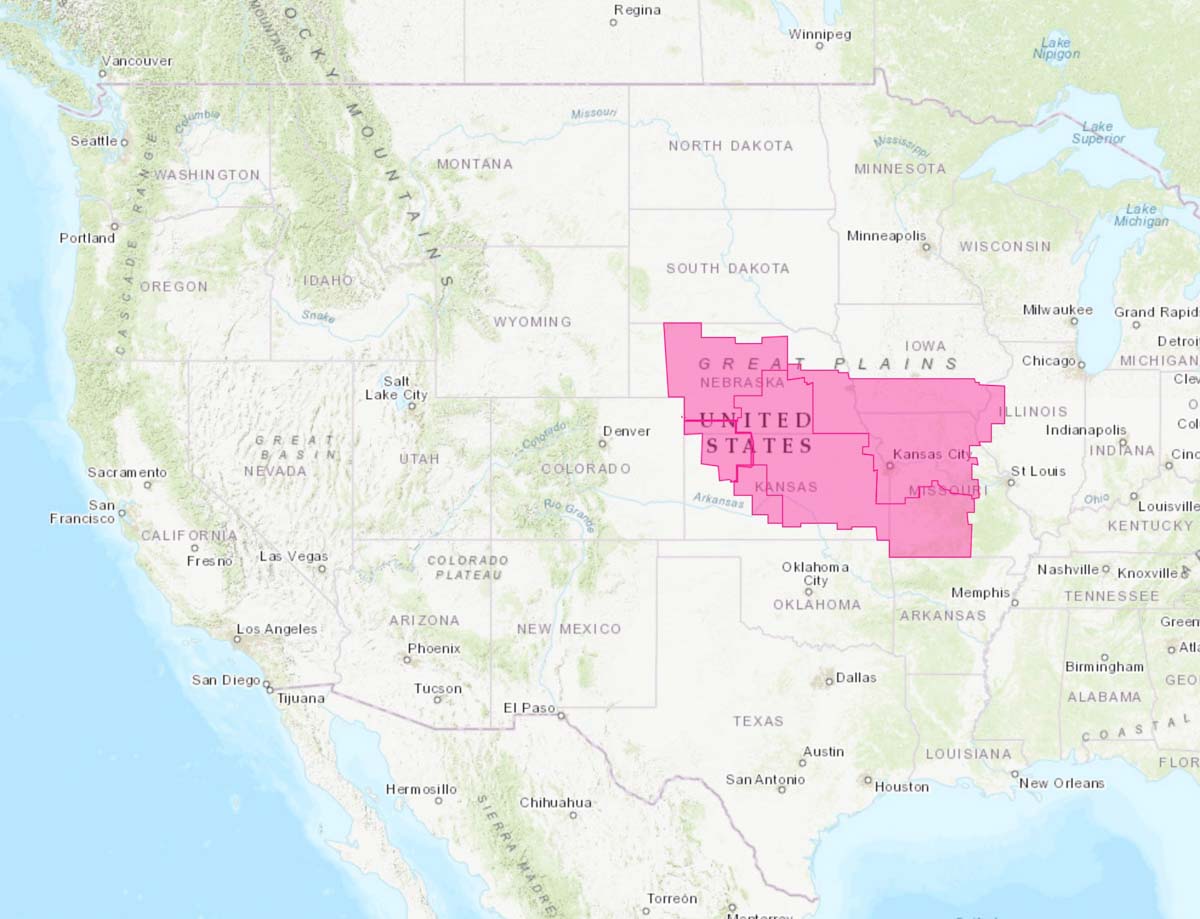
The March 5 prediction for Red Flag Warnings designated areas of enhanced wildfire danger north and northwest of Arkansas.

wildfires Red Flag Warnings, March 5, 2020
Red Flag Warnings, March 5, 2020.

Scientists say climate change increased risk of extreme bushfires in Australia

The researchers found the climate models consistently underestimated the observed increase in temperatures in southeast Australia

bushfire in Victoria Australia
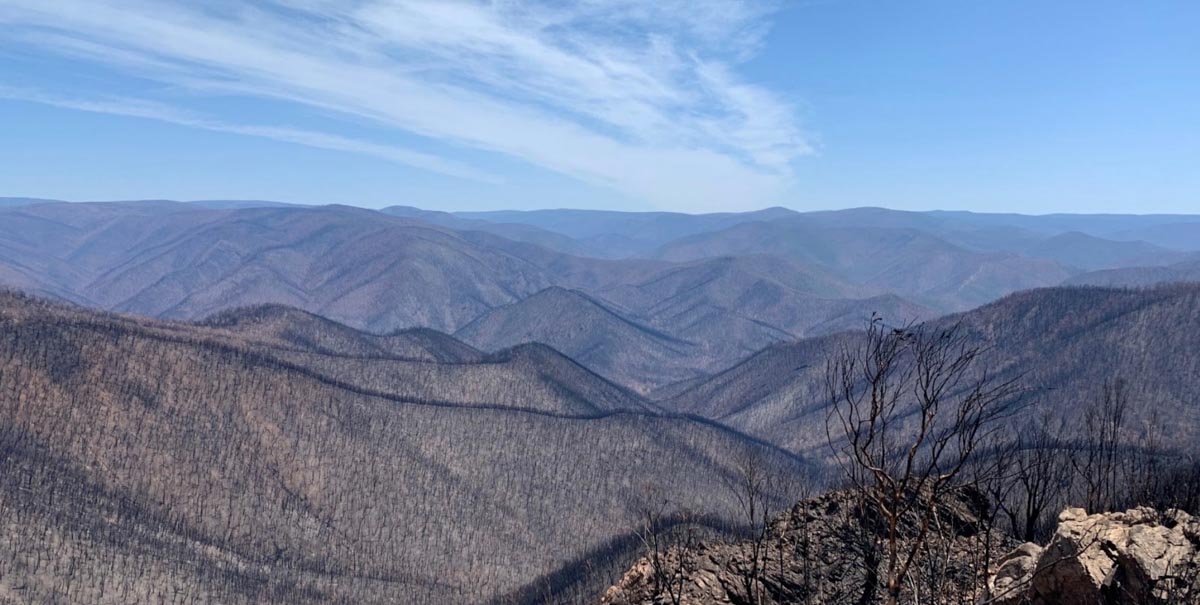
Photo of a fire in Victoria, Australia, by Forest Fire Management Victoria Forest Fire Operations Officer Dion Hooper. It was taken in January, 2020 on Wombargo Track looking towards Cobberas (north of Buchan in East Gippsland).

A group of scientists published a study that shows global warming led to warm and dry weather that created conditions favorable to large bushfires in Australia.

From the BBC:


…Global warming boosted the risk of the hot, dry weather that’s likely to cause bushfires by at least 30%, they say.

But the study suggests the figure is likely to be much greater. It says that if global temperatures rise by 2C, as seems likely, such conditions would occur at least four times more often. The analysis has been carried out by the World Weather Attribution consortium.

Co-author Geert Jan van Oldenborgh of the Royal Netherlands Meteorological Institute in De Bilt, The Netherlands, told the BBC even the study’s very conservative estimates were troubling.

“Last year the fire prevention system in Australia, which is extremely well prepared for bushfires, was straining. It was at the limits of what it could handle, with volunteers working for weeks on end,” said Prof van Oldenborgh.

“As the world warms, these events will become more likely and more common. And it’s not something that we are ready for.”

During the 2019-2020 fire season in Australia, record-breaking temperatures and months of severe drought fueled a series of massive bushfires across the country. At least 33 people were killed and more than 11 million hectares (110,000 sq km or 27.2 million acres) of bush, forest and parks across Australia burned.

Although it makes sense that human-induced global warming is likely to have led to more bushfires, assigning a figure to that increased risk is complex. That is because other factors not directly related to climate change may also play a significant role. These include increased water use making the land drier, urban heating effects or unknown local factors.

Nevertheless, Prof Jan van Oldenborgh and 17 fellow climate scientists from six countries gave it their best shot. “It was by far the most complex study we have undertaken,” he told the BBC.

The researchers found the climate models consistently underestimated the observed increase in temperatures in southeast Australia and so could not pinpoint a figure for the increased risk from climate change. They were, however, able to tease out a minimum risk.

“We show that climate change definitely increases the risk of the extreme weather that makes the catastrophic bush fires (that south-east Australia has experienced) in the past few months more likely by at least 30%.

“But we think it could be much more. We don’t know how much more. It could be a lot more.”

Prof van Oldenborgh is among those attempting to find out if the current climate computer models really are underestimating the influence of global warming – and if they are, working out how to correct them.

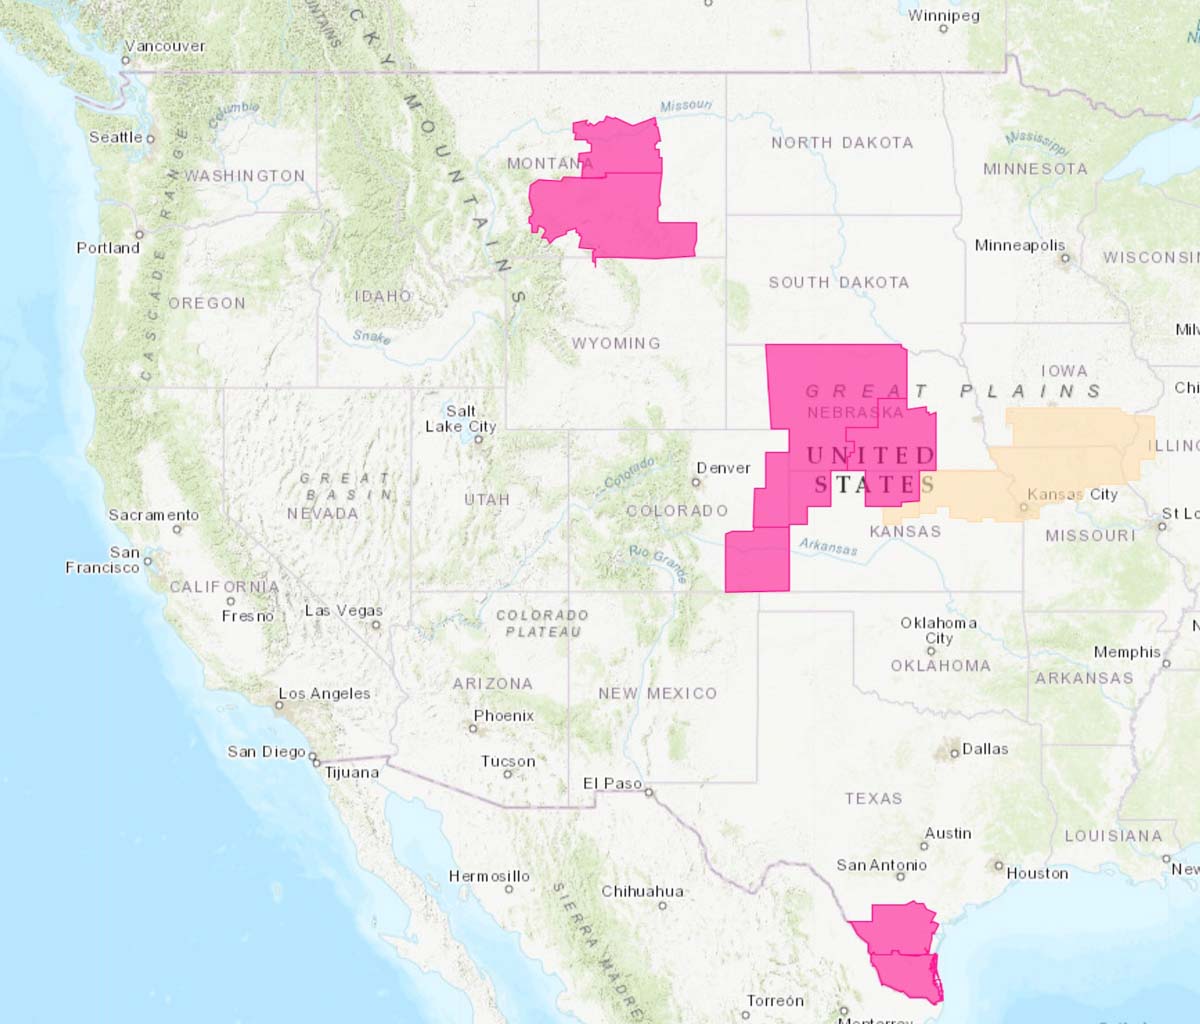
Red Flag Warnings, March 4 & 5

Red Flag Warnings fire wildfire
Red Flag Warnings issued March 4, 2020.

The National Weather Service has issued Red Flag Warnings due to low humidity and strong winds in areas of Montana, Colorado, Kansas, Nebraska, and Texas. Most of the warnings expire Wednesday evening except for those in western and north central Nebraska which are in effect until  Thursday evening.

(Red Flag Warnings can be modified throughout the day as NWS offices around the country update and revise their weather forecasts.)

Above average wildfire potential predicted for coastal areas of Central and Southern California

NIFC’s prediction for March and April

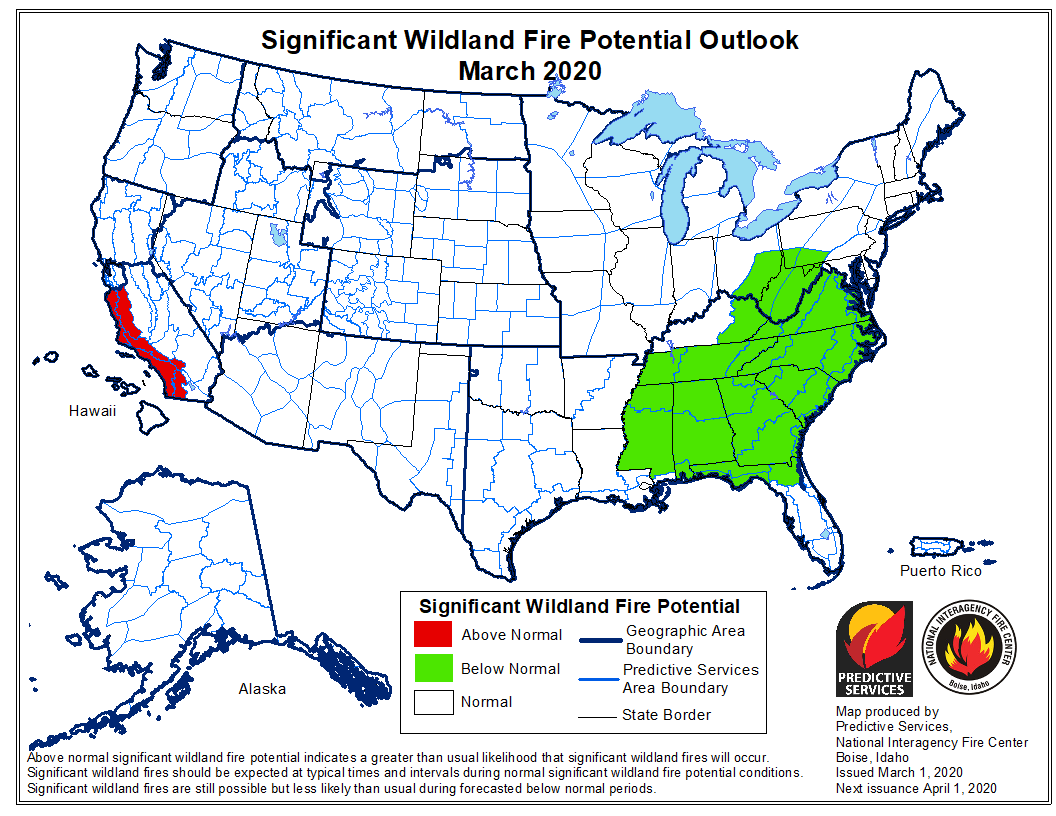
March wildfire outlook

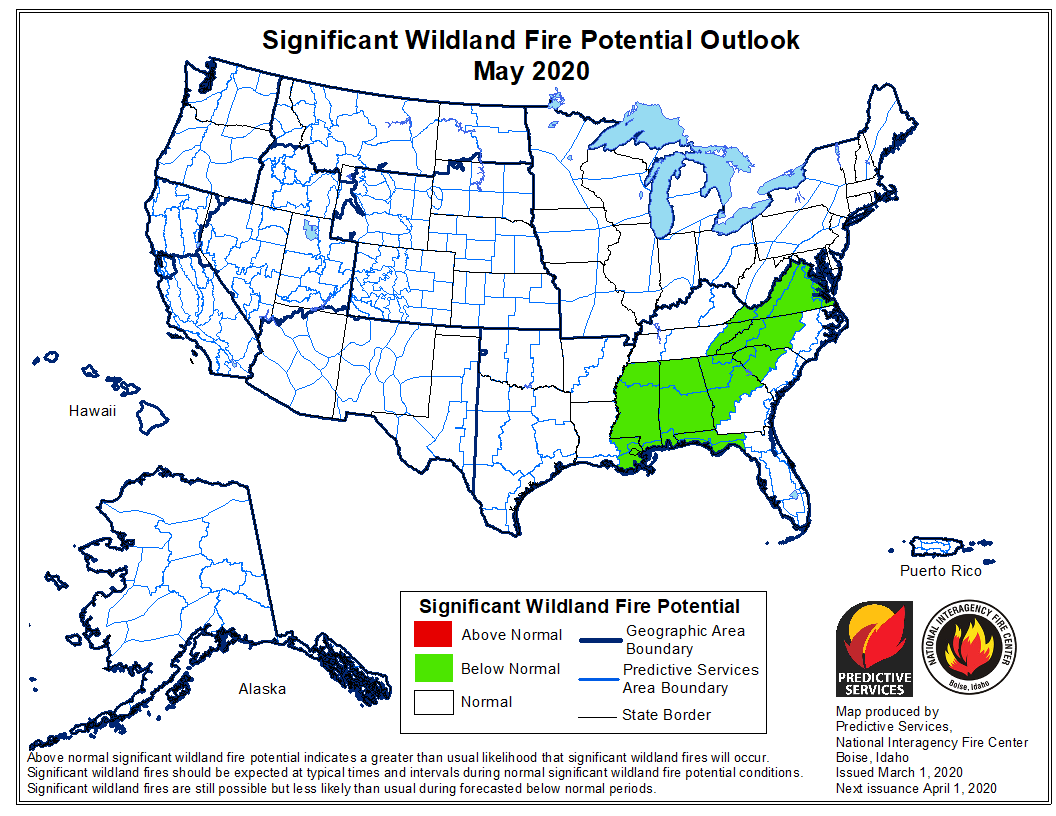
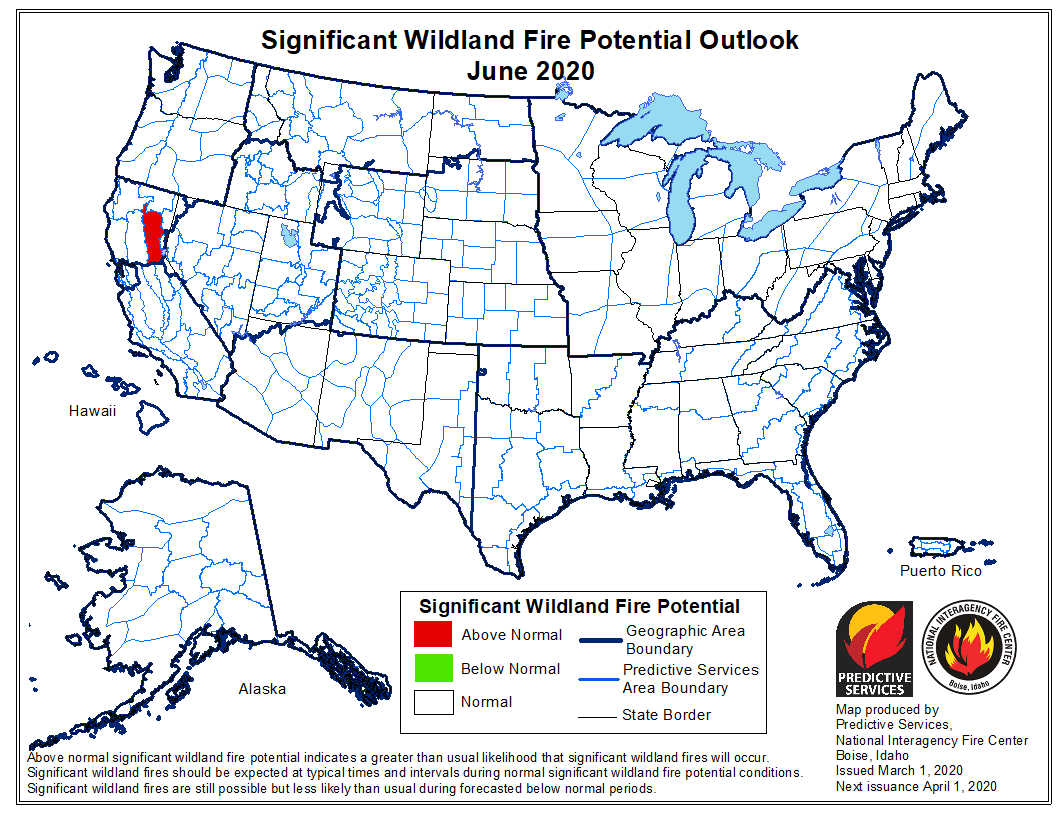
The Predictive Services section at the National Interagency Fire Center has issued their Wildland Fire Potential Outlook for March through June. The data represents the cumulative forecasts of the ten Geographic Area Predictive Services Units and the National Predictive Services Unit.

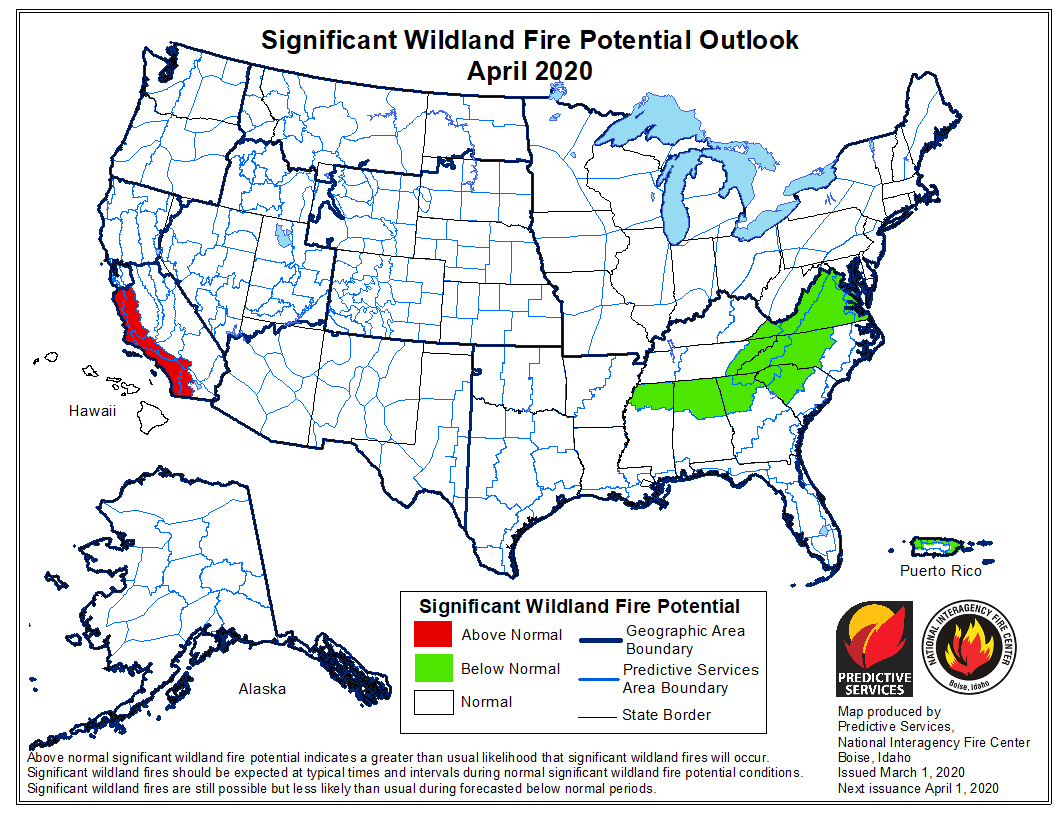
If NIFC’s analysis is correct the only area with above average potential for wildfires during March and April will be the coastal areas of Central and Southern California.

Below:

  • An excerpt from the NIFC narrative report for the next several months;
  • More of NIFC’s monthly graphical outlooks;
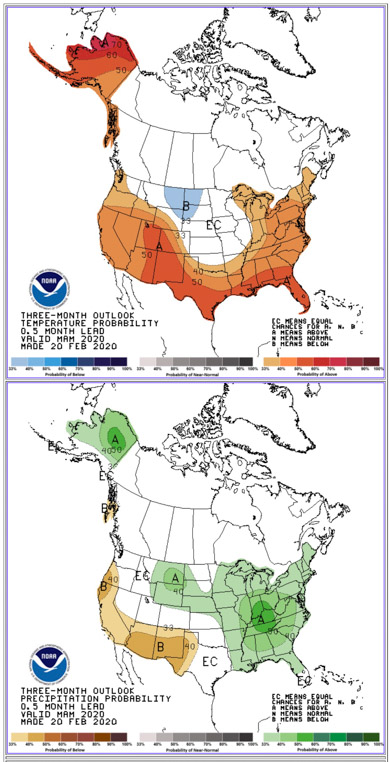
  • NOAA’s three-month temperature and precipitation forecasts;
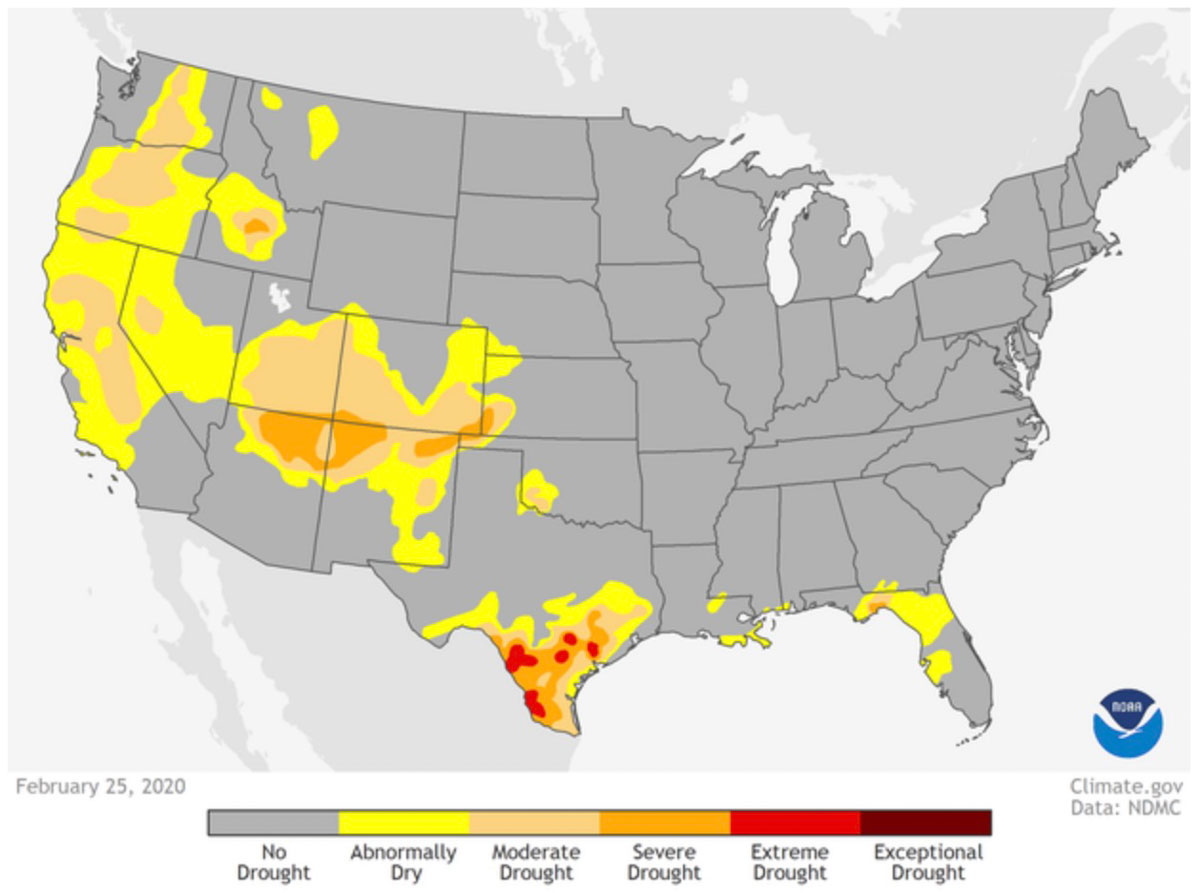
  • Drought Monitor;
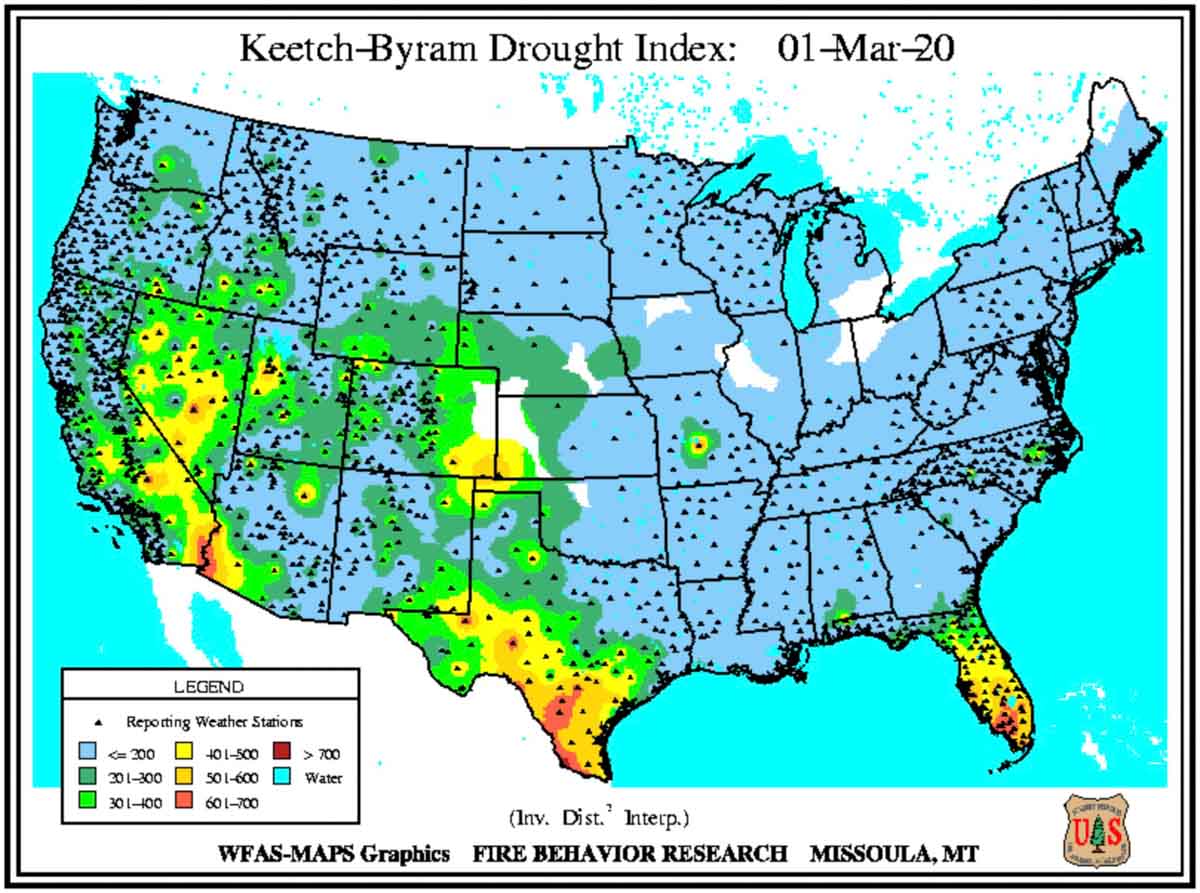
  • Keetch-Byram Drought Index.

Entering March and continuing through April, the prolonged periods of dry conditions across Southern California may lead to periods of elevated fire potential during days experiencing offshore winds. However, a muted greenup should initially limit activity. Normal to Below Normal significant large fire potential is expected along the Rocky Mountain Front during the pre-greenup period due to sufficiently wet or snowy conditions experienced during late winter.

Both the Southwest and Alaska will gradually transition into fire season in May with both regions peaking in activity by late June. Overall Normal significant large fire potential is expected during the period except possibly across northern and western portions of Arizona and across portions of South Central Alaska including the Kenai Peninsula where conditions were drier than average over the past winter.

[…]

[In Southern California] well below average rainfall and above average temperatures are expected to continue through April. Due to the lack of significant rainfall, fine fuels are curing rapidly across the lower elevations and will be completely cured by the middle or end of March. There will be an above average potential for large fires across the lower elevations of the Central Coast and Southern California due to the early curing of fine fuels. A near average amount of offshore wind events will most likely continue to occur through April. These winds will fan any new ignitions and rapid rates of spread and long range spotting will be likely in continuous dead fuel beds. The potential for large fire development will become Normal across all of Central and Southern California May and June as the interior warms up and the offshore wind season comes to an end.

April wildfire outlook May wildfire outlook June wildfire outlook

90-day Precipitation Temperature forecast
90-day Precipitation & Temperature forecasts for March, April, & May, 2020.
Drought Monitor
Drought Monitor

KBDI