Above: Satellite photo showing wildfire smoke in the northwestern United States and British Columbia August 6, 2017. The red dots represent heat.

News and opinion about wildland fire
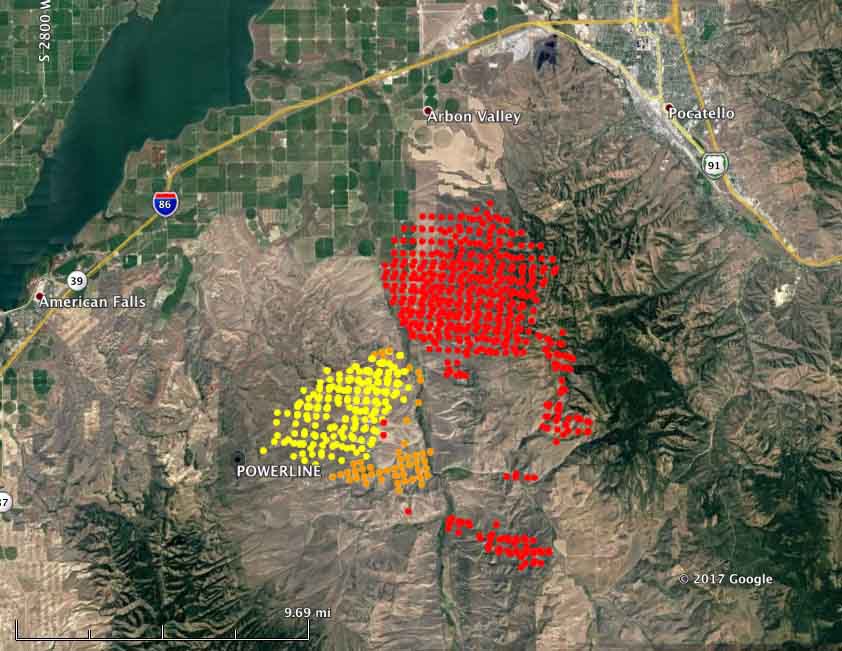
Above: A firefighter ignites a burnout on the Powerline Fire southwest of Pocatello, Idaho. Uncredited Inciweb photo, posted August 6, 2017.
(Originally published at 12:48 p.m. MDT August 6, 2017)
Wildland firefighters are much busier this year than in a typical year. To date, fires have burned 46 percent more acres than the 10-year average — 5,820,802 acres vs. the 3,962,906 average. In some years fire activity in Alaska, where many very large fires are not suppressed, can inflate these numbers, but so far that state can only account for 626,786 acres, not a huge number for Alaska.
400 hand crews, usually comprised of 20 people each, are deployed nationwide, along with 949 fire engines, and 120 helicopters for a total of 16,673 personnel.
Here are brief descriptions of some of the larger or more prominent fires:
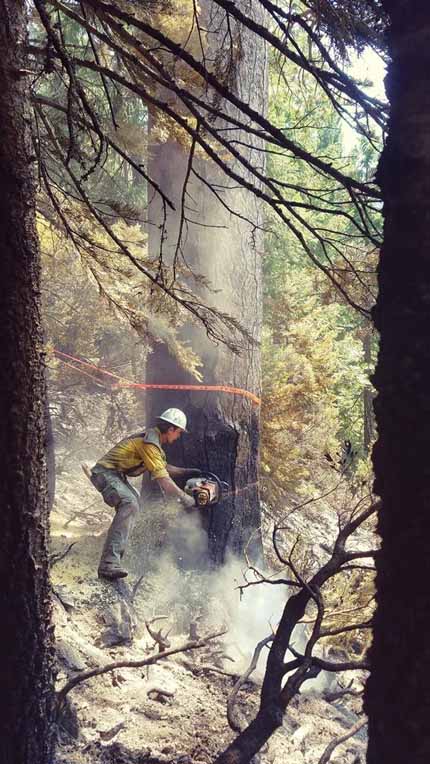
Above: A firefighter on the Rose Fire near Lake Elsinore, CA, July 31, 2017. Photo by Jeff Zimmerman.
(Originally published at 8:20 p.m. MDT August 5, 2017)
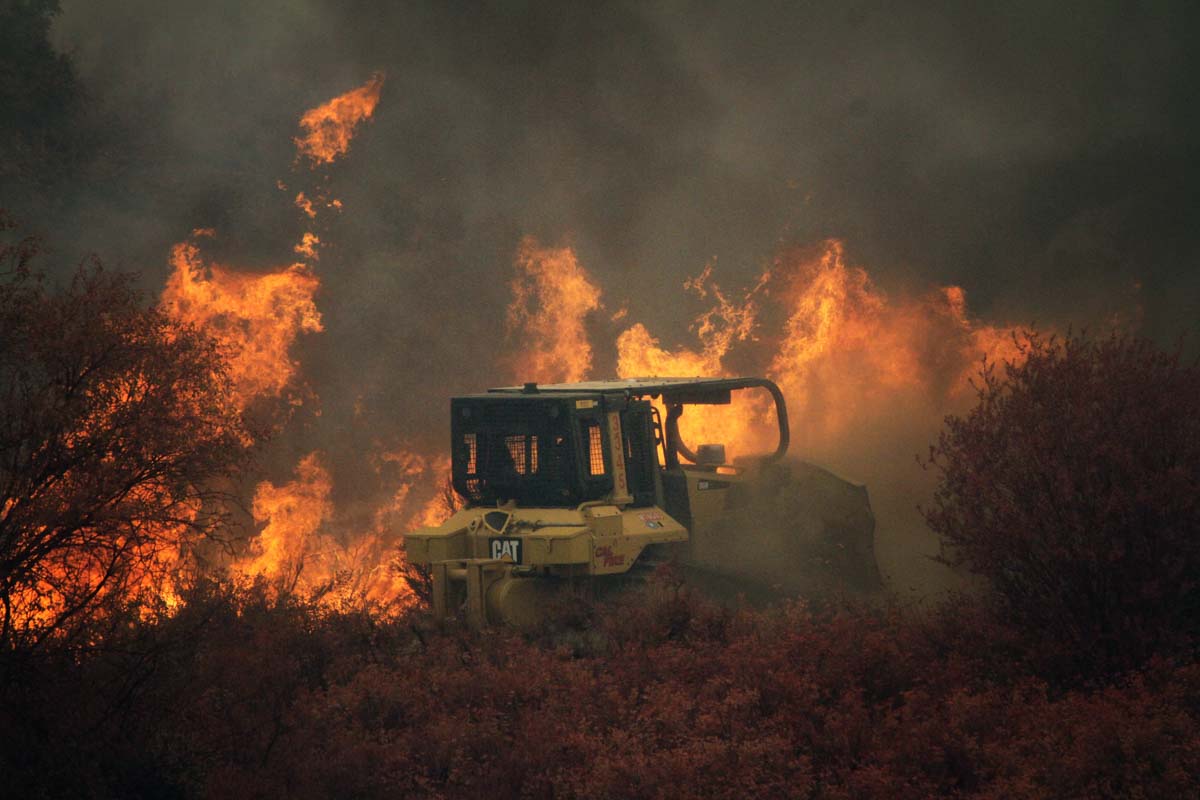
On July 31 firefighters were able to prevent structures from burning as a wildfire burned about 200 acres just northwest of Lake Elsinore in Riverside County, California.
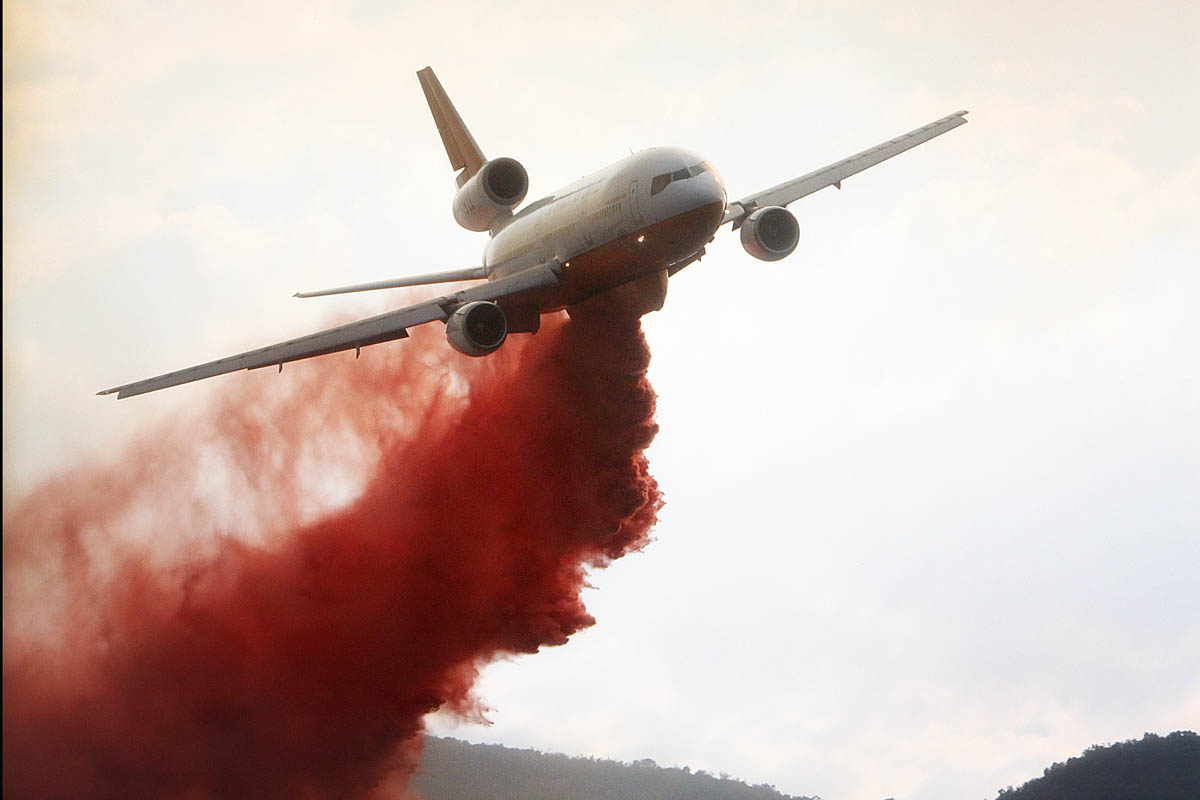
Jeff Zimmerman, who took these photos, said the fire was reportedly started by the use of equipment behind homes in the 100-degree heat. Jeff said heavy air tankers were brought in to help firefighters stop the spread of the fire as it moved up-canyon through heavy chaparral.
For a while homes along several streets in Lake Elsinore were evacuated as well as locations up the hill to the west in the Cleveland National Forest, including the North Main Divide road, El Cariso Campground, and Los Pinos Conservation Camp above El Cariso Village.
Continue reading “Rose Fire near Lake Elsinore, California burns 200 acres”
Above: Satellite photo of smoke from wildfires in the U.S. Northwest and Southern British Columbia, August 5, 2017. The red dots represent heat detected by the satellite.
(Updated at 6:50 p.m. MDT August 5, 2017 to add the more current satellite photo above.)
Smoke from wildfires in Southern British Columbia continues to pour across the border into Washington and other states in the U.S. Northwest. The air quality in Washington is the worst that residents have seen in recent years, reaching unhealthy levels in some areas according to agencies that monitor particulates and other pollutants.
Currently there are 110 active wildfires in British Columbia — four of them are larger than 50,000 hectares (123,000 acres):
Below is a gallery of maps and graphics showing the location of the fires, air quality, and smoke. Click on an image to see a larger version and start a slide show. Captions are in the top-left corner.
By Ann Manning, Colorado State University
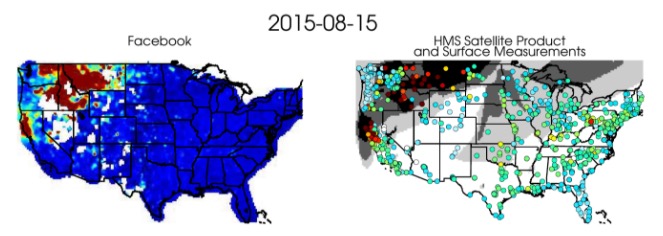
When people see smoke on the horizon, what do they do? Besides (hopefully) calling fire authorities, they post to social media, of course. The fact that people reliably flock to social media to discuss smoke and fire was the inspiration for a new study by Colorado State University atmospheric scientists. Driven to innovate ways to improve the air we breathe, the scientists have shown that social media, Facebook in this case, could prove a powerful tool.
A study in Atmospheric Chemistry and Physics led by research scientist Bonne Ford, who works in the lab of Associate Professor Jeff Pierce, shows striking correlation between numbers of Facebook users posting about visible smoke, and commonly used datasets for estimating harmful smoke exposure. These include satellite observations, chemical transport models and surface particulate matter measurements.
In fact, they found that Facebook did a better job pinpointing smoke exposure than satellite data, which takes pictures of smoke from above Earth.
“We have monitoring systems, but monitors can be sparse in different places,” Ford said. “In our group, we’ve been trying to combine a whole bunch of methods, models and observations to look at smoke exposure. And we thought, ‘it would be really great if people could just tell us when they are exposed to smoke. Well, what about social media?’”
The idea for the Facebook study grew out of an interdisciplinary meeting in 2015. Organized by CSU Distinguished Professor A. R. Ravishankara of the Department of Chemistry, the meeting convened regional scientists, government officials and emergency management authorities working to improve smoke monitoring.
Anonymous Facebook posts
Partnering with a research scientist at Facebook – paper co-author Moira Burke – the scientists culled de-identified, city-level aggregated Facebook data across the U.S. and Canada during the period of June 5-Oct. 27, 2015. They counted Facebook users who posted about wildfire smoke, using, for example, terms like “haze,” “smoke” and “fire,” but not “cigarette.” These posts were counted automatically at the city level; researchers did not read any individuals’ posts. Thus Facebook was the ideal test case for tracking when and where people posted about fires in their area, without identifying who was posting.
The researchers made daily maps that counted Facebook posts and compared them with data maps of standard smoke monitoring systems. They found strong correlation particularly with surface monitors, which sense airborne particulate matter with diameters of 2.5 microns or less, so-called “PM2.5” which is a standard measure of smoke and other inhalable particles in the air. Breathing PM2.5 particles is considered to have potential health ramifications, which is why scientists are interested in studying their whereabouts and impacts.
Pierce said that while satellites see smoke from above, the data can mislead. “Sometimes, the satellites can’t tell what altitude the smoke is at,” he said.
New methods
They hope their study could be useful in thinking about new methods to assess smoke exposure, and thus, provide better beacons for health risks assessment, Ford said. “We’re going to work on seeing if we can use this Facebook data to improve exposure estimates we’re already doing.”
Pierce and Ford collaborate with others across campus in the Partnership for Air Quality, Climate and Health, a union of multidisciplinary researchers working to assess air pollution and improve air quality.
Thanks and a tip of the hat go out to Allen.
Typos or errors, report them HERE.
Above: The distribution of wildfire smoke, current as of 2:09 p.m. MDT August 3, 2017.
(Originally published at 2:50 p.m. MDT August 3, 2017)
Smoke from wildfires in the United States Northwest and southern British Columbia is accumulating in those areas causing, in some areas, significant degradations in air quality. In British Columbia many massive fires combined with light winds has resulted in the smoke not being transported out of the area.
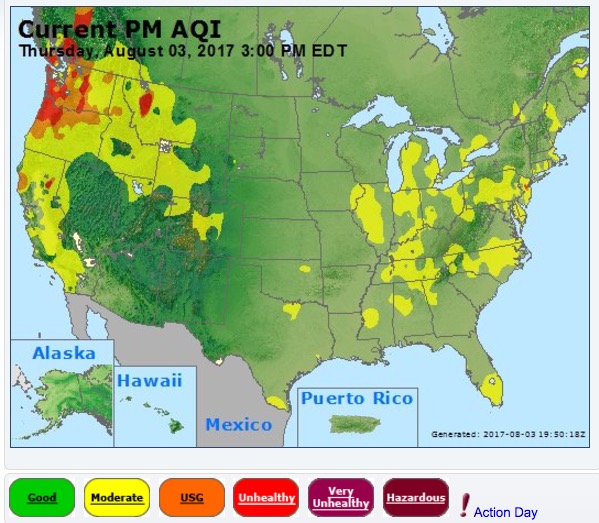
Some areas in BC, western Montana, and the western portions of Washington and Oregon have “unhealthy” air quality today, according to Air Now.