All but one member of the Granite Mountain Hotshots were killed on the Yarnell Hill Fire in 2013
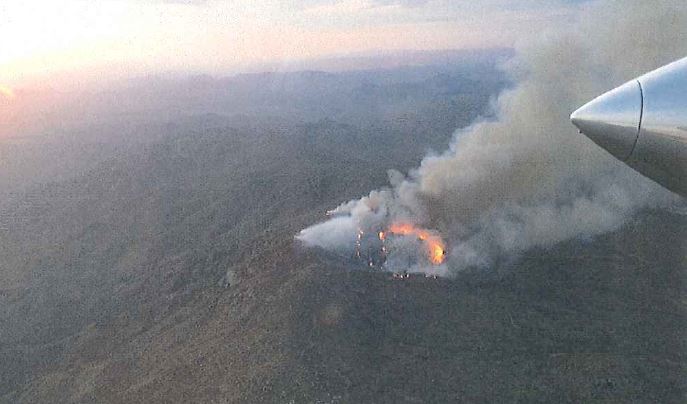
Yarnell Hill fire at 7:30 p.m. MST, June 29, 2013, approximately 21 hours before the 19 fatalities. Photo by ATGS Rory Collins.
Researchers at Embry-Riddle Aeronautical University have published the results of their work which show that winds out of a thunderstorm affected the Yarnell Hill Fire. On June 30, 2013 at about 4:45 p.m. local time 19 members of the Granite Mountain Hotshots were killed as the fire changed direction and overran their position.
The weather that led to the fatalities has been clear since we covered it on Wildfire Today about three hours after the burnover before the entrapment was officially confirmed:
…This was apparently caused by a 180-degree shift in the direction of the wind. From 10 a.m. until 4 p.m. local time at the Stanton RAWS weather station four miles south of the fire, the wind was from the south-southwest or southwest, but at 5 p.m. it began blowing from the north-northeast at 22 to 26 mph gusting up to 43 mph. This may have pushed the fire into the town.
If there were any firefighters on the south or southwest side of the fire between 4 and 5 p.m., who previously had the wind at their backs for seven hours with the fire moving away from them, they may have suddenly and unexpectedly found the fire heading toward them at a rapid rate. Wind direction changes like this are sometimes caused by a passing thunderstorm with strong outflowing downdrafts.
And a few minutes later:
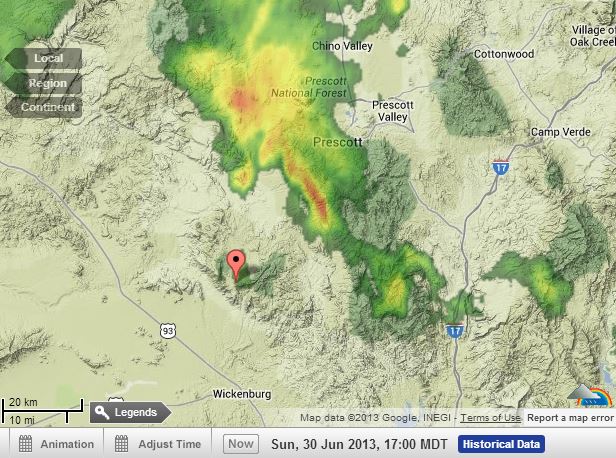
Radar at 4 p.m. MST, June 30, 2013 The pointer is at Yarnell, Arizona. WeatherUnderground.
The radar map above from WeatherUnderground shows a thunderstorm cell north and northeast of the fire at Yarnell, Arizona. The pointer is at Yarnell. The cell was moving toward the southwest, and may have produced strong winds that changed the wind direction by 180 degrees and could have been part of the reason the fire moved into Yarnell. It also could have caught firefighters by surprise.
In 2014 an animation of the weather event was developed by Janice Coen, Ph.D., a Project Scientist at the National Center for Atmospheric Research in Boulder, Colorado. It simulates through a coupled weather-wildland fire environment model the spread of the Yarnell Hill Fire and the wind direction and speed. The arrows indicate the wind direction; the length of the arrows varies with the wind speed.
Below is a summary written by Ginger Pinholster, of the recent research conducted at Embry-Riddle Aeronautical University about the event.
Nineteen firefighters who lost their lives in Arizona’s 2013 Yarnell Hill fire were likely victims of the same meteorological event that caused a deadly 1985 airplane crash, Embry-Riddle Aeronautical University researchers have reported.
City of Prescott firefighters who were members of the Granite Mountain Hotshots were probably surprised by a sudden microburst during the Yarnell Hill fire, according to Embry-Riddle meteorologists Curtis N. James and Michael Kaplan.
A microburst, and the wind shear induced by it, was also what sent a commercial airliner careening off the runway at Dallas/Fort Worth International Airport, killing 137 people on Aug. 2, 1985. That accident prompted major improvements in aviation safety. The National Transportation Safety Board concluded that there had been no way for the L-1011 aircraft to detect microbursts and wind changes. In response, NASA researchers developed new warning technology, and the U.S. Federal Aviation Administration required all commercial aircraft to have on-board wind shear detection systems.
Firefighters do not yet have equivalent protections.
Although microbursts can be detected by Doppler weather radar scanning right above the ground, radar signals are blocked over mountainous terrain or in remote areas where wildfires occur. With funding from the National Science Foundation, James and Kaplan have been collaborating with researchers and graduate students at North Carolina A&T University as well as the National Weather Service to better understand and learn from the tragedy of the Yarnell Hill fire.
On June 30, 2013, “Firefighters knew about the squall line over the Bradshaw Mountains and its outflow moving toward Yarnell,” said James, professor of Meteorology on Embry-Riddle’s Prescott Campus. “What they weren’t anticipating was that a storm cell would develop and create a microburst just to the east of Yarnell. We think the outflow from that microburst rushed westward toward the fire, which then redirected the fire’s motion.”
Microbursts can form very quickly around the periphery of larger, previously identified storms, explained Kaplan, an Embry-Riddle adjunct faculty member and professor emeritus with the Desert Research Institute. “When they hit the ground, microbursts barrel outward, often at high speeds,” added Kaplan, who worked on a team that studied the 1985 crash of Delta Air Lines Flight 191 in Texas.
The Yarnell Hill fire, ignited by lightning amid a drought and extreme summer temperatures, turned in response to the microburst outflow. The fire then rapidly and unexpectedly advanced on the firefighters as they were trying to make their way to safety through a ravine, James said. Analysis of historical meteorological data showed that wind on the north side of the fire, at the Emergency Operations Center, was moving from the north-northeast at 13 miles per hour (mph), whereas in Stanton, southeast of the fire, the wind was gusting to 47 mph.
“It was a very different situation on the south side versus the north side of the fire,” James noted. “Fine-scale convective storm cells can create that type of variability in the wind. That’s something the firefighters weren’t anticipating.”
Staying Safe on the Front Lines
First responders should have access to more information about microbursts, the Embry-Riddle researchers said. Even as an initial thunderstorm may seem to be waning, “It may spawn new storm cells that are extremely focused and intense, and incredibly small sometimes, yet they can wreak havoc,” Kaplan said.
To help raise awareness of the risks of microbursts, James and Kaplan recently shared their findings at the Annual Meeting of the American Meteorological Society. The work has also been published by the journal Climate and the journal Atmosphere.
The next step for the research, Kaplan said, is to run higher-resolution model simulations coupled with a fire behavior model. If all goes well, this “forensic meteorology” approach will show the motion of the fire as it moved through the complex terrain toward the firefighters at Yarnell Hill. At a resolution of 50 meters, “That would get us pretty close to the scale of what the firefighters actually saw that day,” Kaplan said. “That’s our goal.”
In addition to James and Kaplan, the research team includes Mark R. Sinclair, of Embry-Riddle; North Carolina A&T State University researcher Yuh-Lang Lin and his graduate students; and Andrew A. Taylor of the National Weather Service. The research involved the use of the Cheyenne supercomputer at the National Center for Atmospheric Research and is funded by the National Science Foundation.
Cameron Peak Fire smoke plume at Boyd Lake, InciWeb, Oct. 14, 2020.
In an effort to improve forest resilience and reduce the risk of catastrophic wildfires in the Interior West, three organizations are receiving a total of $20 million from the U.S. government.
The funds are part of the Infrastructure Investment and Jobs Act passed by Congress with bipartisan support and signed by President Joe Biden in 2021, which will go to enhancing key systems and processes to mitigate the impact of forest fires.
The award will be made to the Southwest Ecological Restoration Institutes (SWERI) which includes the Colorado Forest Restoration Institute (CFRI), Highlands University’s New Mexico Forest and Watershed Restoration Institute, and Northern Arizona University’s Ecological Restoration Institute. The SWERI were created through congressional legislation passed in 2004 which charged the three institutes with promoting adaptive management practices to restore the health of fire-adapted forest and woodland ecosystems of the Interior West.
The Colorado Forest Restoration Institute is housed in the Department of Forest and Rangeland Stewardship in CSU’s Warner College of Natural Resources.
The three institutes will work collaboratively on three key components with the funding, to:
Develop a national database of existing data on fuel treatments and wildfires,
Work with managers, planners, and policymakers to facilitate use and applications of the data, and,
Research outcomes of forest management and wildfires to learn what works.
“The work we’re charged with developing under the Infrastructure measure will create opportunities for land and fire managers, scientists and community stakeholders to co-produce actionable knowledge to lessen the harmful effects of wildfire events to people and the environment,” said Tony Cheng, director of the CFRI and professor in the Department of Forest and Rangeland Stewardship.
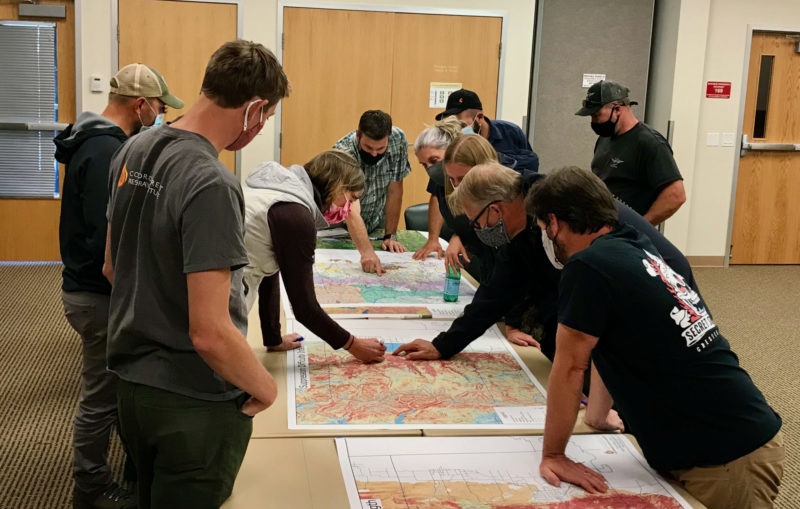
Land and fire managers and community stakeholders in Boulder County huddled around CFRI geospatial mapping products aided by CFRI’s science and outreach staff. Photo by Tony Cheng.
According to Cheng, the new funding aligns with the CSU land-grant mission and offers an opportunity to grow CFRI’s existing data management, application, and research efforts to be accessible for a wider audience.
The funding is prompted by climate change-driven increases in fire activity and fire season length, continued development in the wildland-urban interface, and interactions between fire and disturbances like pest and pathogen disturbance.
The CFRI recently completed a statewide database of forest vegetation management and wildfires for Colorado, complementing a similar effort for New Mexico and southern Colorado led by the New Mexico Forest and Watershed Restoration Institute. The data serve as a foundation for the decision support tools and collaborative processes that CFRI deploys around the state and throughout the Interior West. The national database will be developed using similar types of data across the country.
The data are only the starting point, said Brett Wolk, one of CFRI’s assistant directors. Making data meaningful for land and fire managers, scientists, policymakers, and community stakeholders working in their specific places is a critical function the institutes excel at and is called out in the Infrastructure provisions.
“Unless the data is situated within a social context where people can understand how it applies to their work, all the best data and science in the world won’t change decisions or outcomes on the ground,” said Wolk. “That’s why SWERI works to co-develop solutions with partners and empower decisions that are science informed but also locally relevant.”
A third component of the funding is researching outcomes of past treatments to improve future decisions. This will build on deep research expertise at the Arizona and Colorado institutes, exemplified by a recent CFRI co-led publication and accompanying podcast evaluating accomplishments of the Forest to Faucets partnership aimed at protecting Denver’s water supply from devastating wildfires.
The challenge, Wolk said, is applying the collective institutes’ knowledge and expertise across the entire U.S. At the same time, there is an opportunity for other states to benefit from the collective knowledge across the institutes.
“It’s a massive opportunity to help fast-track implementation of what’s working in forest and fire management. But research also shows big gaps in who has access to and contributes knowledge towards these forestry data and decision-making processes. If we can increase the application of science, while making incremental change to expand equity of ideas and resources among wider audiences, those will be our measures of success.”
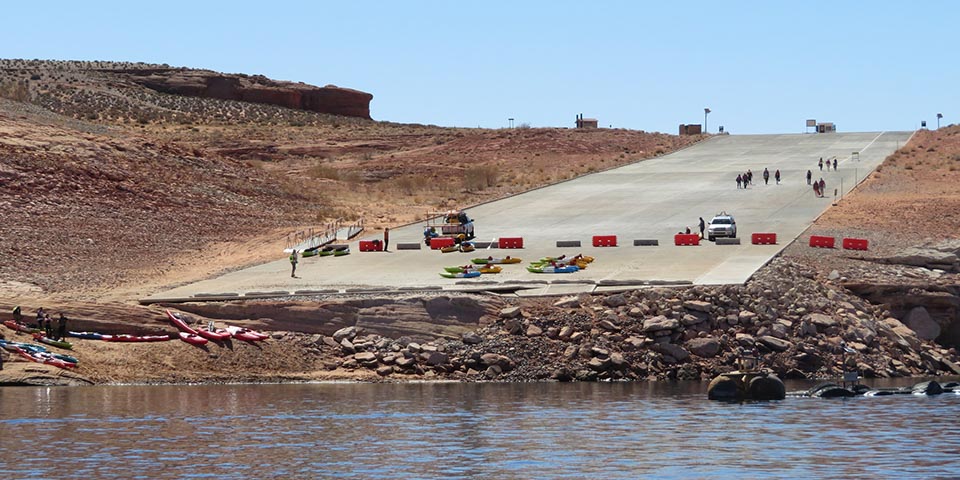
The public launch ramp at Antelope Point in late March, 2021 at Lake Powell, Glen Canyon National Recreation Area. NPS photo.
New research published this month shows that the current drought in the Western United States is the worst seen in data going back to the year 800. Scientists developed estimates of precipitation during previous centuries using tree-ring reconstruction and found 2000–2021 was the driest 22-year period in the last 1,200 years.
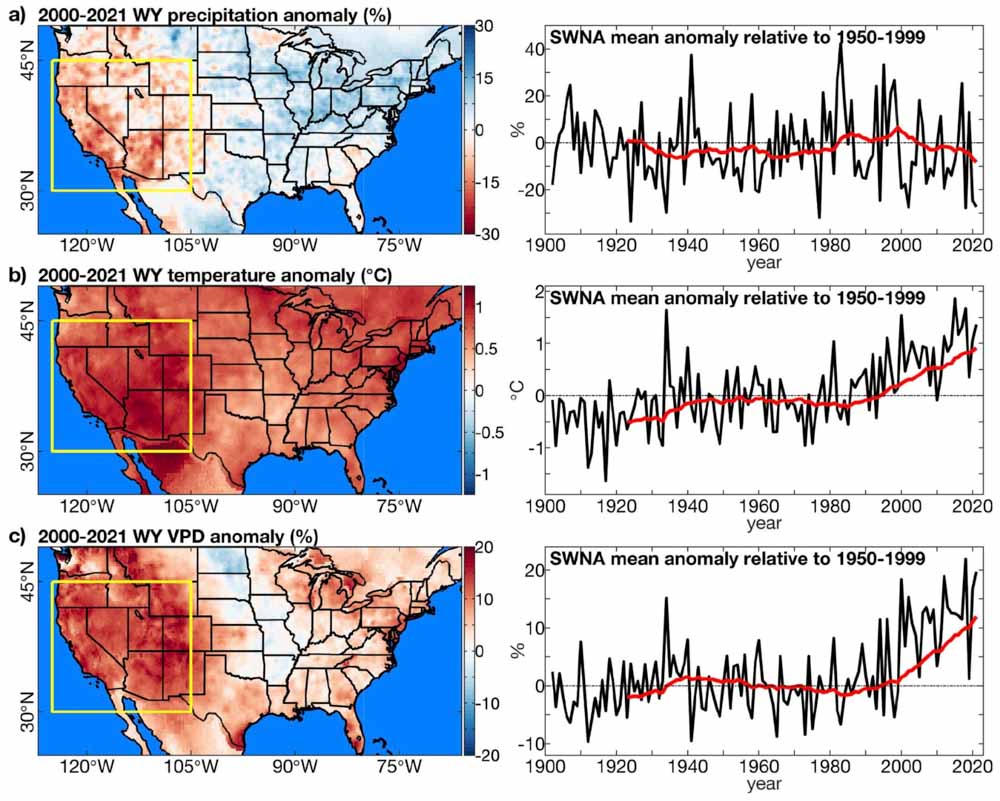
Observed climate anomalies. Anomalies in water-year (WY: October–September) (a) precipitation total, (b) temperature, and (c) vapour-pressure deficit (VPD). Maps on left show the average WY anomaly during 2000–2021. Yellow box: Southwestern North America (SWNA) study region. Anomalies are relative to 1950–1999. Time series on right show regionally averaged WY anomalies in SWNA (black) annually and as (red) 22-year running means visualized on the final year in each 22-year period. Geographic boundaries in maps were accessed through Matlab 2020a. From the paper.
Since the year 2000, southwestern North America (SWNA) has been unusually dry due to low precipitation totals and heat, punctuated most recently by exceptional drought in 2021. From 2000 to 2021, mean water-year (October– September) SWNA precipitation was 8.3 percent below the 1950–1999 average and temperature was 0.91 °C above average.
In summer of 2021, water levels at Lakes Mead and Powell, both on the Colorado River, reached their lowest levels on record, triggering unprecedented restrictions on Colorado River usage, in part because the 2-year naturalized flow out of Colorado River’s upper basin in water-years 2020–2021 was likely the lowest since at least 1906. Despite an active North American monsoon in 2021, the United States Drought Monitor classified more than 68 percent of the western United States as under extreme or exceptional drought for nearly all of July–October, 2021.
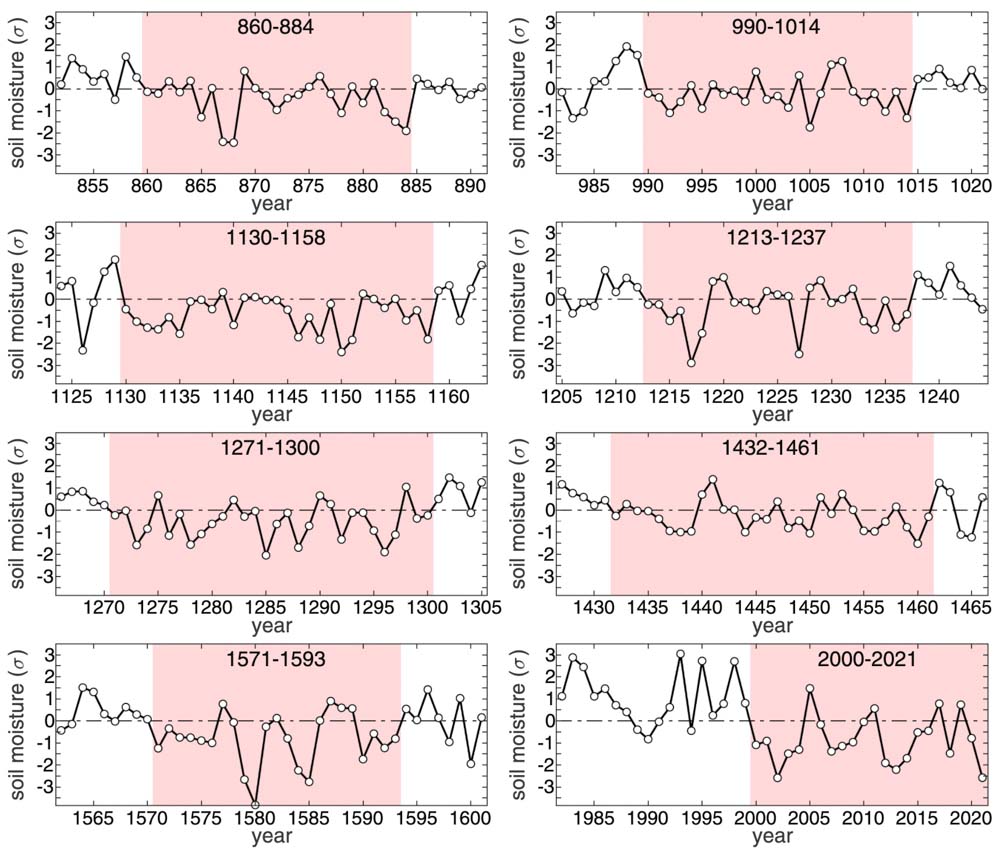
Extended drought events. Summer soil moisture anomalies, expressed as standard deviations from the 800–2021 mean (σ), during the longest 8 extended drought events during the 800–2021 study period. The pink background bounds the years of each extended drought event. The horizontal dotted black line represents the 800–2021 mean. For the first 7 droughts shown, soil moisture anomalies come from our tree-ring reconstruction. For the final drought (2000–2021), anomalies come from our observation-based record. From the paper.
The researchers concluded that anthropogenic climate change accounts for 42 percent of the SWNA soil moisture anomaly in 2000–2021 and 19 percent in 2021.
Drought can have a very significant effect on wildland fire behavior. It affects vapor pressure deficit (VPD), soil moisture, relative humidity, and moisture in live and dead vegetation, or fuels. VPD is an absolute measure of the moisture deficit of the atmosphere and is more closely related to water stress on vegetation than relative humidity.
Soil moisture is a particularly important integrator of drought. Of all 22-year periods since 800, only two (1130–1151 and 1276–1297) contained more years with negative soil moisture anomalies than the 18 observed during 2000–2021.
The authors wrote that the 22-year long current drought is highly likely to continue through a 23rd year.
Extreme and exceptional drought in the western United States (US). Weekly percentage of western continental United States (west of 103°W) classified by the United States Drought Monitor (USDM) as under extreme or exceptional drought from January 1, 2000 to December 28, 2021. Calculations were made form weekly shapefiles of USDM drought classifications, available at https://droughtmonitor.unl.edu/DmData/GISData.aspx as of January 9, 2022. The USDM is developed by the National Drought Mitigation Center (NDMC), the U.S. Department of Agriculture (USDA) and the National Oceanic and Atmospheric Administration (NOAA). From the paper.
The research was conducted by A. Park Williams, Benjamin I. Cook, and Jason E. Smerdon.
They found that ignitions on Forest Service lands accounted for fewer than 25% of the most destructive wildfires
Research led by Oregon State University shows that fires are more likely to burn their way into national forests than out of them. The findings contradict the common narrative of a destructive wildfire igniting on remote public land before spreading to threaten communities, said Chris Dunn of the OSU College of Forestry.
The study, which looked at more than 22,000 fires, found that those crossing jurisdictional boundaries are primarily caused by people on private property. It also showed that ignitions on Forest Service lands accounted for fewer than 25% of the most destructive wildfires – ones that resulted in the loss of more than 50 structures.
“In the old framing, public agencies bear the primary responsibility for managing and mitigating cross-boundary fire risk and protecting our communities, with their efforts focused on prevention, fuel reduction and suppression,” Dunn said. “This has been the dominant management approach of years past, which is failing us.”
Location of destructive wildfires (> 50 structures lost) between 2000 and 2018 that originated on (a) USFS lands, and (b) non-USFS lands. Fire locations are symbolized by magnitude of structure loss. Relatively few destructive fires originated on USFS lands. The most destructive USFS and non-USFS fires during this time are the Cedar fire and the Camp fire.
The findings, published February 15, 2022 in Nature Scientific Reports, follow by a few weeks the Forest Service’s release of a new 10-year fire strategy, Confronting the Wildfire Crisis. The strategy aims for a change in paradigm within the agency, Dunn said.
“We are long overdue for policies and actions that support a paradigm shift,” he said.
Scientists including Dunn and OSU’s Will Downing investigated 27 years of fires that crossed jurisdictional boundaries. The collaboration also included scientists from Colorado State University and the Forest Service’s Rocky Mountain Research Station.
Cross-boundary fires consumed just over 17 million acres during the study period of 1992 to 2019, and about half of the burned area was Forest Service land. The study area covered almost 141 million acres across 11 states and included 74 national forests.
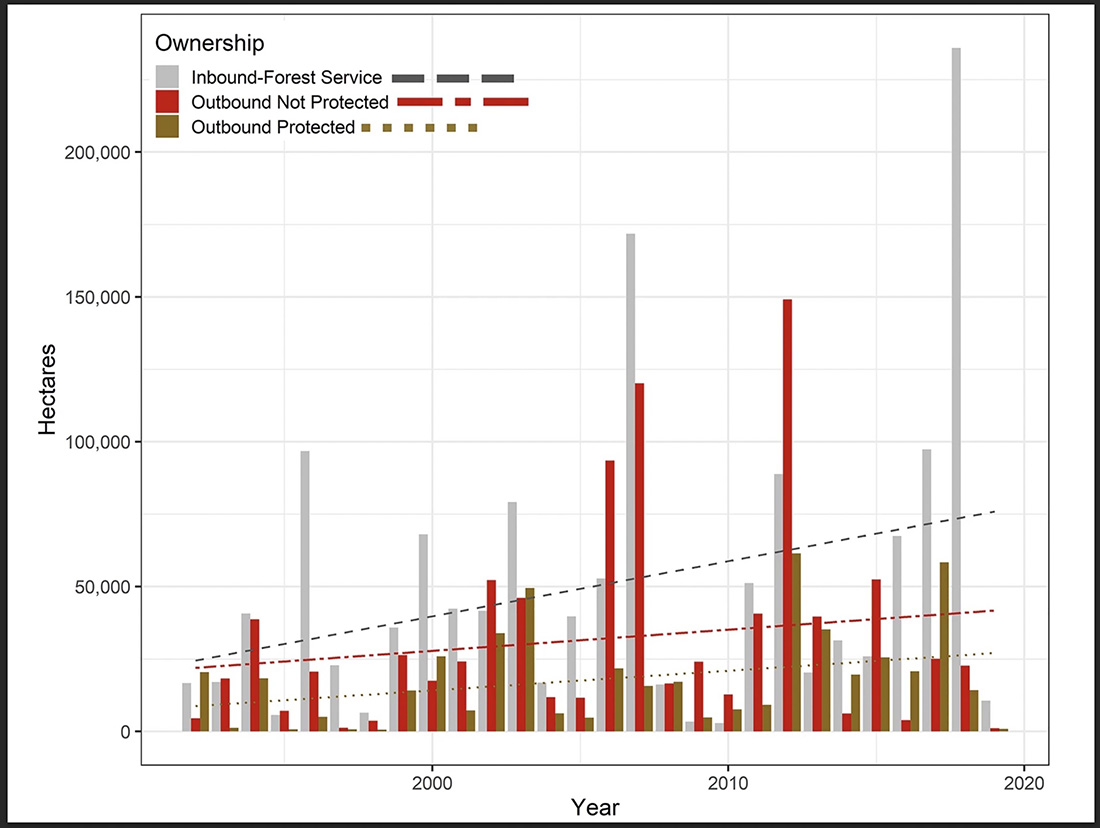
Area burned by CB fires derived from FIRESTAT data and binned by ownership category. Blue dots represent decadal averages of inbound and outbound acres combined. CB fire activity increased substantially during our study period. Area burned on USFS lands by fires originating on other ownerships (“inbound”, gray) has increased more rapidly than area burned on non-USFS lands. “Outbound not protected” refers to fires that burned out of a Forest onto land not protected by the Forest Service. Ownership categories are described in more detail in the Methods section of the paper.
Of all ignitions that crossed jurisdictional boundaries, a little more than 60% originated on private property, and 28% ignited on national forests. Most of the fires started due to human activity.
“The Forest Service’s new strategy for the wildfire crisis leads with a focus on thinning public lands to prevent wildfire intrusion into communities, which is not fully supported by our work, or the work of many other scientists, as the best way to mitigate community risk,” Dunn said.
Home Ignition Zone
“A substantial portion of the wildfire problem is a community destruction problem,” added Michael Caggiano of Colorado State. “The Forest Service can contribute to an advisory or facilitation role to address the home ignition zone, including fire resistant design and zoning, and fuels management on private lands, but states, local government and homeowners are better positioned than the USFS to manage those components of wildfire risk.”
A paradigm shift that could mitigate wildfire risk would begin with the recognition that the significant wildfires occurring in western states is a fire management challenge with a fire management solution, not a forest management problem with a forest management solution, Dunn said.
“The only way we are going to address the wildfire problem on large public lands at the scale of the challenge is through the effective and efficient management of wildfires over the long run,” he said.
Dunn said that means allowing some fires or portions of fires to burn to provide risk reduction and ecological benefits, identifying and preparing locations where suppression is likely to be effective, and developing strategies to rapidly distribute resources to where they are most needed and can do the most good.
“Our research has significant potential to inform and guide development of effective cross-boundary risk mitigation strategies, including identifying where and how work on the ground can be most effective,” he said. “The main source of our communities’ exposure to wildfire risk is clearly not our national forests.”
The study showed that in many cases, national forests were a net receiver of cross-boundary wildfire rather than a source, and that those fires tend to happen in areas with higher densities of roads and people.
Dunn credits the Forest Service for accepting the modern realities of wildfire and for embracing collaborative governance and cross-boundary partnerships. He added that managing fire in multijurisdictional landscapes has become a centerpiece of wildfire strategic planning and that evidence suggests fire transmission across boundaries will continue to increase.
Legislation
“As the Forest Service’s strategy moves forward, we think there could be opportunities to learn from what their state partners are doing, such as the more comprehensive policies passed in Oregon in 2021,” he said. “Oregon’s omnibus wildfire bill is a science-driven approach that recognizes the shared responsibility we all have in adapting to the fire environment.”
The legislation requires those homes at greatest risk to mitigate at the home ignition zone and also addresses landscape resilience and improved wildfire response.
Dunn calls it “the type of comprehensive policy we need to address the multitude of impacts wildfires have on communities, ecosystems, industry, etc. It recognizes that the Forest Service is neither the sole source of the problem nor the sole solution to the problem, but rather one of many pieces to a paradigm shift society needs to make.”
Matthew Thompson and Karen Short of the Rocky Mountain Research Station also took part in the cross-boundary fire study, which was partially funded by the Forest Service.
From Oregon State University.
Authors of the research paper: William M. Downing, Christopher J. Dunn, Matthew P. Thompson, Michael D. Caggiano, and Karen C. Short
Research shows that warming shortens the time between beetle generations, supercharging beetle population growth
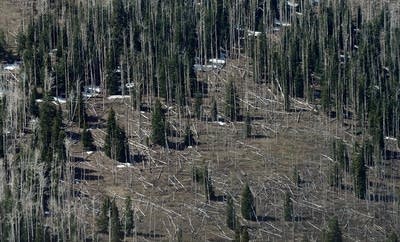
Pine trees killed by bark beetles. Photo by Ethan Miller.
In California’s Sierra Nevada, western pine beetle infestations amped up by global warming were found to kill 30% more ponderosa pine trees than the beetles do under drought alone. A new supercomputer modeling study hints at the grim prospect of future catastrophic tree die-offs and offers insights for mitigating the combined risk of wildfires and insect outbreaks.
“Forests represent a crucial buffer against warming climate and are often touted as an inexpensive mitigation strategy against climate change,” said Zachary Robbins, a researcher at Los Alamos National Laboratory, graduate student at North Carolina State University, and lead author of the paper on beetles and ponderosa pine tree die-offs. “Our research shows that warming shortens the time between beetle generations, supercharging beetle population growth. That can then spur catastrophic mortality in forest systems during drought in the Sierra Nevada and throughout the Western United States.”
In the recently published study in Global Change Biology, Robbins and his collaborators developed a new modeling framework to assess the risk western pine beetles, or bark beetles, pose in many forest ecosystems under climate change. If the effects of compromised tree defenses (15% to 20%) and increased bark beetle populations (20%) are additive, the team determined that 35% to 40% more ponderosa pines would die from beetle attacks for each degree Celsius of warming.
“Our study is the first to attribute a level of tree mortality to the direct effect of warming on bark beetles, using a model that captures both beetle reproduction and development rates and host stress,” Robbins said. “We found that even slight increases in the number of annual generations of bark beetles due to warming can significantly increase tree mortality during drought.”
Using Los Alamos supercomputers, the team modeled bark beetle dynamics and tree die-off during the extreme drought of 2012-2015 and earlier periods. Then they investigated those results using field observations of maximum and minimum temperature, precipitation, tree density, tree mortality, and beetle flight initiation (when fully developed beetles leave their tree of origin) along with lab studies on beetle rate of development.
They found that a quicker rate of producing new generations of off-spring contributed more to killer infestations than did surviving the winter in the absence of cold temperatures fatal to the beetle, yet, surprisingly, the increase in the number of generations was not very big.
“In the Sierra, we saw only about one-third more generations per year, but that really amplified mortality,” Robbins said. “It shows that a small impact in the success of these populations can have a big impact on tree mortality, where we previously thought the beetle needed one whole generation increase to substantially impact mortality.
“These findings should generally apply to many species of pine forests around the West, although the beetle species might be different,” said Chonggang Xu, coauthor of the paper. A senior scientist at Los Alamos, Xu simulates forest-vegetation dynamics in his research.
“Beetle-instigated die-off may cause forests to act as carbon sources to the atmosphere for decades,” Xu said. “Dead trees don’t absorb CO2 but release carbon to the atmosphere. This could potentially raise global forecasts of atmospheric carbon, which has not yet been explicitly considered in current-generation earth-system models.”
The research also has implications for forest management under climate change.
“A mechanistic understanding of the interactions among climate, forests, and disturbances can improve the planning of forest management actions and better predict the effects of climate change on biological systems,” Robbins said.
Older, bigger ponderosas are particularly vulnerable to beetle attacks because their size supports large infestations, Xu said, while younger, smaller trees can survive.
“A diverse forest that combines small and big trees and species diversity, as well, is more resilient,” Xu said. He pointed out that forest management to minimize wildfire risk often removes the smaller trees and preserves the larger ones, “which creates a forest of big trees. Then the beetle comes and the trees could be devastated at the same time.”
Bark beetles kill trees worldwide by chewing through bark and depositing their larvae in the inner bark. An increasing number of beetle outbreaks in the past two decades have devastated forests across the American West, including New Mexico, striking nearly 11 million acres nationwide and threatening the basic structure and ecological processes of some forests.
The beetles exploit the warming, drying climate in the West. When precipitation and temperature remain at historic levels, trees can defend themselves from infestation, but drought often sparks bark beetle outbreaks. That is because water-stressed trees suppress their photosynthesis, close their stoma, and grow more slowly, depleting their carbon storage, which may weaken their defenses.
The life-cycle of the beetle depends on temperature under the bark and in the air. Warmer temperatures reduce the number of beetles killed off by deep winter cold and accelerate and extend the breeding season. Outbreaks finally collapse when bark beetles exhaust the supply of susceptible trees, acutely cold temperatures kill off the beetles, or predators and parasites decimate bark beetle populations.
The study considered historic and contemporary temperature trends in a broad swath of the Sierra Nevada, including several national forests and Kings Canyon, Sequoia, and Yosemite National Parks.
In a new approach, the team used a model of the breeding cycles and population dynamics of bark beetles. The team incorporated this model into a tree-death and insect-attack model, which accounts for the number of bark beetles in flight, the number and size of trees available as hosts, and the drought. The models were validated against data from field observations.
Paper: “Warming increased bark beetle-induced tree mortality by 30% during an extreme drought in California,” by Zachary J. Robbins, Chonggang Xu, Brian H. Aukema, Polly C. Buotte, Rutuja Chitra-Tarak, Christopher J. Fettig, Michael L. Goulden, Devin W. Goodsman, Alexander D. Hall, Charles D. Koven, Lara M. Kueppers, Gavin D. Madakumbura, Leif A. Mortenson, James A. Powell, Robert M. Scheller, in Global Change Biology. DOI: 10.1111/gcb.15927.
Funding: University of California National Laboratory Fees Research Program at Los Alamos National Laboratory.
From Los Alamos National Laboratory. The paper, funded by taxpayers, is not open source. Copies are priced at $59.
Shows climate change has driven a significant increase in Australia’s forest fire activity over the last three decades
Climate change factors, wildfire weather and activity. From the research.
From CSIRO
A lengthening of the fire season towards Autumn and Winter was identified, along with an increase in fire activity in cooler and warmer regions including alpine forests in Tasmania and tropical rainforests in Queensland.
The research published in Nature Communications is the first of its kind and combines analysis of previous forest fire sites with eight drivers of fire activity including climate, fuel accumulation, ignition, and management (prescribed burning).
Thirty-two years of satellite data and 90 years of ground-based datasets from climate and weather observations, and simulated fuel loads for Australian forests, formed the basis of the research, which allowed researchers to identify climate change driven increases versus natural variability.
CSIRO scientist, Dr. Pep Canadell, said the research was one of the most extensive studies of its kind performed to date, and was important for understanding how continued changes to the climate might impact future fire activity.
“While all eight drivers of fire-activity played varying roles in influencing forest fires, climate was the overwhelming factor driving fire-activity,” Dr Canadell said.
“The results also suggest the frequency of forest megafires are likely to continue under future projected climate change.”
Over the last 90 years, three of the four mega fire years occurred after the year 2000. A mega fire year is defined as the cumulative burned area of forest over one year of more than 1 million hectares.
Australia’s mean temperature has increased by 1.4 degrees Celsius since 1910, with a rapid increase in extreme heat events, while rainfall has declined in the southern and eastern regions of the continent. Globally fire activity is decreasing, however, the extent of forest fires in Australia is increasing.
Burned area, whole of continental Australia including Tasmania, linear fit. From the research.
When comparing the first half (1988 – 2001) with the second half (2002-2018) of the record studied, the research showed that the average annual forest burned area in Australia increased 350 per cent, and 800 per cent when including 2019.
Comparing the same time period, the research showed a five-fold increase in annual average burned area in winter and a three-fold increase in Autumn, with Spring and Summer seeing a ten-fold increase.
“In Australia, fire frequency has increased rapidly in some areas and there are now regions in the southeast and south with fire intervals shorter than 20 years. This is significant because it means some types of vegetation won’t reach maturity and this could put ecosystems at risk,” Dr Canadell said.
“Understanding these trends will help to inform emergency management, health, infrastructure, natural resource management and conservation.”
Bushfire. Courtesy of CSIRO.
The research was conducted by J. G. Canadell, C. P. Meyer, G. D. Cook, et al.