Patent describes using drone swarm to suppress wildfire

Researchers performed calculations to determine how many drones would be needed for attacking a wildfire

swarm of collaborative UAVs fire
Diagram from the patent

(This article was first published on FireAviation.com)

The person who was awarded a patent in 2017 for describing a system of drones that could be used to drop liquids on wildfires wrote a paper earlier this year with two other authors that claims to have determined how many drones would be needed for suppressing a small section of a fire.

The patent, #WO2017208272A1, awarded to Marco Ghio, is quite vague and does not supply any technical details. It says that instead of applying fire retardant or water in a conventional manner, a “rain” concept would be used:

Dropping small quantities of firefighting liquid or drizzling it over the fire, and its subsequent spreading on a large area instead of in a concentrated manner. This method, both theoretically and experimentally, is acknowledged as being particularly effective, whereas, on a practical level, it is effectively used in domestic and/or industrial firefighting systems.

swarm of collaborative UAVs fire
Figure 1. (a,b) Representations of the proposed firefighting system based on the use of a swarm of collaborative UAVs. (From the research)

In the United States fire retardant dropped from an approved air tanker is applied at coverage levels ranging from 1 to 9 gallons per 100 square feet, depending on the situation. It is not clear what coverage level “rain” would produce.

Drawing from the patent drones firefighting
Drawing from the patent

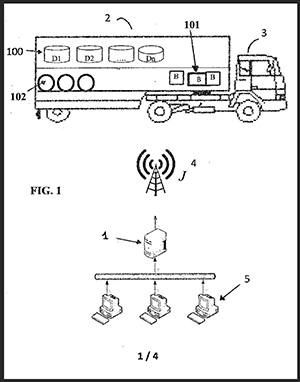
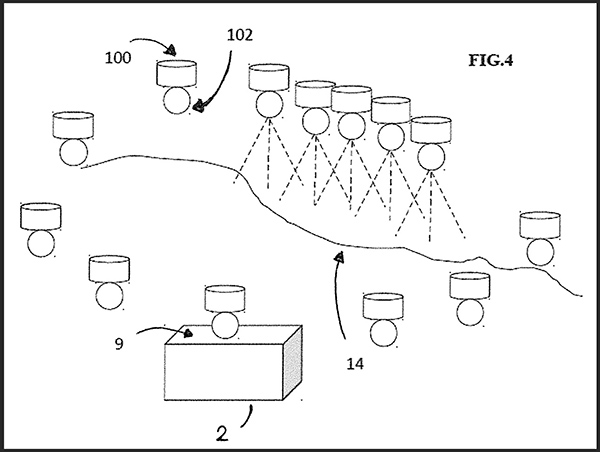
The patent specifies that drones would transport the liquid in removable containers. Upon returning empty to the mobile base the containers would be autonomously replaced with full containers, along with a charged battery if needed.

The drones and the other equipment would be transported in standard metal shipping containers which would be strategically positioned. The system would include “a control unit for the coordination of missions, the flight paths to be followed, and the selection of the ideal drop points optimized according to the environmental conditions.”

Details about how all of this would be accomplished are not specified.

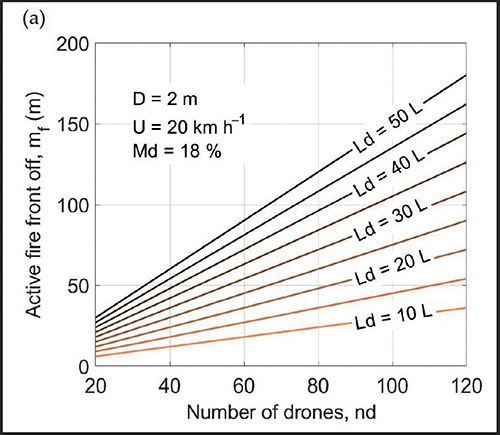
The patent and the research paper written by Mr. Ghio,  Elena Ausonio, and Patrizia Bagnerini assumes that the cargo capacity of the drones would be 5 to 50 liters (1 to 13 gallons), much less than currently carried by helicopters (up to 3,000 gallons) and fixed wing aircraft (up to 17,500 gallons) that routinely fight wildfires.

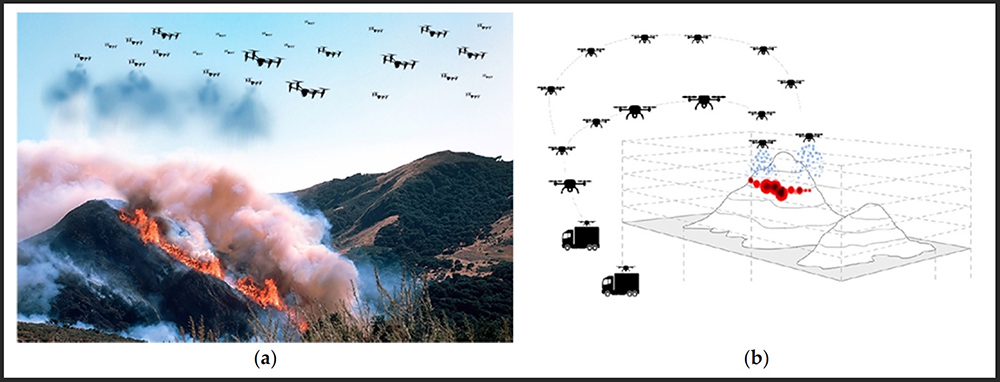
Their analysis (below) takes into account wind speed, flame length, the length of fire line to be suppressed, and the dead fuel moisture. It indicates that about 75 linear meters (246 feet) of the fire’s edge could be extinguished with 120 drones each carrying 20 liters (5 gallons) or 80 drones carrying 30 liters (8 gallons). The vegetation is assumed to be grass or brush, but not timber. The example below assumes that the wind speed is 20 km/hour (12 mph) and the dead fuel moisture is 18 percent. A moisture content of 18 percent for 1-hour and 10-hour time lag fuels is quite high for a very active wildfire. It should not be very difficult to suppress a  fire under those fuel conditions.

Number of drones needed to suppress wildfire
Figure 4a shows the linear meters of fire that can be arrested by using the firefighting system. For example, approximately 70–75 linear meters of active front can be extinguished with 120 drones each carrying 20 L or with 80 drones carrying 30 L. Assumptions are that the wind speed is 20 km/hour and the dead fuel moisture is 18 percent. (from the research)

Our take

In my opinion the most difficult part of using drones to assist firefighters would be applying the retardant or water at the exact location where it can be useful. That is difficult enough when you have good communication with ground personnel, adequate aerial supervision, and experienced highly qualified air crews in helicopters or air tankers.

I don’t think the principle of “rain” in the application of retardant or water from dozens or hundreds of drones is a thing, at least when you’re talking about drones that can just carry a few gallons of water and must have the batteries replaced every 20 minutes. The suppressant still has to be delivered in a timely manner in a quantity and at the location where it can be useful. Maybe when drones are carrying 50 to 100 gallons of water, and the technology improves for placing the retardant on target, it might be useful in very remote areas when the fire is very small, less than 1/10 of an acre, and the wind speed does not exceed 5 mph.

Rain Industries is working on an Unmanned Aerial System (UAS) that could carry up to 400 pounds of cargo, or 50 gallons of water.

Drone Amplified, the developer of the IGNIS prescribed fire system currently being used for aerial ignition, and Parallel Flight Technologies, have received a $650,000 grant from the US Department of Agriculture to support further development of a large-scale Unmanned Aerial System (UAS) for prescribed fire. Parallel says their hybrid gas/electric UAS can carry 100 pounds for up to two hours, numbers that are much larger than battery operated drones. When paired with the upgraded aerial ignition payload under development which will hold and dispense 3,500 incendiary spheres, it will have eight times the payload carrying capacity of drones being used today, and ten times the flight duration.

The paper was published by MDPI, which is food for thought.

Scientists confirm that nighttime wildfire activity is increasing

Firefighting agencies need to make changes to deal with the the new normal

Day-night proportion of fire activity
Fig. 9 from the study below showing the proportions of heat detected on wildfires at night, vs. during the day. The MODIS (black) time series spans 2003–2020 and the VIIRS (red) time series spans 2012–2020. The horizontal dotted line at 28% indicates the CONUS-wide value detected by MODIS from 2003–2020.

In a study of wildfires in the conterminous United States from 2003 to 2020 researchers found that while fire activity increased during the day in the 18-year period, it increased even more at night.

Heat sensing data from satellites showed significant increasing trends in nighttime wildfire fire activity, with a +54%, +42% and +21% increase in the annual nighttime sum of Fire Radiative Power (FRP), annual nighttime active fire pixel counts, and annual mean nighttime per-pixel values of FRP, respectively, in the latter half of the study period. Activity during the day increased also, with rates of +36%, +31%, and +7% respectively.

Analysis of coincident 1000-hour fuel moistures indicated that as fuels dried out, satellites detected increasingly larger and more intense wildfires with higher probabilities of nighttime persistence.


The information above is from the study “Large wildfire driven increases in nighttime fire activity observed across CONUS from 2003–2020,” by Patrick H. Freeborn, W. Matt Jolly, Mark A. Cochrane, and Gareth Roberts.

Average wildfire size, US, 1985-2000 (except Alaska)

The reason wildfires typically exhibit less activity at night is due to diurnal changes in weather. Nighttime generally brings lower temperatures, higher relative humidity, decreasing winds, and higher fuel moistures in light fuels.

But a warming climate with occasional multi-year droughts and higher temperatures can lead to nighttime higher temperatures and lower humidities. Drought will lower the fuel moistures in live and dead vegetation. These changes can result in fuels at night remaining available for significant and continuous fire spread. This is causing wildfires to burn with more intensity, spread more quickly, and have more resistance to control 24 hours a day.

Annual temperature change

About 15 to 20 years ago firefighters could usually count on wildfire activity slowing significantly at night as long as the wind was not extreme. Night shift crews could make good progress constructing direct fireline near the edge of fires. In the last few years weather and fuel conditions that permit direct attack by ground personnel, day or night, are less common. Fires are getting larger. Megafires that blacken 100,000 acres are no longer rare.

So now what?

As fires show increasing resistance to control we need to ramp up our fuel treatments, including prescribed fires, by a factor of 10. Less than full suppression of carefully selected fires when the season-ending weather event is on the horizon can have a place also, if they are very carefully planned and actively tracked and managed using all of the predictive tools available run by very smart, experienced personnel.

We also need to realize that we will never be able to prevent all wildfires from burning into populated areas, so property owners must realize they have to live with fire, using FireWise principles. Here are six things that need to be done to protect fire-prone communities.

And, community destruction during extreme wildfires is a home ignition problem. Here is an excerpt from the article written by Jack Cohen and Dave Strohmaier:

Uncontrollable extreme wildfires are inevitable; however, by reducing home ignition potential within the Home Ignition Zone we can create ignition resistant homes and communities. Thus, community wildfire risk should be defined as a home ignition problem, not a wildfire control problem. Unfortunately, protecting communities from wildfire by reducing home ignition potential runs counter to established orthodoxy.

We also have to realize that the fire suppression manpower staffing model that was created 50 years ago is obsolete. The agencies that fight wildfires, especially the federal agencies, need to increase the numbers of Interagency Hotshot Crews and engine crews. The crews must be configured and managed to allow personnel to have a reasonable amount of down time at the home unit even during the busiest times of the fire year. They can’t be away from home 90 percent of the time and expect to have a decent work/life balance. One National Forest will begin a pilot program in 2022 increasing the sizes of Hotshot and Engine crews to 30 and 10 people, respectively. This is intended to improve work/life balance and increase the availability of resources.

The reforms in the just-passed infrastructure bill to improve the pay and working conditions of firefighters must be implemented immediately. Slow-walking those improvements, a tactic too often used by the Federal agencies, should not be tolerated.

Technology needs to be adopted to make firefighting more safe and efficient. Firefighters down to the crew supervisor level should have access to real time data about the location of the fire and other firefighting resources 24 hours a day. Communications capabilities need to be robust and bomb proof.

On the afternoon of November 16, 2021 we initiated a 24-hour online poll on Twitter, asking for firefighters’ observations about nighttime wildfire activity.

Method developed to predict onset of strong winds 8-10 hours in advance

Upper-air profiles detected with sodar can measure upper-air winds before they begin at the surface

Sodar system
Sodar system used in the upper-air profiler pilot test. Image courtesy of Sonoma Technology.

A team of researchers with Pyregence have developed a system for predicting when strong upper-air winds will descend to the surface 8 to 10 hours in advance. Strong wind is the environmental factor that is virtually always present during catastrophic wildfire events that destroy hundreds of structures and put thousands of residents at great risk. Fuel conditions, humidity, and topography are also important factors, but few fires become fire storms without strong winds. Predicting the onset of a wind event can affect the deployment of firefighters, the tactics they employ on existing fires, and allow better decisions about preemptive power shutoffs, community warnings, and evacuations.

A device called sodar blasts a very loud 91-decibel pulsing beep into the sky which is then scattered by atmospheric turbulence back to the sodar, allowing profile calculations of wind speed, direction, and height.

Below is an excerpt from an article at Pyregence.org:


Profilers offer distinct advantages over other data collection methods. Most upper-atmosphere weather data is collected using radiosondes, instruments carried aloft, generally by balloon, two times a day. Profilers, by contrast, gather data two or three times every hour, and they also collect more detailed information throughout the lowest levels of the atmosphere—factors that allow for more accurate forecasts.

In 2003, for example, a profiler in New Mexico detected intensifying upper-air winds that had been missed by nearby radiosonde observations. The profiler helped forecasters accurately predict a midnight wind surge, giving fire crews the information they needed to rapidly contain the spread of the fire.

“Sodars have the ability to provide information that you can’t get from other instruments, and that are not available in the surface meteorological network,” says Kenneth Craig, a Senior Atmospheric Scientist and Meteorologist with Sonoma Technology, an environmental consulting firm that conducted the study for Pyregence.

DETECTING DESCENDING WINDS

For the Pyregence pilot test, the sodar system collected data from July 25 through October 26, 2020 [north of Santa Rosa in Northern California.]

Although a number of high-wind events occurred at the site during the pilot study period, a Diablo event that developed in late September proved particularly revealing.

Between 3 and 4 p.m. on September 25, strong winds developed 300–600 meters above ground level. Then, just after 1 a.m. that night, surface wind gusts of about 35 mph were recorded. The next day saw a similar pattern: strong winds developed aloft in the mid-afternoon and then gradually descended to the surface around midnight.

Both days, that is, saw high winds develop first in the upper atmosphere and then, about 8–10 hours later, descend to the surface. That time gap offers a window of opportunity to improve wildfire preparedness, especially during active fire situations.

[…]

BETTER DATA MEANS IMPROVED FIRE FORECASTS

The Extreme Weather Team concluded that a statewide network of strategically placed upper-air profilers could improve short-term forecasts of surface winds and help scientists who model fire behavior better understand the complex interactions of the atmosphere and wildfire.

How many sodars are needed? Although the scientists who led the study cautioned that they had not conducted a detailed analysis of this issue, they indicated that a relatively small number—perhaps in the range of 10–15 sodars carefully positioned across California—could dramatically improve the ability to predict strong winds.

“You don’t have to blanket every geographic area with instruments—there’s always a balance between the cost and the benefit,” Craig says. “But a handful of strategically placed sodars would fill gaps in our observing network and provide valuable information to support situational awareness and forecasting efforts.”

Characteristics of structures that burned in the 2018 Camp Fire

The blaze in Northern California destroyed 18,804 structures, most of which were in Paradise

Camp Fire structures
Aerial image showing a portion of Magalia just NW of Paradise, illustrating a gradient of fire damage to overstory vegetation with distance from destroyed homes. At least in some areas, burning homes may have influenced the effects to overstory vegetation more so than burning overstory vegetation influenced the outcome to homes. Photo: Owen Bettis, Deer Creek Resources.

In a paper published October 4, 2021, researchers analyzed the structures that were destroyed and those that survived the Camp Fire that ran through the city of Paradise, California in 2018. They considered at least four primary characteristics of structures:

  • Were they built before or after the adoption in 2008 of Chapter 7A of the California Building Code which requires certain fire resistance measures, including exterior construction materials used for roof coverings, vents, exterior walls, and decks and applies to new construction of residential and commercial buildings in designated fire hazard severity zones.
  • Distance to nearest destroyed structure.
  • Number of structures destroyed within 100 meters.
  • Pre-fire overstory tree canopy within 100 meters

They found that the last three criteria were the strongest predictors of survival. Homes more than 18 meters from a destroyed structure and with less than 53 percent pre-fire overstory canopy within 30 to 100 meters survived at a substantially higher rate than homes in closer proximity to a destroyed structure or in areas with higher pre-fire overstory canopy. Most fire damage to surviving homes appeared to result from radiant heat from nearby burning structures or flame impingement from the ignition of near-home combustible materials. The researchers concluded that building and vegetation modifications are possible that would substantially improve outcomes. Among those include improvements to windows and siding in closest proximity to neighboring structures, treatment of wildland fuels, and eliminating near-home combustibles, especially within 1.5 meters of the structure.

The authors noted that while 7a includes requirements not found in many building codes, a few others are more complete incorporating multiple construction classes based on anticipated radiant heat, flame, and ember exposure levels. For example Chapter 7A does not consider the interaction between components such as siding, window, and the under-eave area on an exterior wall.

There is an opportunity for much needed improvement in both current building codes and how we live in wildfire prone WUI areas.

Below is the complete Conclusion section from the research.


Conclusions

The results of this study support the idea that both proximities to neighboring burning structures and surrounding vegetation influence home survival with wildfire. Denser developments, built to the highest standards, may protect subdivisions against direct flame impingement of a vegetation fire, but density becomes a detriment once buildings ignite and burn.

Recent examples of losses in areas of higher density housing include the wind-driven 2017 Tubbs Fire in northern California, where house-to-house spread resulted in the loss of over 1400 homes in the Coffey Park neighborhood (Keeley and Syphard 2019), and the wind-driven 2020 Almeda Fire in southern Oregon, which destroyed nearly 2800 structures, many in denser areas in the towns of Talent and Phoenix (Cohen and Strohmaier 2020). Once fire becomes an urban conflagration, proximity to nearby burned structures becomes especially important because occupied structures contain significant quantities of fuel, produce substantial heat when burned, and are a source of additional embers. For density to be protective, home and other structure ignitions would need to be rare.

Fifty-six percent of homes in Paradise built during or after 2008 did not survive, illustrating that much improvement is needed in both current building codes and how we live in wildfire prone WUI areas before proximity to nearby structures becomes a benefit rather than a vulnerability. The threat posed by nearby burning structures as well as our finding of an apparent strong influence of vegetation 30–100 m from the home—a distance that in most cases encompasses multiple adjacent properties—demonstrates that neighbors need to work together to improve the overall ability of homes and communities to resist wildfire exposures.

To maximize survivability, homes need to be designed and maintained to minimize the chance of a direct flame contact, resist ember ignition, and survive extended radiant heat exposure. Our analyses demonstrating the strong influence of nearby burning structures on home survival suggests improvements to resist radiant heat exposures may be warranted in the California Building Code—i.e., increasing the standards for buildings within a certain minimum distance of other structures.

Some possible improvements might include noncombustible siding with rating minimums tied to proximity to other structures, both panes in windows consisting of tempered glass, or installation of deployable non-combustible shutter systems. Additionally, certain options for complying with Chapter 7A are better for resisting radiant heat and flame contact exposures and could minimize fire spread to other components. Whereas the International Code Council’s Wildland Urban Interface Building Code (International Code Council 2017) provides three ignition-resistant construction classes to allow for material restrictions as a function of exposure level, Chapter 7A consists of one level, so is binary in nature in that a building either needs to comply, or it does not. The Australian building code for construction in bushfire prone areas, AS 3959 (Standards Australia 2018), incorporates six different construction classes based on anticipated radiant heat, flame, and ember exposure levels. Interaction between components, for example, siding, window, and the under-eave area on an exterior wall, is not considered.

Our summary of damaged but not destroyed homes in Paradise was in line with other reports showing a high proportion of home ignitions indirectly resulting from embers (Mell et al. 2010). Embers frequently ignited near home combustibles such as woody mulch, fences, and receptive vegetative fuels with flames and/or associated radiant heat then impacting the home itself, supporting awareness of the importance of combustibles within the first 1.5 m (5 ft) of the building on home survival.

A re-interpretation of defensible space fuel modifications is needed to increase the building’s resistance and exposure to embers and direct flame contact, especially in the area immediately around a building and under any attached deck or steps. This does not diminish the value of defensible space fuel modifications 9 to 30 m (30 to 100 ft) away from the home, which not only reduces fuel continuity and the probability of direct flame contact to the home, but also provides firefighters a chance to intervene.

While our data show a relationship between home loss and vegetative fuels (high pre-fire overstory canopy cover likely associated with a greater litter and woody fuel abundance, as well as other wildland understory vegetation) that can contribute to fire intensity and ember generation, the WUI fire loss issue has been described as home ignition problem more so than a wildland fire problem (Cohen 2000; Calkin et al. 2014). The damaged home data were in line with this view, with few homes showing evidence of continuity with wildland fuels that would contribute to flame impingement, but numerous homes with near home fuels, both from manmade and natural sources, that led to direct or indirect ember ignitions.

California’s Mediterranean climate will continue to challenge its residents with regular wildfire exposure throughout the state. Whether through modifying the nearby surface and vegetative wildland fuels or the home itself, adapting to wildfire will take time. The good news is that the trend in survival is improving with newer construction practices. However, with 56% of houses built after 2008 still succumbing to the Camp Fire, much room for improvement remains.

Our data suggest it is possible to build (and maintain) buildings that have a high probability of surviving a worst-case scenario type of wildfire, even in fire-prone landscapes such as the Paradise area. Newer homes built after 1972, where the nearest burning structure was >18 m away, and fuels associated with vegetation 30–100 m from the home kept at moderate and lower levels (<53% canopy cover) had a 61% survival rate—an approximately 5-fold improvement over the Paradise housing population as a whole. Survival percentages substantially higher still are potentially possible if all components of risk, including ember generation in nearby wildland fuels, continuity of wildland and other fuels on the property, and home ignitability are sufficiently mitigated.


Citation:

Knapp, E.E., Valachovic, Y.S., Quarles, S.L. et al. Housing arrangement and vegetation factors associated with single-family home survival in the 2018 Camp Fire, California. fire ecol 17, 25 (2021). https://doi.org/10.1186/s42408-021-00117-0

EPA attempts to compare smoke impacts from wildfires and prescribed fires

Releases 438-page report

8:08 a.m. MDT Oct. 1, 2021

EPA study, prescribed fire and wildfire

The release of a 438-page study by the US Environmental Protection Agency to compare the smoke impacts from prescribed vs. wildfire is not a ground-breaking event that will change fire management.

Titled, “Comparative Assessment of the Impacts of Prescribed Fire Versus Wildfire (CAIF): A Case Study in the Western U.S.”, the large 28MB .pdf file can be downloaded here.

In January 2020, the Wildland Fire Leadership Council, an intergovernmental committee formed to support the implementation and coordination of Federal Fire Management Policy and chaired by senior leadership in the U.S. Department of Agriculture and Department of the Interior, requested and paid for the EPA to lead an assessment to characterize and compare the smoke impacts of prescribed fire and wildfire under different fire management strategies, including prescribed fire.

They evaluated two fires, the 3,000-acre Timber Crater 6 Fire that occurred in Oregon in 2018 and the 150,000-acre Rough Fire of 2015 in the Sierra NF, Kings Canyon National Park, and Sequoia NF of California. I could not find any indication that the researchers studied a prescribed fire, which usually burn with different fire behaviors than a wildfire.

The poorly edited report is not light reading and is a slog to wade through the hundreds of pages.

Many of the report’s “key insights” will not be a surprise to land managers (or anyone with a little common sense and exposure to fire management). Here are samples from Chapter 9, “Integrated Synthesis”:

  • Smaller wildfires produce fewer public health impacts than larger wildfires.
  • Convincing the public to evacuate or use air cleaners or HVAC filters to decrease exposure to PM2.5 can decrease public health impacts from smoke.
  • If a wildfire spreads into an area previously treated with prescribed fire it can reduce additional spread of the wildfire.
  • Smoke plumes that do not intersect with high population areas or last only a few days are less likely to have substantial health impacts than fires affecting larger populations for longer periods.

Update at 3:19 p.m. Oct. 1, 2021:

After publishing the article above, we heard from Bob Yokelson with the Department Chemistry at the University of Montana. He and others have produced data showing the differences between smoke produced by prescribed fires and wildfires. It’s all in their paper, “Aerosol Mass and Optical Properties, Smoke Influence on O3, and High NO3 Production Rates in a Western U.S. City Impacted by Wildfires.”

Here is the passage Mr. Yokelson sent us:

“We stress that there is now more than 1,000 hr of ground‐based data from Missoula, suggesting that a typical PM2.5/CO value for aged wildfire smoke at the surface is about half the value in fresh to moderately aged well‐lofted wildfire plumes (Collier et al., 2016; Garofalo et al., 2019; Liu et al., 2017). One airborne wildfire study by Forrister et al. (2015) at lower latitudes and sampling elevations than the other airborne studies is consistent with the downwind net evaporation we apparently observe in Missoula.

“We also stress that, despite the evidence for PM evaporation during aging, there are strong data discussed next, supporting the idea that wildfires produce more PM than spring or fall prescribed fires on a per fuel burned or per area burned basis. Liu et al. (2017) reported that EFs for PM1.0 (gPM1.0/kg fuel burned) are almost four times higher in wildfires (27.1 ± 6.1) than spring and fall prescribed fires (7.3 ± 4.2; May et al., 2014). Our 2 year average ΔPM2.5/ΔCO ratio in aged wildfire smoke (~0.117) is ~1.7 times higher than implied for aged, fall western montane prescribed fire smoke (~0.07) based on May et al. (2014, 2015), suggesting that a remnant of the difference in initial PM emissions can survive aging. Fuel consumption in spring/fall prescribed fires at the national level is typically 7.2 ± 2.7 Mg ha−1 (Yokelson et al., 1999, 2013) as opposed to 34.6 ± 9.9 Mg ha−1 on wildfires (Campbell et al., 2007; Santín et al., 2015).

Combining the emissions and fuel consumption differences implies that wildfires emit 18 ± 14 times more PM per area burned. Although prescribed fires cannot simply replace all wildfires (Schoennagel et al., 2017; Turner et al., 2019), their potential to reduce the level of wildfire impacts deserves more attention. In addition, incorporating higher wildfire initial emissions and temperature‐dependent, post emission OA evaporation may improve models of wildfire smoke impacts (Nergui et al., 2017).”

Citation:
Selimovic, V., Yokelson, R. J., McMeeking, G. R., & Coefield, S. (2020). Aerosol mass and optical properties, smoke influence on O3, and high NO3 production rates in a western U.S. city impacted by wildfires. Journal of Geophysical Research: Atmospheres, 125, e2020JD032791. https://doi.org/10.1029/2020JD032791

Billions in losses, thousands could die if wildfire response unchanged: report

Cub Creek 2 Fire
Cascade Type 2 IA crew on Cub Creek 2 Fire in Northern Washington, July 25, 2021. InciWeb.

A team of scientists from British Columbia, the United States, and Spain say Western Canada must address the threats posed by highly destructive wildfires or face deadly consequences.

The scientists, including Mathieu Bourbonnais, assistant professor of earth and environmental sciences at the University of British Columbia Okanagan, predict devastating wildfires such as those currently burning in B.C. and elsewhere in the country will be commonplace by 2050.

The group has released a paper predicting billions of dollars in suppression and indirect fire costs as well as hundreds or thousands of premature deaths due to exposure to wildfire smoke if climate change and fire causes are not resolved.

The warning comes as statistics from the B.C. government show 1,251 wildfires have charred more than 4,500 square kilometres of bush since the start of the fire season on April 1.

Three dozen of those blazes are considered extremely threatening or highly visible and include the 395 square kilometre fire southwest of 100 Mile House that remains out of control and prompted an evacuation alert for another 161 properties on Wednesday.

Environment Canada has issued heat warnings or special weather statements for inland sections of the north and central coasts and much of southern B.C., as the BC Wildfire Service warns the combination of high temperatures and low relative humidity will make wildfires even more intense.

Bourbonnais, who spent years working as a wildland firefighter, says in a statement that a new long-term plan is needed because it’s simplistic and insufficient to blame the wildfire crisis on the forest sector or wildland fire management agencies.

“Wildfires affect so many facets of our society and environment including health, the economy, biodiversity, ecosystem function and more,” he says in the release.

“Wildland fire management must engage additional proponents, including Indigenous Peoples, industry and communities, to help people learn to live with the realities of landscapes and ecological systems that include wildfires but, over time, work to reduce their more catastrophic effects.”

The economic and social costs of wildfire response are unsustainable, the scientists argue.

First published by The Canadian Press