Joint Fire Science Program produces map of firefighter burnovers

Map of firefighter burnovers
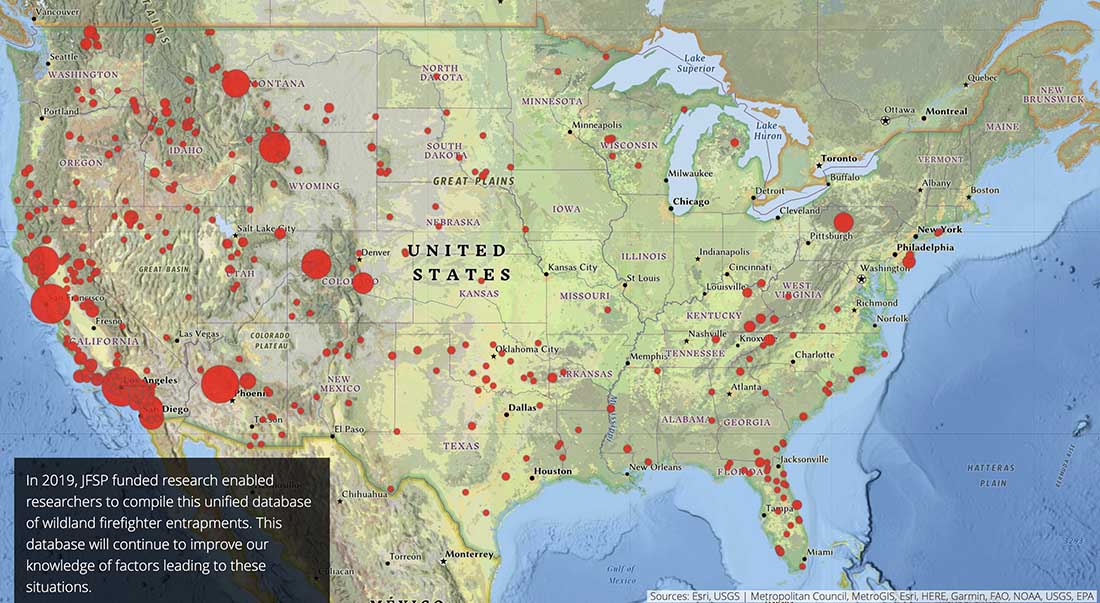
Screenshot of a map of firefighter burnovers. The size of the circle is proportional to the number of personnel involved. JFSP, November, 2020.

The Joint Fire Science Program (JFSP) has produced a story map highlighting some of the organization’s success stories, in particular their research in entrapment avoidance, safety zones, and escape routes.

The screenshot above is from an interesting interactive map in the presentation showing the locations where wildland firefighters were burned over by fires. The size of the circle is proportional to the number of personnel involved in each incident, but not every burnover resulted in fatalities. A click on the circle brings up a few details about the incident.

The JFSP was established by Congress in 1998 and is jointly funded by the Department of the Interior and the U.S. Forest Service. The Joint Fire Science Plan written then, (linked to on their website) says the organization “will address issues critical to the success of the fuels management and fire use program.”

In FY 2017, 16 of the 22  JFSP approved and funded research projects were various ways of studying vegetation. Back then we wrote:

It would be refreshing to see more funds put toward projects that would enhance the science, safety, and effectiveness of firefighting.

Since then the emphasis has shifted a little — in a good way. In FY 2020 their research grants were for projects on one of two topics:

  1. Effectiveness of fuel breaks and fuel break systems.
  2. Reducing damages and losses to valued resources from wildfire.

And in FY 2021: (they expect total funding to be $1.5 to $3.5 million):

  1. Sources and distribution of human-caused ignitions and their relation to wildfire impacts.
  2. Reducing damages and losses to valued resources from wildfire.

Wildfire Today continues to advocate for the the JFSP to place a major emphasis on developing science that can be directly used by wildland fire personnel to enhance their safety, firefighting efficiency, and reduce the undesirable and sometimes catastrophic effects of uncontrolled wildfires on citizens, infrastructure, and property. If the JFSP Plan needs to be revised to accomplish this, then let’s get it done.

Smoke cloud from Australia’s wildfires was three times larger than anything previously recorded

Smoke from the summer of 2019-2020 blocked sunlight from reaching Earth to an extent never before recorded from wildfires

SAOD perturbationResearchers with the University of Saskatchewan’s Institute of Space and Atmospheric Studies are part of a global team that has found that the smoke cloud pushed into the stratosphere by last winter’s Australian wildfires was three times larger than anything previously recorded.

The cloud, which measured 1,000 kilometers across, remained intact for three months, travelled 66,000 kilometers, and soared to a height of 35 kilometers above Earth. The findings were published in Communications Earth & Environment, part of the prestigious Nature family of research journals.

“When I saw the satellite measurement of the smoke plume at 35 kilometers, it was jaw dropping. I never would have expected that,” said Adam Bourassa, professor of physics and engineering physics, who led the USask group which played a key role in analyzing NASA satellite data.

Prior to Australia’s “Black Summer,” which burned 5.8 million hectares of forest in the southeast part of that continent, the smoke cloud caused by the 2017 forest fires in Western Canada was the largest on record.

The international team was led by Sergey Khaykin from LATMOS (Laboratoire Atmosphères, Milieux, Observations Spatiales) in France. Bourassa said the team’s findings provide critical information for understanding how wildfires are impacting the Earth’s atmosphere.

“We’re seeing records broken in terms of the impact on the atmosphere from these fires,” said Bourassa. “Knowing that they’re likely to strike more frequently and with more intensity due to climate change, we could end up with a pretty dramatically changed atmosphere.” Bourassa, his post-doctoral student Landon Rieger, and research engineer Daniel Zawada were the only Canadians involved in the project. Bourassa’s group has expertise in a specific type of satellite measurement that is very sensitive to smoke in the upper atmosphere. Their contributions were funded in part by the Canadian Space Agency. According to Bourassa, wildfires such as those in Australia and Western Canada get big enough and hot enough that they generate their own thunderstorms, called Pyrocumulonimbus. These, in turn, create powerful updrafts that push smoke and the surrounding air up past the altitudes where jets fly, into the upper part of the atmosphere called the stratosphere.

“What was also really amazing was that as the smoke sits in the atmosphere, it starts to absorb sunlight and so it starts to heat up,” said Bourassa. “And then, because it’s getting hotter, it starts to rise in a swirling vortex ‘bubble’, and it just rose and rose higher and higher through the atmosphere.”

Information collected by satellite, using an instrument called a spectrometer, showed smoke from the Australian wildfires blocked sunlight from reaching Earth to an extent never before recorded from wildfires.

The measurement technique, proven by Canadian scientists including Bourassa over a decade ago, measures the sunlight scattered from the atmosphere back to the satellite, generating a detailed, image of layers in the atmosphere.

The stratosphere is typically a “pretty pristine, naturally clean, stable part of atmosphere,” Bourassa said. However, when aerosols–such as smoke from wildfires or sulphuric acid from a volcanic eruption–are forced up into the stratosphere, they can remain aloft for many months, blocking sunlight from passing through, which in turns changes the balance of the climate system.

While researchers have a general understanding of how these smoke clouds form and why they rise high into the stratosphere, Bourassa said more work needs to be done to understand the underlying mechanisms.

Researchers will also be comparing their findings from Australian wildfires with satellite data captured from California wildfires this past summer and fall.

(From the University of Saskatchewan)

Award granted to develop system to detect and forecast the spread of all wildland fires in U.S.

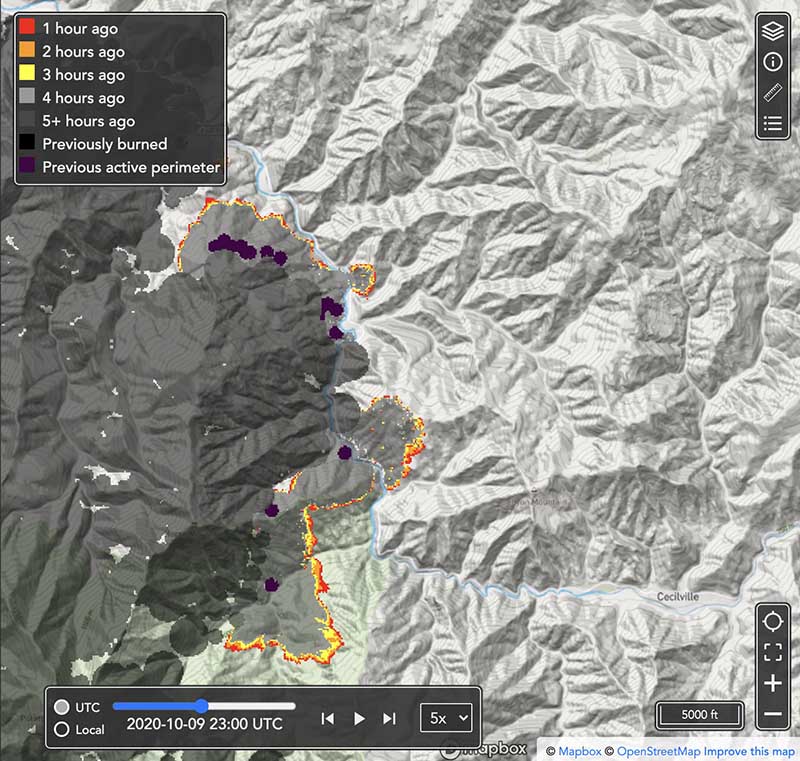
Pyregence fire forecasting tool
Pyregence fire forecasting tool, beta version. Forecast for the northeast side of the Red Salmon Complex of fires in Northern California at 4 p.m. PDT October 9, 2020.

The U.S. Department of Commerce’s National Institute of Standards and Technology (NIST) has awarded 19 small businesses in 12 states a total of more than $4.4 million in grants to support innovative technology development. One of those grants, for $100,000, is to help build a system for automatically detecting and forecasting the spread of every wildfire in the continental United States and updating the forecasts as conditions change.

Reax Engineering Inc. of Berkeley, California, the company that received the grant, has a beta version of the forecasting tool online now just for the state of California. It is a work in progress and will eventually include data for fires in other  states.

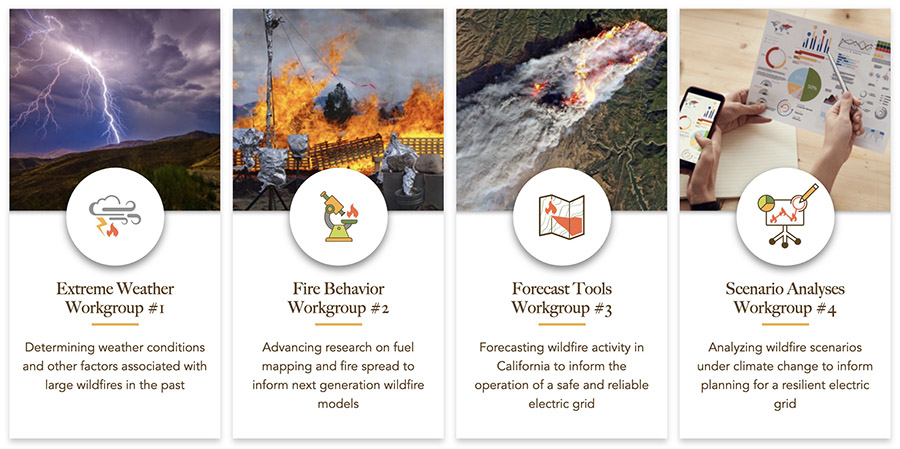
Wildfire forecasting is one of the four primary goals of Pyregence, a group of fire-science labs and researchers collaborating about wildland fire, where the forecasting tool now resides. The organization brings together initiatives and leading researchers from 18 institutions representing industry, academia, and government in an effort to transform how wildfire mitigation and adaptation measures are implemented. In addition to forecasting wildfire activity, wildfire scenario analyses will be produced to inform future wildfire risk and California’s 5th Climate Change Assessment, using open science and technology principles.

Pyregence working groups
Pyregence working groups.

In order to predict the spread of wildfires, fire behavior models are run on computers. The versions that have been used for decades are not accurate for dealing with heavy dead and down fuels or fires spreading through the crowns of trees under extreme weather conditions. The goal of one of the four Pyregence workgroups, the Fire Behavior Workgroup, is to improve existing models or develop new ones. That effort is being led by Scott Stephens, Professor of Fire Science, and director of the University of California Center for Fire Research and Outreach.

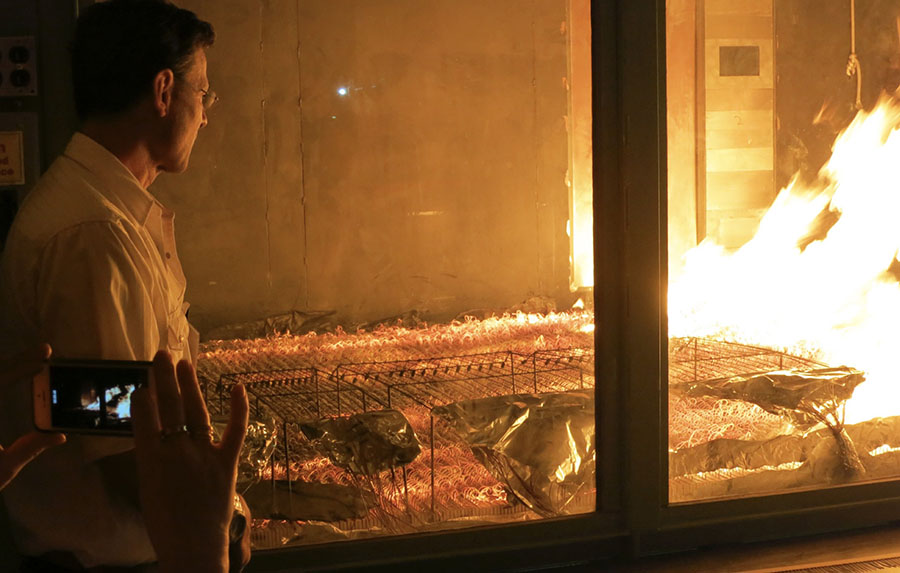
Missoula Fire Lab burn chamber
U.S. Forest Service Missoula Fire Lab burn chamber, May 21, 2014. Photo by Bill Gabbert.

Mark Finney, a researcher at the U.S. Forest Service Missoula Fire Sciences Laboratory, is part of the Fire Behavior Workgroup and will soon have access to a burn chamber much larger than the one in the photo above. It will reportedly be the size of a grain silo. These wind tunnel/combustion chambers are used to conduct burning experiments in a controlled environment under varying fuel, temperature, humidity, and wind conditions. It can lead to a better understanding of how vegetation burns, leading to improvements in predicting fire spread.

An article at Wired describes the planned burn chamber:

Once complete, that chamber will let him replicate wildfire fuel beds by piling logs and other material as much as a few feet deep. He will then ignite them, hit them with wind and moisture, and quantify their burn rate and energy-­release rate—what he calls the “heat-engine part of mass fires.”

“Really what we’re looking for,” Finney says, “is how these things transition to flaming. Instead of just smoldering on the forest floor, how do they become actively involved in these large fires?”

If all goes well, Finney’s working group will eventually code three-dimensional digital simulations of various wildland fuel beds—digital cubes, in essence, not unlike Minecraft voxels—that can be stacked and arranged in infinite variation across landscapes generated by GIS mapping data.

Researchers flying over wildfire detected 130 mph updrafts in smoke plume

And, downdrafts reaching 65 mph

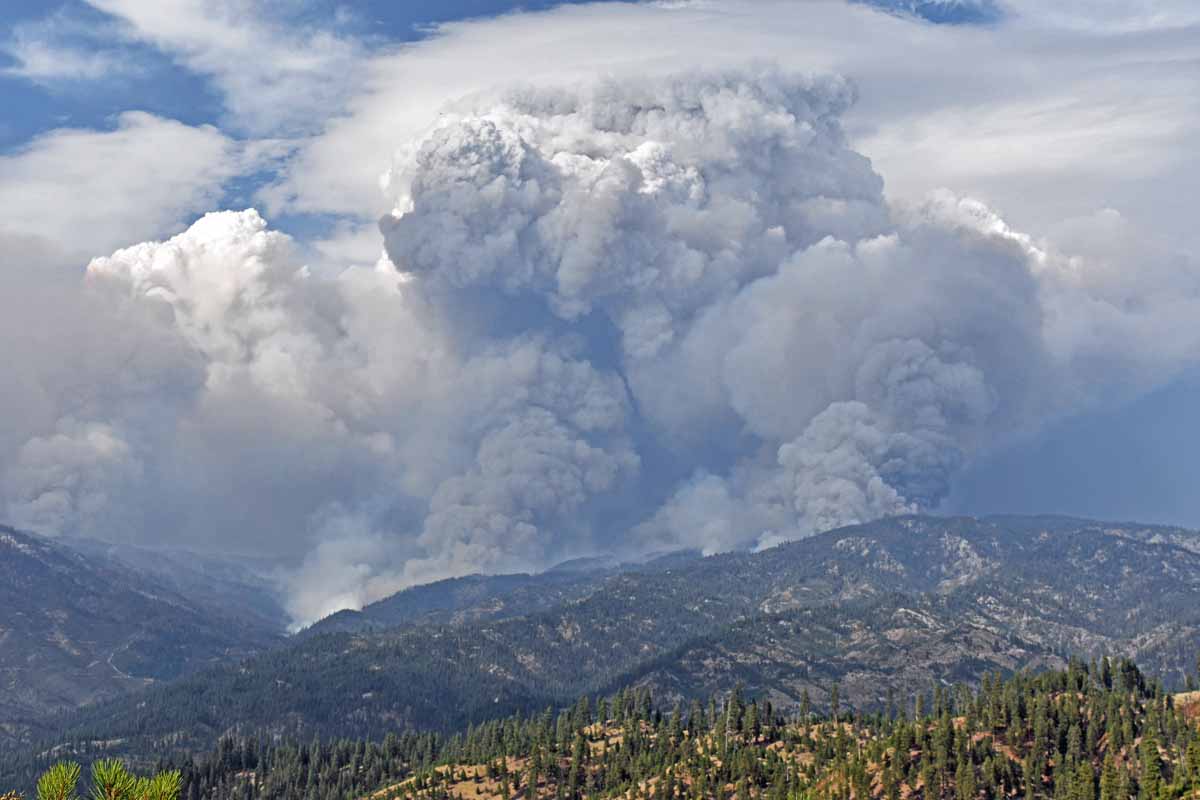
Pioneer Fire
Smoke plume with pyrocumulus over the Pioneer Fire, posted on Inciweb August 29, 2016.

Researchers flying near smoke plumes over a large wildfire found extreme updrafts up to 130 mph and downdrafts reaching 65 mph. Operating radar and other sensing equipment in a small plane, one of the scientists was injured as the aircraft experienced a dramatic vertical displacement as it penetrated a 34-meters-per-second updraft in a plume over a flank of the 2016 Pioneer Fire in Idaho.

This is the first time the vertical velocity structure of a pyroconvective updraft has been viewed in such detail. The research showed that intense fires can produce updrafts that rival or exceed those in tornadic supercell thunderstorms.

An unexpected finding was that the updrafts strengthened with height above the surface, at least initially, challenging the assumption that they should decelerate with height.

The updrafts, the strongest ever documented, can be a hazard to aviation since they do not always show up on pilots’ weather avoidance radars, as discovered during a Qantas flight over a bush fire in Australia in January, 2020. Passengers experienced turbulence and darkness as the airliner entered the pyrocumulus cloud.

"There was one guy sort of swearing … I heard people down the front vomiting."

Another passenger said it was "the scariest flight" she had taken.
smoke plume research convection column pyrocumulus
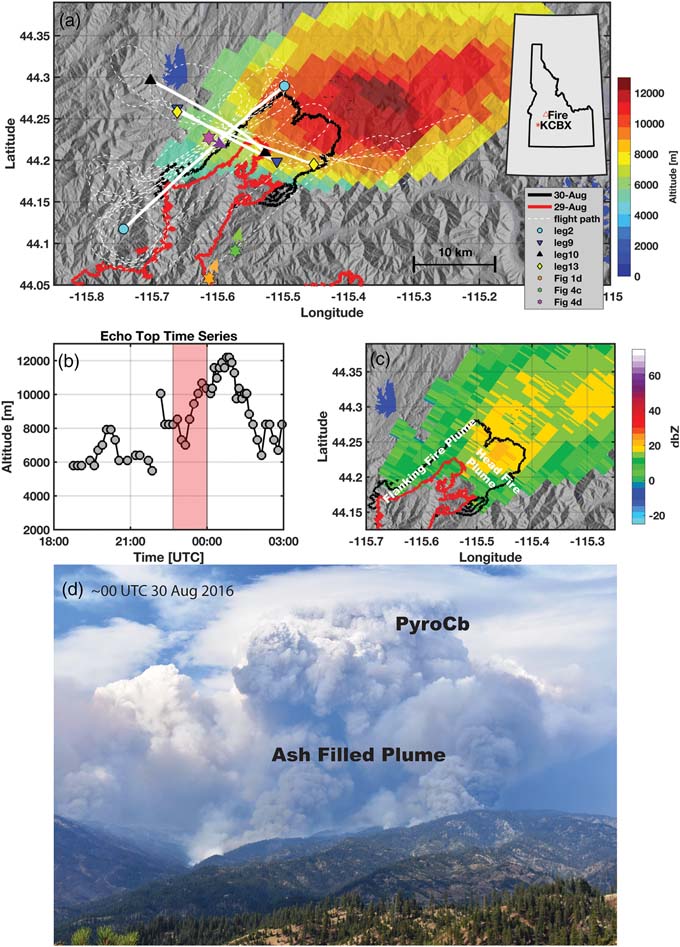
Overview of the PyroCb topped plume rising from the Pioneer Fire on 29 August 2016. (a) Map showing the fire perimeters, flight legs, locations of photos (triangle markers), terrain (hillshaded), and KCBX radar‐derived plume “echo top” heights (color shaded). (b) KCBX echo top time series showing rapid plume growth and the flight interval (red shaded). (c) Time mean KCBX radar reflectivity during the flight interval with head and flanking fire plumes annotated. (d) Photograph from the Boise National Forest at ~00 UTC 30 August 2016 showing the head fire plume and the transition from the ash‐filled lower plume to the pyroCb aloft. (from the research)

These findings are presented in a paper published September 9, 2020 written by B. Rodriguez, N. P. Lareau, D. E. Kingsmill, and C. B. Clements.

Convection column Pioneer Fire
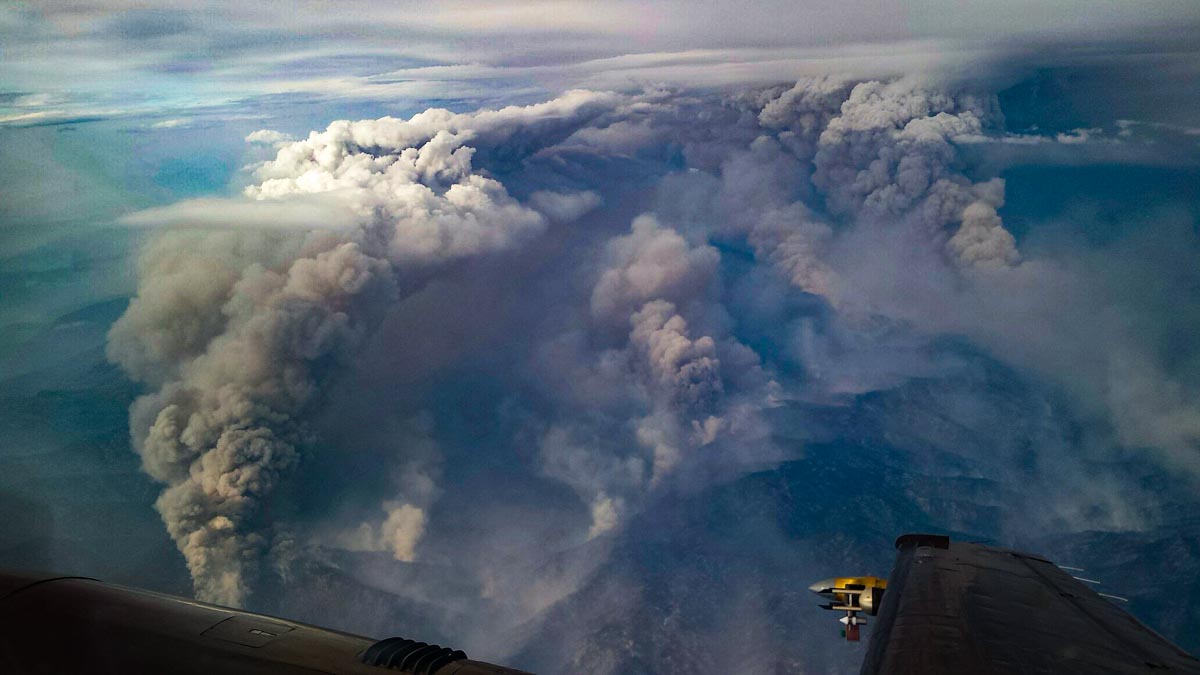
Convection column with pyrocumulus over the Pioneer Fire, August 30, 2016. Photo by Nick Guy of the University of Wyoming.

Researchers determine escape route travel times for firefighters

Granite Mountain Hotshots hike to the fire, June 30, 2013
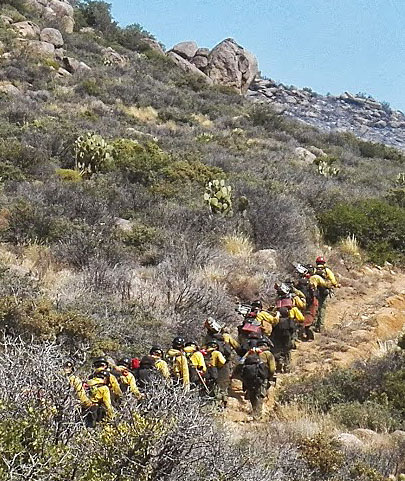
Granite Mountain Hotshots hike to the Yarnell Hill Fire, the morning of June 30, 2013. Photo by Joy Collura.

When crews of wildland firefighters in a remote area have to quickly move to a safer location due to an approaching flaming front, they hike on what they call an escape route to get to a safety zone where they can be out of danger without having to deploy their fire shelters. An average of 11 firefighters die each year while fighting fire. Of these deaths, about 44 percent are caused by entrapment or burnover events.

A key to moving to a safety zone is the travel time. Underestimating the required time can be fatal, in the worst of circumstances. That may or may not have been one of the many factors involved in the deaths of 19 firefighters on the 2013 Yarnell Hill Fire in Arizona.

Firefighters know how long it takes them to hike the three miles within less than 45 minutes while carrying 45 pounds as required by the Pack Test, or Work Capacity Test. From that it’s pretty easy to calculate their miles per hour. But that is on flat ground, a situation that is not always the case when escaping from a wildfire. Throw in steep uphill or downhill slopes, and the times will increase.

Previous research on the subject includes:

A new study uses a different database for the speed at which fire crews can hike. It is titled, “Modeling Wildland Firefighter Travel Rates by Terrain Slope: Results from GPS-Tracking of Type 1 Crew Movement.” (download, 2.3 Mb)

As the name implies, instead of using public crowd-sourced hiking speed data, the researchers issued GPS units to nine Type 1 Interagency Hotshot Crews in the Spring of 2019. Nine of the 11 participating IHCs received seven GPS units each, and the other two received 20 GPS units each. In addition to the GPS units, crews were provided with data collection sheets and armbands to carry the GPS units.

Using data collected by firefighters — a uniquely physically fit population that usually carries heavy loads while moving —  provides a set of robust, adjustable travel rate models built from instantaneous travel rate data that can be applied in a variety of contexts.

The data was collected while on training hikes. Rather than rely on GPS for elevation, which is not always accurate, only locations having the more accurate lidar data were used.

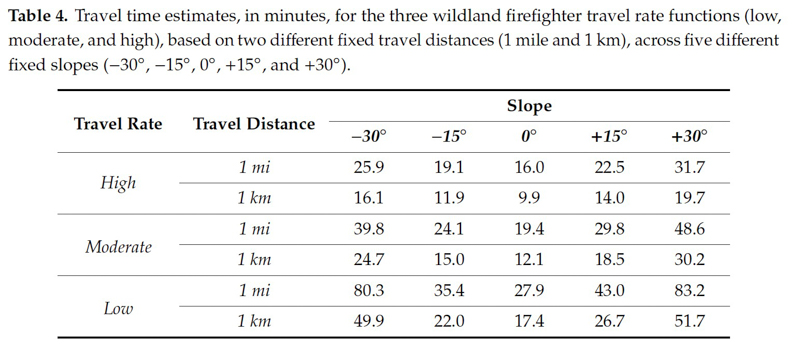
The tables below are from the research paper.

Results -- travel times by slope


Demographics of the Type 1 crews.

Here is an excerpt from the paper:

“The effects of the slope on the instantaneous travel rate were assessed by three models generated using non-linear quantile regression, representing low (bottom third), moderate (middle third), and high (upper third) rates of travel, which were validated using k-fold cross-validation. The models peak at about -3o (downhill) slope, similar to previous slope-dependent travel rate functions. The moderate firefighter travel rate model mostly predicts faster movement than previous slope-dependent travel rate functions, suggesting that firefighters generally move faster than non-firefighting personnel while hiking. Steepness was also found to have a smaller effect on firefighter travel rates than previously predicted. The travel rate functions produced by this study provide guidelines for firefighter escape route travel rates and allow for more accurate and flexible wildland firefighting safety planning.”


The authors of the paper are, Patrick R. Sullivan, Michael J. Campbell, Philip E. Dennison, Simon C. Brewer, and Bret W. Butler.

Scientist says more fire tornados are being reported at wildfires this year

Researcher uses radar data to make three-dimensional maps of smoke plumes

Radar rendering of smoke plume over the Creek Fire
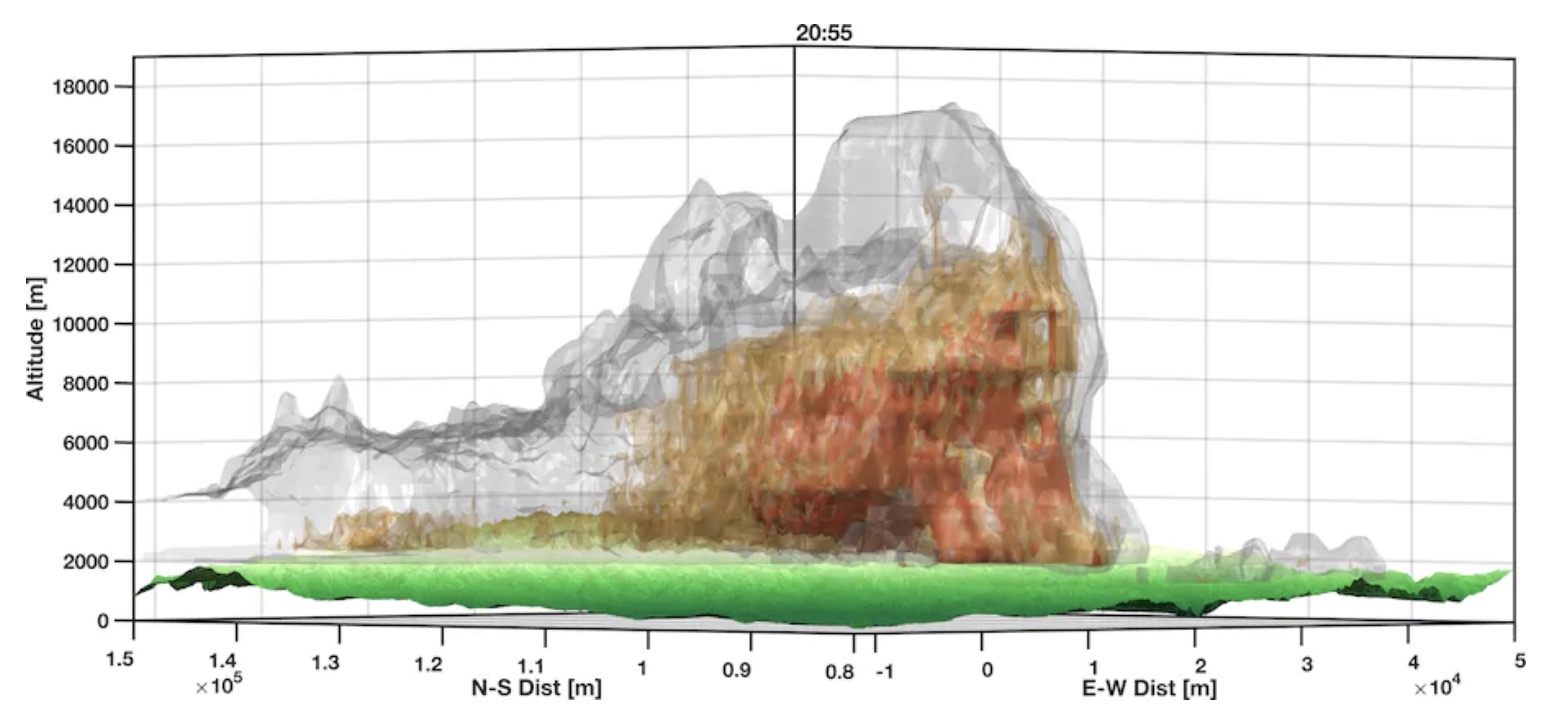
Radar rendering of smoke plume over the Creek Fire. By Neil Lareau, University of Nevada Reno.

The extreme heat caused by a large high pressure system in the West has led to an unusual number of fire tornados.

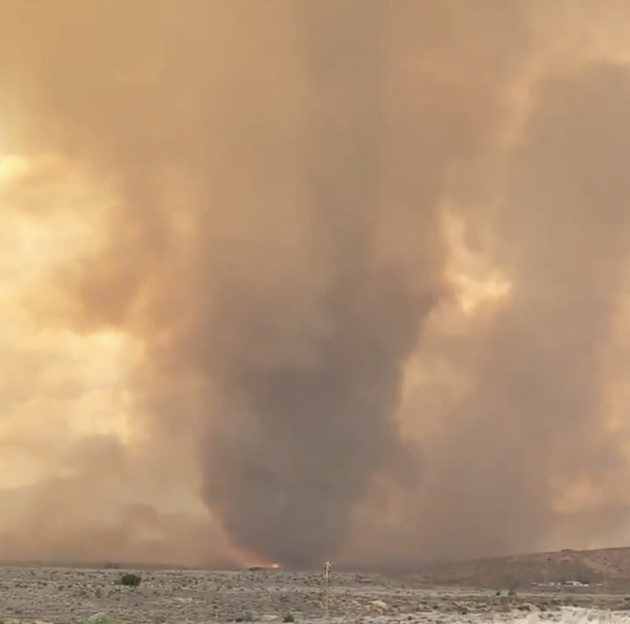
An article in the Washington Post by Matthew Cappucci explains how Neil Lareau, a professor of atmospheric sciences in the department of physics at the University of Nevada at Reno, used detailed weather radar data to make three-dimensional maps of smoke plumes over fires. While it is unusual to have a fire tornado anytime, the data indicates that on at least three fires this year fire tornados have been detected by radar. One was photographed on the Loyalton Fire August 15 about 12 miles northwest of Reno, Nevada. National Weather Service meteorologists who spotted it on radar issued the agency’s first-ever fire tornado warning.

Fire tornado Loyalton Fire
Fire tornado on the Loyalton Fire, by @DVRockJockey August 15, 2020.

Fire tornados and huge smoke plumes topped by massive pyrocumulus clouds are indicators of extreme fire behavior. There is absolutely nothing firefighters or aircraft can do to slow a blaze under those conditions — and those pyrocumulus clouds seem to be occurring more frequently this year.

Creek Fire
Creek Fire September 5, 2020. IMT photo.

The day after the Creek Fire started, its smoke plume grew to 55,000 feet, taller than the tornadic thunderstorms seen in Oklahoma and Kansas in the the spring.

From the Post:

“Anecdotally, this is the deepest that I’ve seen,” said Lareau, who was shocked by the height achieved by the smoke plume. “It’s about a solid 10,000 feet higher than we’re typically seeing with the highest of these plumes.”

Before 2020, only a few fires had ever produced documented fire tornadoes in the United States; now we’re seeing them every week or two. Lareau says the tremendous heights of the wildfires’ clouds, combined with more concerted and astute observation, are factors in the numerous fire tornadoes that have been reported this year. He thinks there may also be some truth to the apparent increase.

“We have a ton of eyes on every fire, looking at every frame, but still, we weren’t seeing these before,” he said. “And we’re seeing all too much of it right now. It’s rather worrying.”

Thanks and a tip of the hat go out to Jim.