Wildfire smoke worsens coronavirus risk, putting firefighters in extra danger

Researchers found that wildfire smoke exposure can lead to an increase of other pathogens in lungs.

Norbeck prescribed fire Wind Cave National Park
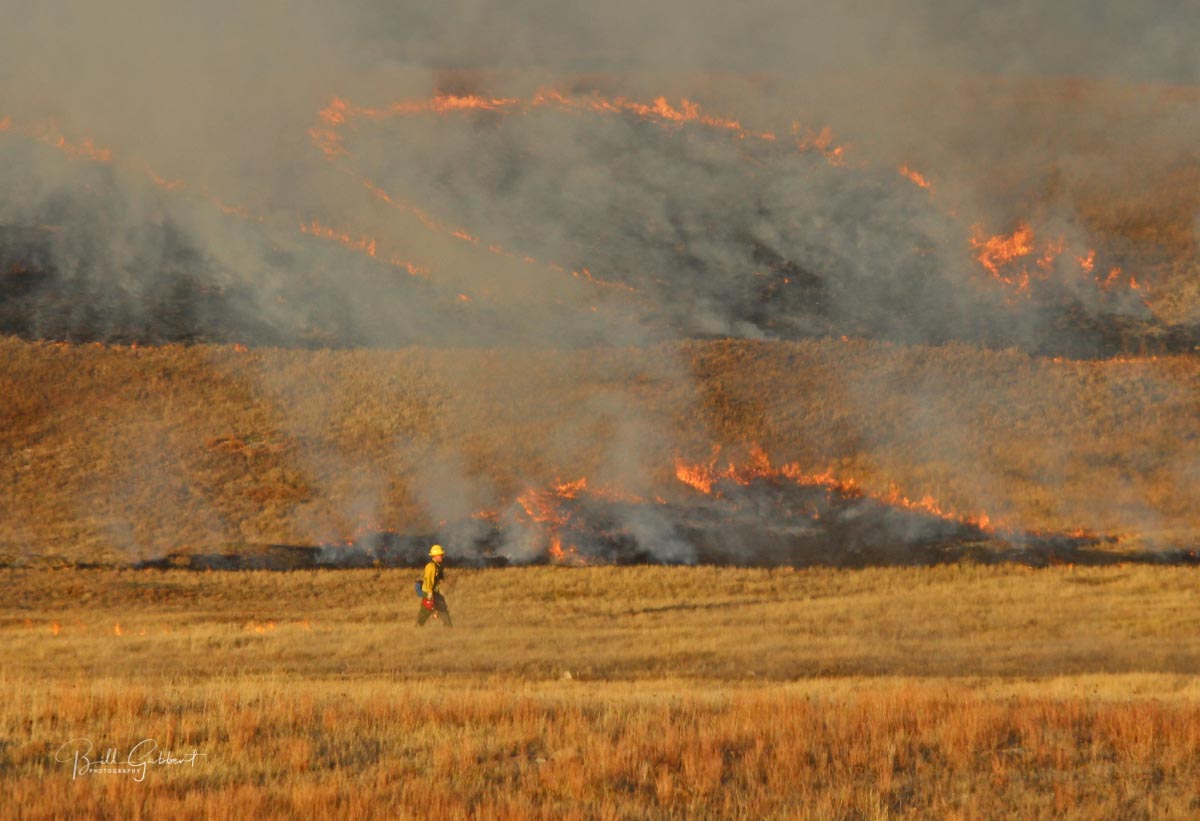
A firefighter at the end of the day, igniting the Norbeck prescribed fire in Wind Cave National Park in the Black Hills of South Dakota, Oct. 20, 2014. Photo by Bill Gabbert.

By Luke Montrose, Assistant Professor of Community and Environmental Health, Boise State University

(This article first appeared at The Conversation)

As summer approaches, two forces of nature are on a collision course, and wildland firefighters will be caught in the middle.

New research suggests that the smoke firefighters breathe on the front lines of wildfires is putting them at greater risk from the new coronavirus, with potentially lethal effects.

At the same time, firefighting conditions make precautions such as social distancing and hand-washing difficult, increasing the chance that, once the virus enters a fire camp, it could quickly spread.

As an environmental toxicologist, I have spent the last decade expanding our understanding of how wood smoke exposure impacts human health. Much of my current research is focused on protecting the long-term health of wildland firefighters and the communities they serve.

‘Camp crud’ and the dangers of air pollution

People have long understood that the air they breathe can impact their health, dating back more than 2,000 years to Hippocrates in his treatise on Air, Water, and Places. Today, there is a growing consensus among researchers that air pollution, specifically the very fine particles called PM2.5, influences risk of respiratory illness. These particles are a tiny fraction of the width of a hair and can travel deep into the lungs.

Italian scientists reported in 2014 that air pollutants can increase the viral load in the lungs and reduce the ability of specialized cells called macrophages to clear out viral invaders.

Researchers in Montana later connected that effect to wood smoke. They found that animals exposed to wood smoke 24 hours before being exposed to a pathogen ended up with more pathogen in their lungs. The researchers showed that wood smoke exposure decreased the macrophages’ ability to combat respiratory infection.

Now, new evidence suggests that long-term exposure to PM2.5 air pollution, which is produced by sources such as wildfirespower plants and vehicles, may make coronavirus particularly deadly.

Researchers from the Harvard T.H. Chan School of Public Health conducted a nationwide study of county-level data and found that even a small increase in the amount of PM2.5 from one U.S. county to the next was associated with a large increase in the death rate from COVID-19. While small increases in PM2.5 also raise the risk of death from other causes for older adults, the magnitude of the increase for COVID-19 was about 20 times greater. The results were released last week, before the usual peer review process was conducted, to help warn people of the risks.

Taken together, these findings suggest that air pollution, including wood smoke, could increase the risk that wildland firefighters will develop severe COVID-19 symptoms.

That probably doesn’t surprise seasoned firefighters.

They’re already familiar with “camp crud,” a combined upper and lower respiratory illness accompanied by cough and fatigue that has become common in firefighting camps.

The National Wildfire Coordinating Group, in its guidance on infectious disease, has pointed out that “the close, overlapping living conditions of an incident command post lends itself to rapid spreading of contagious microorganisms, as witnessed by the common outbreaks of ‘camp crud.’ Outbreaks also have a history of spreading from incident to incident as people are reassigned.”

How to protect wildland firefighters

So, what can be done to avoid the spread of COVID-19 among wildland firefighters and prevent them from being vectors in the communities they serve?

In some areas, officials have been delaying firefighter training sessions and brush-clearing operations that would normally be underway now. But while that might protect firefighters from exposure right now, it can be put off for only so long. Wildfires have already broken out in several states, and delaying controlled burns leaves more fuel when fires get out of control.

The National Wildfire Coordinating Group’s guidance on infectious disease encourages planning ahead so personal protective equipment is available and maintaining records of symptoms so illnesses can be tracked and stopped from spreading.

The guidance also calls for better camp hygiene, providing access to medical care, making isolation possible and coordinating cross-agency communication about the public health risks.

Firefighter camps are not typically well outfitted to promote good personal hygiene. Improving those conditions could help prevent a virus’s spread, such as by adding hand-washing stations and possibly mobile shower units. Single-person tents would allow for more effective social distancing.

Camp personnel should also have access to thermometers and coronavirus test kits. Protocols for quarantining and removing infected firefighters from the field should not only be implemented but practiced.

Also missing from the National Wildfire Coordinating Group’s guidance are policies on traveling to and from training sites, working within communities and traveling from camp. Social distancing may not always be possible, so protective gear, such as face masks, should be made available and their use encouraged.
firefighters crew Whitetail Fire 3-8-2017 Photo by Bill Gabbert
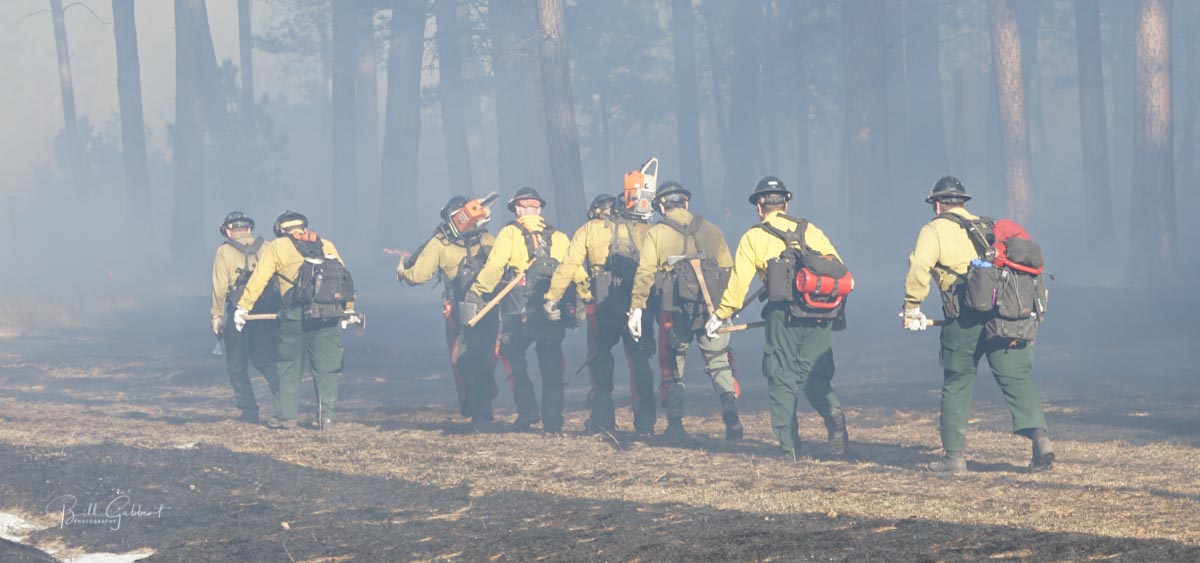
Firefighters on the Whitetail Fire in the Black Hills of South Dakota, March 8, 2017. Photo by Bill Gabbert.

A recent paper from Belgium suggests that even some of the ways firefighters operate in the field should be reconsidered to protect against the virus’s spread. It shows how droplets released when a person exhales can travel farther than six feet during heavy activity. For firefighters, that could mean walking farther apart and in a V-shaped delta formation, rather than a traditional line, to reach the fire.

It is also important to consider that frontline firefighters are often younger and could be asymptomatic but still able to spread the virus, so their contact with with rural community members, such as volunteer firefighters and ranchers, should be considered.

Finally, a system for cross-state communication should be engaged to facilitate sharing of best practices and lessons learned. It also could help track the movement of firefighters across the region.

The safety of rural western communities depends on the wildland firefighters and their ability to respond to emergencies. Protecting their health helps protect public health, too.

Researchers quantify the trend toward increasing autumn wildfire danger in California

Posted on Categories UncategorizedTags ,
Autumn Days Fire weather index above 95th percentile
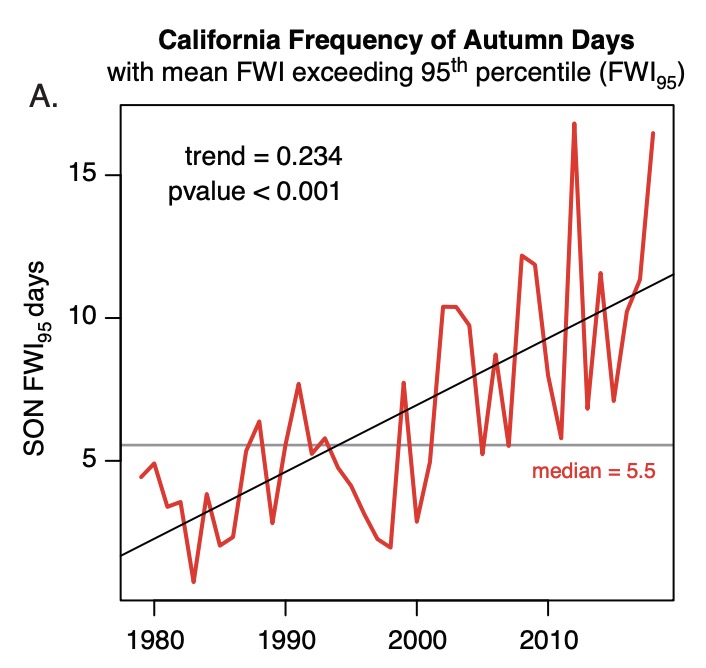
Fire Weather Index in California in September, October, and November since the 1980s. From the research paper.

Researchers have quantified some of the factors that have led to an increase in southern California large wildfires during the autumn months in recent decades.

Here are examples of late season fires that occurred in southern California in 2017 and 2018:

The study defines autumn as September through November.

But their analysis goes much farther back than just three years. Among other things, they found that rising temperatures, declining snowpack, and decreasing precipitation in autumn and spring have acted to extend California’s fire season in the shoulder seasons. They also determined that climate change has already doubled the frequency of extreme fire weather days since the 1980s (see the illustration at the top of the article).

The research also found a long-term trend toward more extreme fire weather conditions occurring in both southern and northern California at the same time.

The study was conducted by Michael Goss, Daniel L. Swain, John T. Abatzoglou, Ali Sarhadi, Crystal Kolden, A. Park Williams, and Noah S. Diffenbaugh.

Data shows the worsening trend of California wildfires

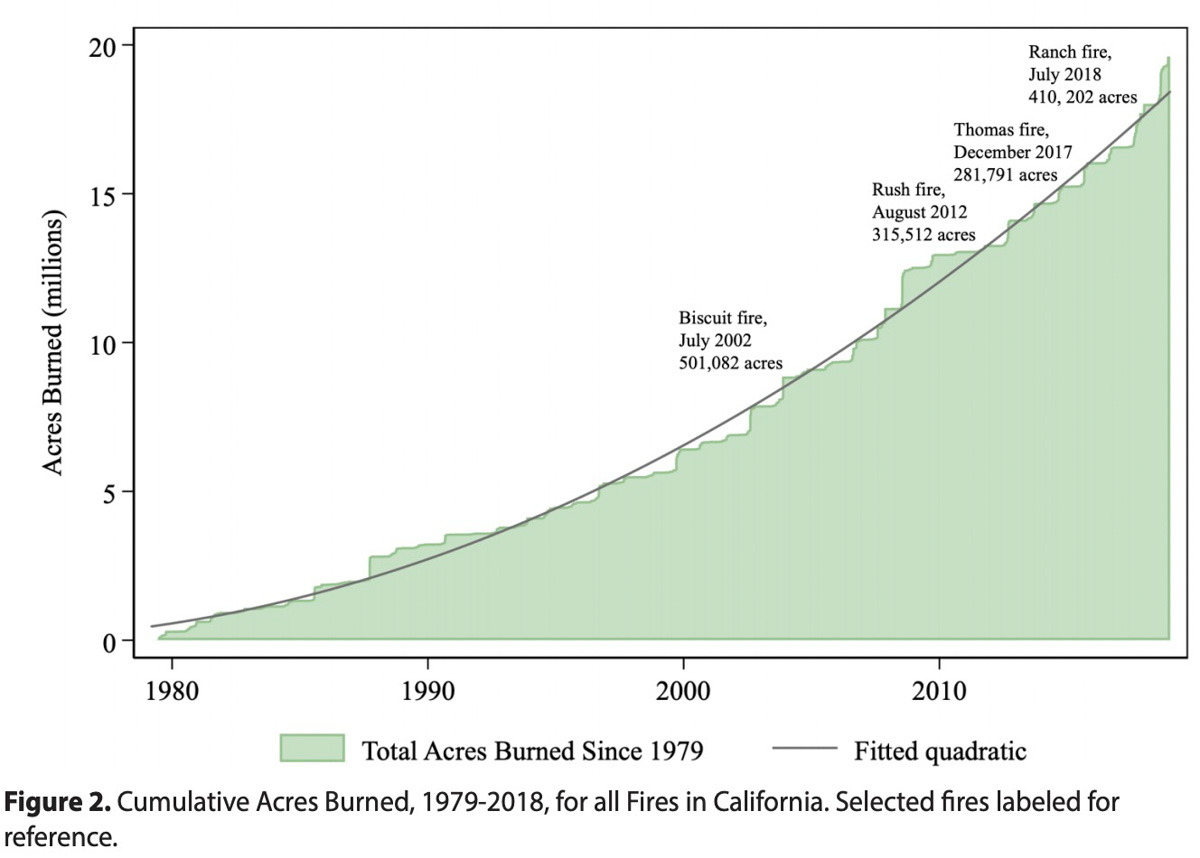
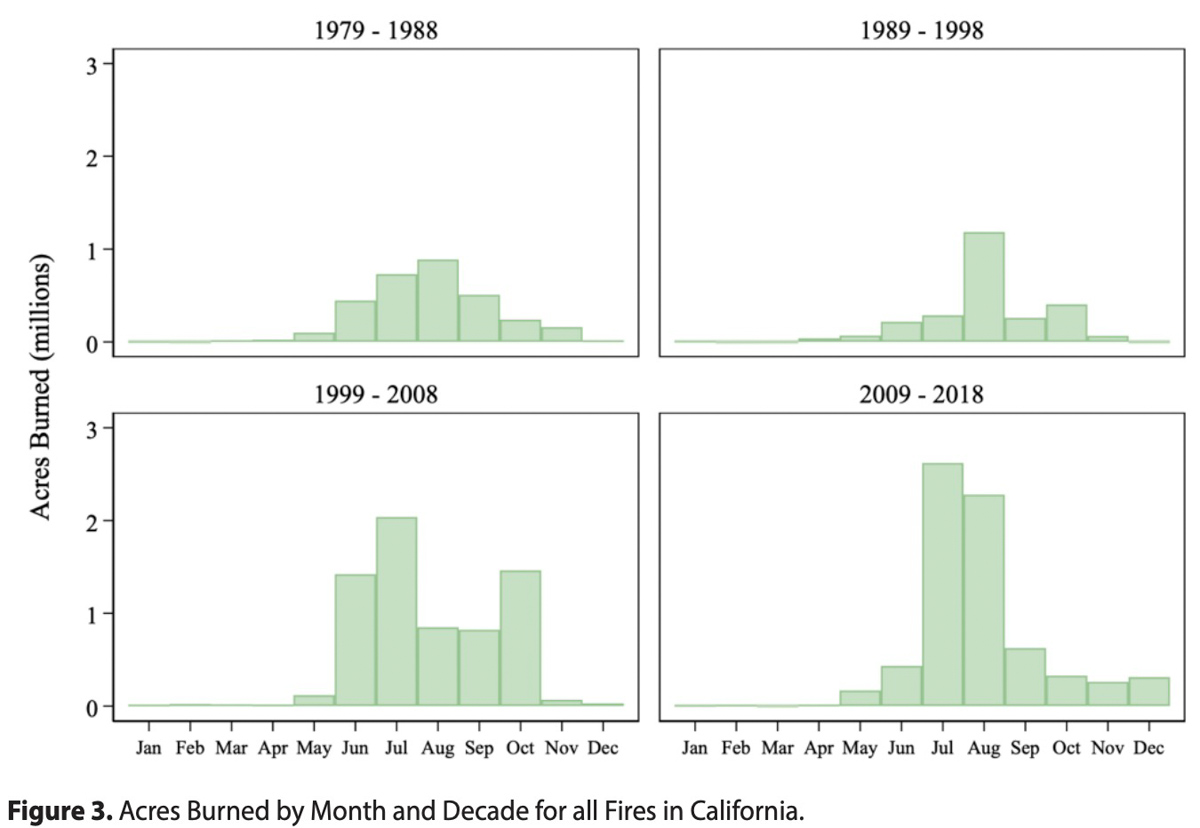
Cumulative Acres Burned, 1979-2018, for all Fires in CaliforniaIt’s clear to most citizens of California that wildfires have become more intense over the last few years. Researchers at UC Santa Barbara and the Nature Conservancy have compiled a new dataset of damage caused by wildfires in California in areas protected by the state of California. (Some of the data does not include fires on lands protected by federal agencies, such as the U.S. Forest Service, National Park Service, and the BLM). The report illustrates how the recent set of severe fires fits into a broader trend of increasing burn area and damage over the past 40 years.

The report was written by: Hanna Buechi (Environmental Market Solutions Lab, UCSB), Dick Cameron (The Nature Conservancy), Sarah Heard (The Nature Conservancy), Andrew J. Plantinga (Environmental Market Solutions Lab, UCSB), and Paige Weber (Environmental Market Solutions Lab, UCSB).

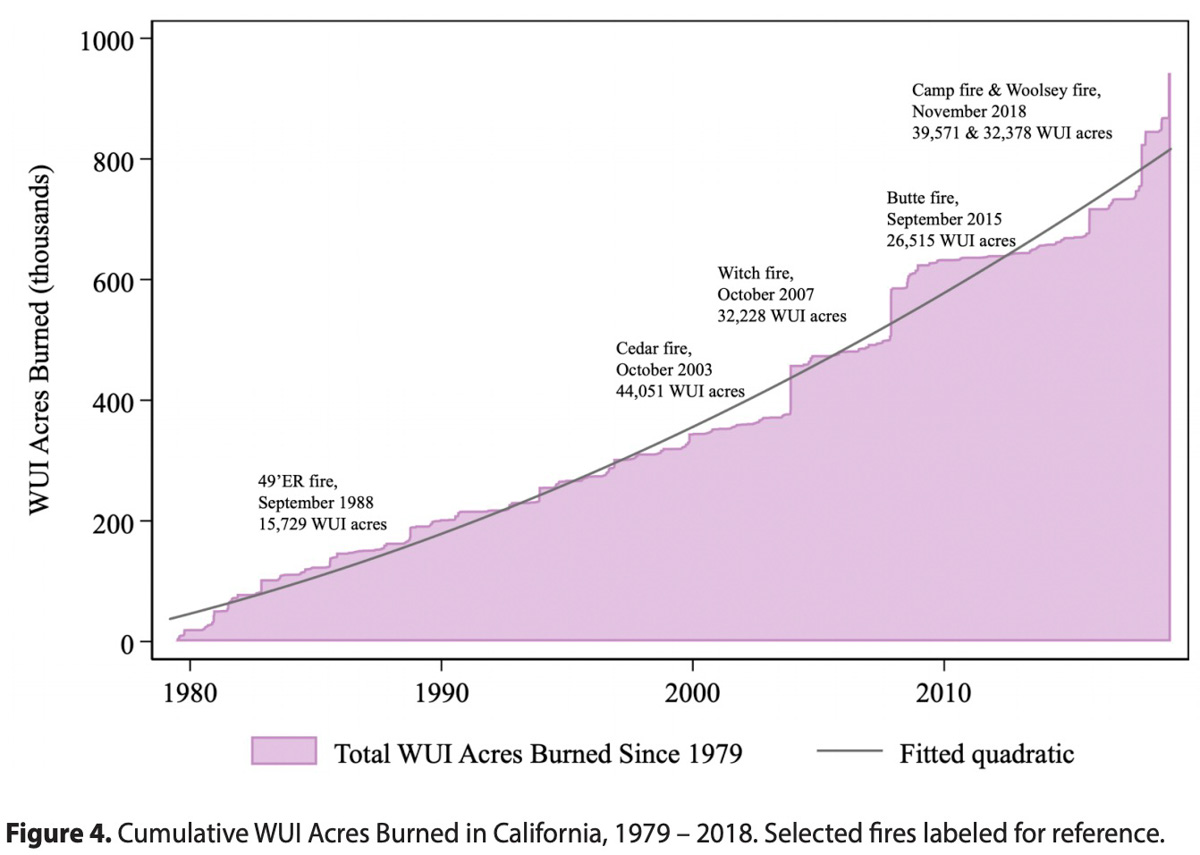
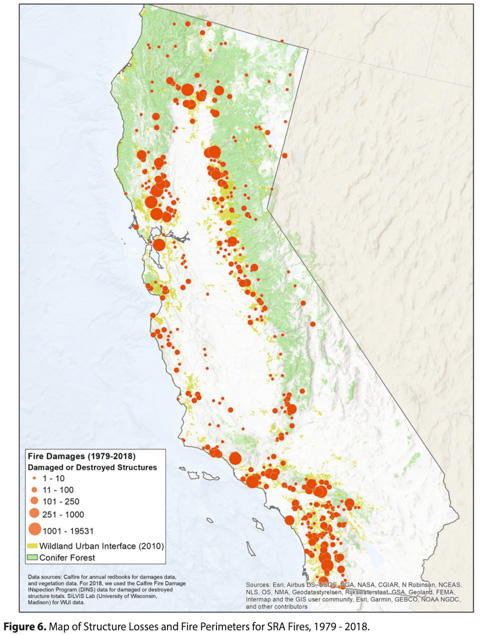
The researchers studied data on fire perimeters and estimates of damages for each fire and used the information to calculate trends involving the number and timing of fires throughout the state by time of year. They also calculated the total area burned and specifically identified the amount of wildland urban-interface burned. These are areas where houses intermingle with wildland vegetation, and are of particular concern to those studying wildfire.

Andrew Plantinga
Andrew Plantinga. UCSB photo.

“The main finding is that the recent severe fires in California — including the Thomas fire in 2017 and the Camp fire in 2018 — are part of a trend in California over the past four decades,” said Andrew Plantinga, an economics professor at UC Santa Barbara’s Bren School of Environmental Science & Management. “The trend is toward more wildfires that burn larger areas and cause more damage.”

The number of acres burned per year has not only been increasing, the report found, it is also accelerating. And this increase isn’t only during the season’s peak, from June through October. The state is also seeing a longer fire season, with more acres burned in late fall than in the past. And while greater burn areas don’t automatically translate to greater damages, the researchers found that these, too, have been on the rise.

“I expected the recent severe fires to be outliers, and they are,” said Plantinga, “but it’s also clear that they represent part of a trend toward larger and more damaging fires.”

Cumulative WUI Acres Burned in California, 1979 – 2018

The report is part of a larger effort to estimate the costs associated with a business-as-usual approach to development in California, when considering the potential impacts of climate change. The team had previously found that interventions on natural and working lands — like forests, farms and rangelands — can contribute 2.5 times the emissions reductions by 2050 as residential and commercial sectors combined.

What’s more, for every dollar spent on implementing land-use strategies, close to fifty cents would be recouped in economic benefits. And that’s without accounting for other positive impacts, the previous report states.

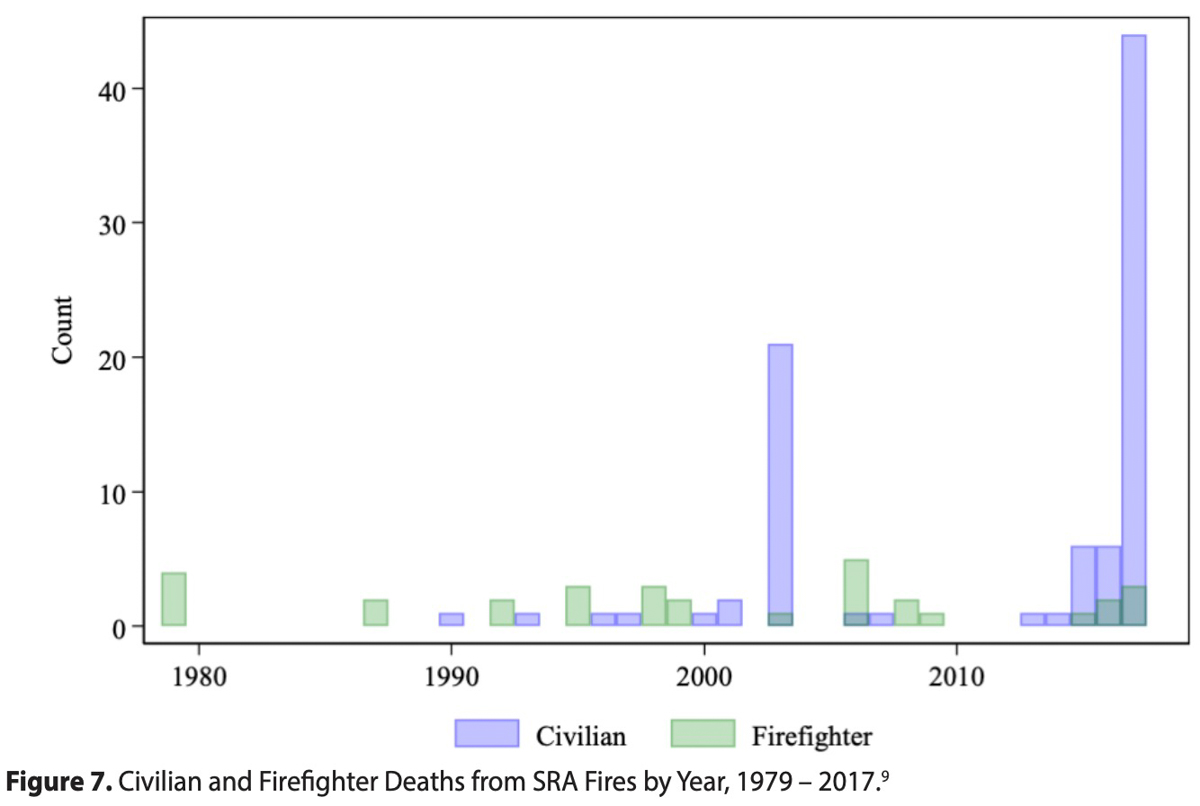
California Civilian and Firefighter Deaths
Civilian and Firefighter Deaths on wildfires in California that occurred on State Responsibility Area lands, 1979 – 2017.
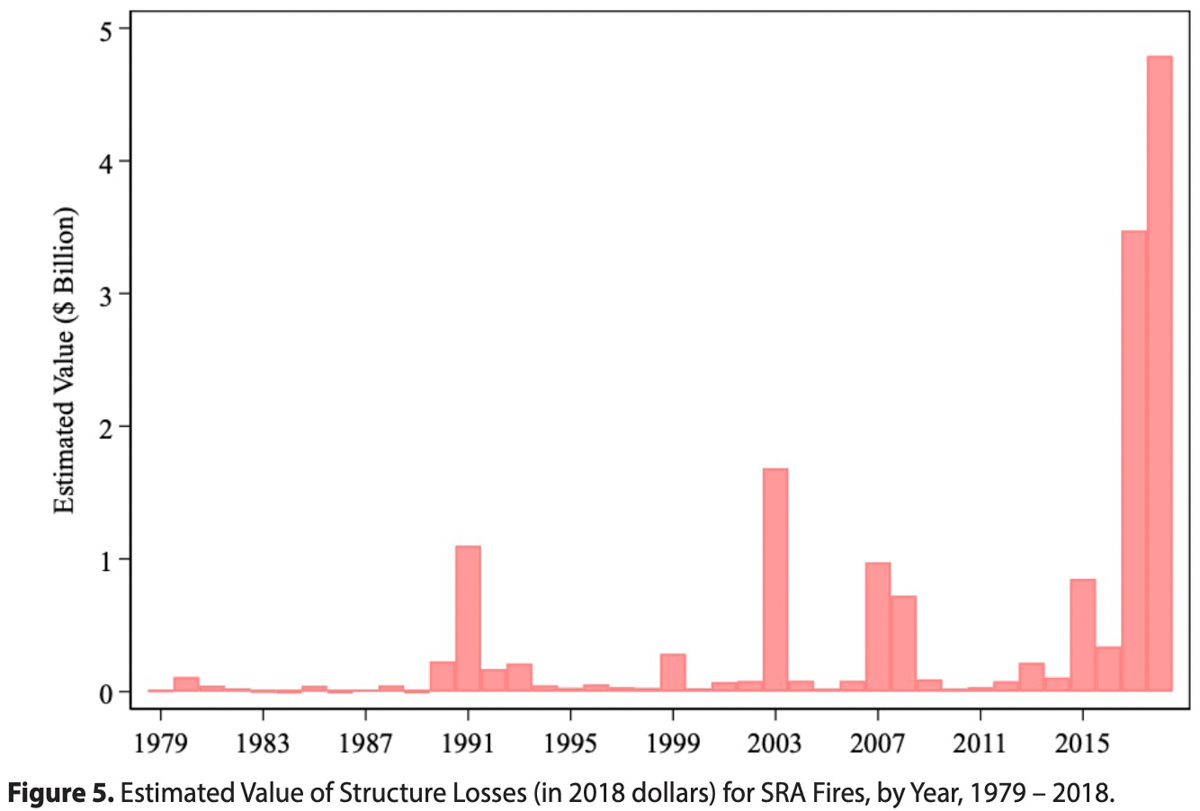
California Estimated Value of Structure Losses
Estimated Value of Structure Losses (in 2018 dollars) for State Responsibility Area Fires, by Year, 1979 – 2018.

Acres Burned by Month and Decade for all Fires in California

California Map of Structure Losses and Fire Perimeters
Map of Structure Losses and Fire Perimeters for State Responsibility Area Fires, 1979 – 2018.

Researchers study factors that affect long-distance spotting of wildfires

The results could lead to more accurate models for spotting and fire behavior

map spot fires wildfire Australia
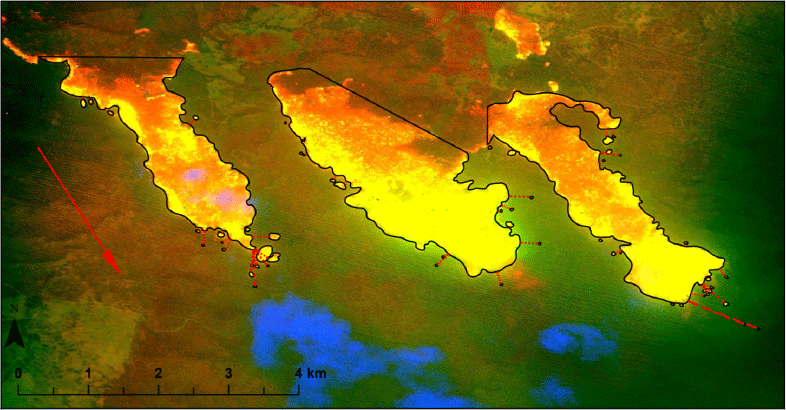
New South Wales Rural Fire Service line scan showing three separate source fires (three largest polygons). Most actively burning fire is yellow, orange is still hot after main fire front has passed, brown is extinguished, green is unburnt vegetation, blue is part of the smoke plume. Red dotted lines indicate spot fire (small polygons) distances measured for analysis. Red arrow indicates spread direction. (from the research)

Data collected in an Australian study could lead to the development of more accurate predictive models for wildfire behavior and spotting, especially for extreme wildfires.

Burning embers driven ahead of a wildfire can dramatically increase the rate of spread and the danger faced by firefighters and the public. Under moderate burning conditions a small number of spot fires might be suppressed if enough firefighting resources are available, but on large plume-dominated fires pushed by strong winds spot fires far from the  main fire can burn together making suppression at the head of the fire impossible. In many cases ember showers have been the primary ignition source for the destruction of structures in the wildland urban interface.

During the 2009 Black Saturday bushfires in eucalpyt-dominated forests in Australia the maximum spot fire distances were 30 to 35 km (18 to 22 miles) and during the 1965 wildfires in eastern Victoria were 29 km (18 miles). Spot fires in North America have been documented at distances of up to 19 km (12 miles).

A research paper on spotting distance in Victoria and New South Wales was published earlier this week by the International Journal of Wildland Fire, written by Michael A. Storey, Owen F. Price, Jason J. Sharples, and Ross A. Bradstock, titled “Drivers of long-distance spotting during wildfires in south-eastern Australia.”

The researchers took advantage of the increasing use of airborne mapping technologies on wildfires in Australia, including infrared and multispectral line scanning, to analyze data from 338 observations. (See map above.) They used ArcGIS to manually draw polygons and determine the size of the actively burning areas of the fire, which they called “source fire area”, and measured the distance to spot fires and the size of each. They also collected fuels, weather, and topography information.

Below is an excerpt from the research:

Maximum spot fire distances ranged from 5.0 m to 13.9 km (mean, 0.9 km; 95th percentile, 3.9 km). The mean number of spot fires per source fire (irrespective of distance) was 13. The distribution of maximum distance values appeared exponential, with a high proportion of shorter distances (Fig. 4a). Very long-distance spotting was rare; only 11 source fires had a maximum spotting distance >5 km.

maximum spot fire distances
Frequency distribution histograms of (a) maximum spot fire distance values from each source fire and (b) number of long-distance spot fire (>500 m) values from each source fire. (from the research)

Eleven of the fires had spotting distances more than 5 km (3.1 miles). The longest distance measured to a spot fire was 13.9 km (8.6 miles).

The analysis of 338 wildfire line scan observations found the size of the active area of the source fire to be the strongest predictor of long-distance spotting. Important secondary effects were fuel, weather, and topography.

Excerpts:

Wind speed was important to both Maximum-distance and long-distance Spot-number. Upper-level wind speed had weaker but still significant effects in the models. Wind at different levels can influence many aspects of wildfire behaviour, including plume development, plume turbulence and tilt, fire intensity, vorticity development, firebrand transport and ignition likelihood in receiver fuels.

A steep slope somewhere within the source fire (i.e. source fire max. slope) increased the maximum spot fire distance and the probability of spot fire occurrence >500 m. TRI [Terrain Ruggedness Index] performed similarly but was highly correlated with slope (>0.9), so was not included in the same models. An area of relatively high wind exposure (e.g. exposed ridge) also increased maximum spotting distance. Slope and wind exposure may be important through interactions with wind, changing wind speed, increasing turbulence and potentially enhancing pyroconvection, leading to enhanced firebrand generation and transport.

[W]e did not find a commonly used measure of bark spotting potential to be a significant predictor. Our results suggest that to accurately predict long-distance spotting, models must incorporate a measure of source fire area. Gathering data on spotting and plume development at wildfires over a range of intensities (including measuring intensity and frequent line scans) and improving fuel maps should be prioritised to allow for the development of reliable predictive spotting models.

The fibrous or stringy bark on some eucalyptus species is particularly suited aerodynamically for being lofted in a convection column and traveling for long distances while still burning, and is one of the primary ignition sources for long range spotting in Australia. The bark on North American trees is different, but the methods used by the Australian researchers could be used to collect similar spot fire occurrence data in the United States and Canada which could lead to improved spotting and fire behavior models.

Analysis of tree regeneration following large wildfires

Northern Rockies

Yellowstone Lake Burned Area
Trees that burned on the northeast side of Yellowstone Lake. Photo: August 16, 2010 by Bill Gabbert

Below are key findings and a brief summary from a paper titled, “Post-fire tree regeneration and fuels across the Northern Rockies following large wildfires: science meta-analyses, scenarios and manager workshops”.

The principal investigators were:

Penelope Morgan, University of Idaho
Camille Stevens-Rumann, Colorado State University
Jarod Blades, University of Idaho


As more of the western US burns in large wildfires it is critical to managers and scientists to understand how these landscapes recover post-fire. Tree regeneration in high severity burned landscapes determines if and how these landscapes become forested again, while changes in fuels structure influences how these landscapes may burn again. In this study the researchers compiled two large datasets to understand region-wide patterns and drivers of tree regeneration and surface fuel accumulation post-fire. The results demonstrated that natural tree regeneration in the Rocky Mountains is declining with increasingly hotter and drier climatic conditions and that close distance to living trees were critical for tree establishment.

Key Findings:

  1. Fewer tree seedlings established far (>270 ft (90m)) from living tree seed sources
  2. Hot, dry climatic conditions in the years after fires resulted in lower tree regeneration
  3. Climate and distance to a living tree are two of the most important factors in determining tree regeneration responses. Thus, these factors should be considered when making post-fire tree planting decisions to optimize the likelihood of success.
  4. Fuels increase with years since fire, but this is mediated by site productivity and burn severity. Managers should carefully monitor burned landscapes and reduce risk during these peak tree fall periods 9-14 years post fire. Subsequent burning may reduce fuel loads, but vegetation considerations should be considered to mitigate the effects of repeated high intensity disturbances.
  5. The need for ongoing research-management partnerships that synthesize and translate current science, such as the workshops and decision tool we designed, is imperative in the face of increasing agency workloads that constrain agency specialists from adequately addressing climate change in post-fire planting and management decisions. As such, our findings suggest that the workshops were effective for the rapid delivery of science in a setting that capitalized on the use of visualization and interactive participation. Perceptions of the usefulness and credibility of the workshop materials and decision tree was high.

The full document can be seen HERE.

Findings about the fluid dynamics of wildfires

That ambient winds influence fire behavior is well known. Less understood is how fire influences the winds and how the feedback affects the fire’s evolution.

wildfire dynamics wind fields
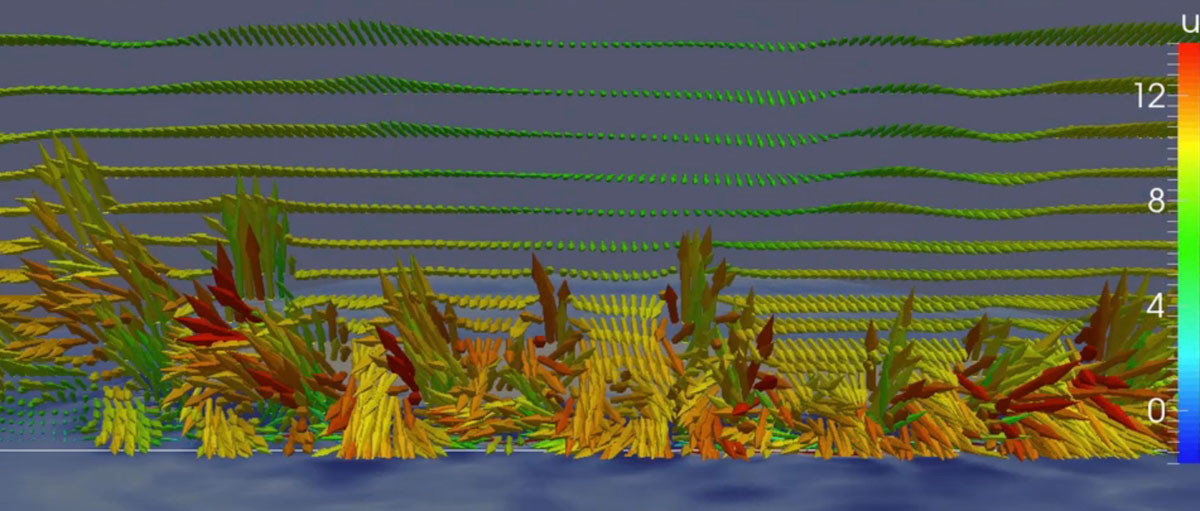
One freeze-frame moment in a simulation illustrating the dynamics of wind fields in a vertical plane as a wildfire approaches — towers and troughs. From the video.
wildfire dynamics wind fields
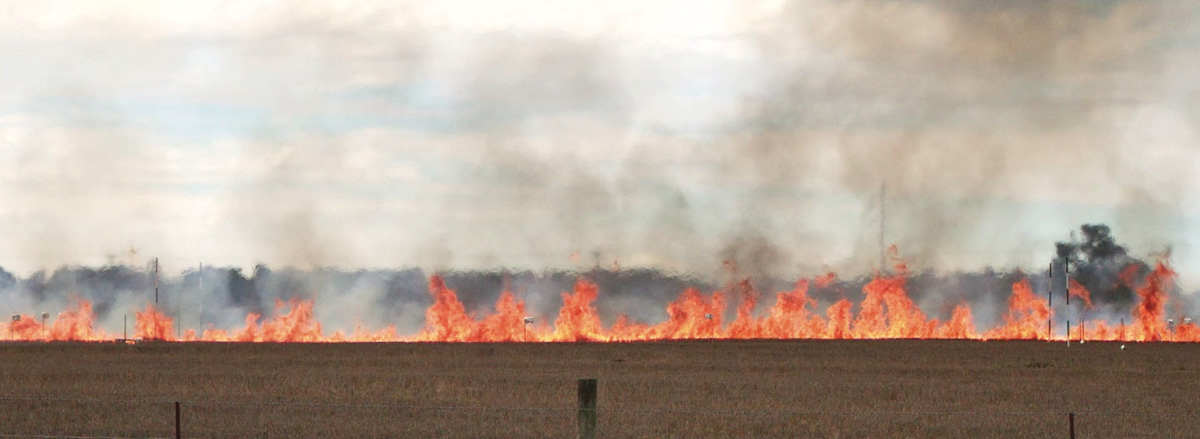
Towers and troughs, in reality. In this experimental grass fire, the few visible peaks are separated by gaps in which the wind currents sweep downward between the flames and feed the peaks on opposite sides. (Courtesy of Mark Finney, US Forest Service, Missoula Fire Sciences Laboratory.)

The more knowledge firefighters have about the fluid dynamics of wildfires the better equipped they will be to take on the tasks of igniting prescribed fires and suppressing wildfires.

Below is an article written by Rod Linn, who leads development, implementation, testing, and application of computational models of wildfire behavior in the Earth and environmental sciences division at Los Alamos National Laboratory in New Mexico. From Physics Today 72, 11, 70 (2019).  https://doi.org/10.1063/PT.3.4350


Fluid dynamics of wildfires

Wildland fires are an unavoidable and essential feature of the natural environment. They’re also increasingly dangerous as communities continue to spread away from urban areas. Unfortunately, a century of wildfire exclusion—the strategy of putting out fires as fast as they start—has led to a significant buildup of fuel in the form of overgrown forests. Continuing to keep wildfires at bay is simply not sustainable. In 2018, nearly 60,000 fires scorched parts of the continental US. California wildfires exemplify what can happen when they burn through communities: In November alone that year fires killed more than 90 people and destroyed some 14,000 homes and businesses.

Decision makers are striving to find ways to manage the consequences of those fires and yet still allow them to thin out dense, fuel-heavy forests and reset ecosystems. Among other things, the goal requires that land managers be able to predict the behavior of wildland fires and their sensitivity to ever-changing conditions. Many factors, including the interactions between fire, surrounding winds, vegetation, and terrain, complicate those predictions.

That ambient winds influence fire behavior is well known. Less understood is how fire influences the winds and how the feedback affects the fire’s evolution. As the fire rages, it releases energy and heats the air. The rising air draws in air below it to fill the gap in much the same way as air is drawn into a fireplace and rises up a chimney. The interaction between rising air and ambient winds controls the rate at which surrounding vegetation heats up and whether it ignites. The interaction thus determines how quickly a fire spreads.

FUEL MATTERS
The influence of the fire–atmosphere coupling is much greater in wildland fires than in building fires. Wildland fires are fed by fine fuels—typically grasses, needles, leaves, and twigs; often, tree trunks and large branches do not even burn. Buildings burn thicker fuels, such as boards, furniture, and stacks of books. The difference matters because fine fuels exchange energy more efficiently with surrounding hot air and gases. In those hot, fast-moving gases, the fuels’ temperature rises quickly to the point where they ignite.

But the converse is also true. Because wildland fuels are primarily fine, they are also efficiently cooled when the surrounding ambient air is cooler than they are. That means that the indraft of air caused by a fire may actually impede its spread. A rising plume can draw cool air over foliage and litter near a fire line and prevent those fine fuels from heating. The grasses just outside a campfire ring are a case in point: They are continuously exposed to the fire’s radiant heat, but the cool indraft effectively prevents them from reaching the point of ignition.

The spread of a wildfire is sometimes conceptualized as an advancing wall of flame that the wind forces to lean toward unburned fuels that then ignite in front of the fire. Although that wall-of-flame paradigm simplifies models of fire behavior, it is not correct. Convective cooling would prevent the wall of flame from spreading by radiation alone, and for convective heating to spread the fire, the wind would have to be strong enough to lean the flame to the point where it touches the unburned fuel. Were that true, the fires would be unable to spread in low-wind conditions because the buoyancy-driven updrafts would keep the flames too upright.

If you were to look upon an advancing wildfire from the front, you would actually see a series of strong updrafts, visible as towers of flame that are separated by gaps, as shown in figures 1 and 2. The towers are regions where the buoyancy-driven updrafts carry heat upward. They are fed by ambient wind drawn into the gaps between them, as described earlier. When the ambient wind is strong enough, it pushes air through the gaps between the towers, but that air is heated as it blows over burning vegetation. The motion of hot gases through the fire line disrupts the indraft of cool ambient air and ignites grasses and foliage in front of the fire. That’s the primary way a wildfire spreads.

A second factor that influences the spread is the shape of the fire line, because different parts of the blaze compete for wind. The headfire, the portion moving the fastest, often has trailing flanking fires that form a horseshoe shape and open up to the ambient wind. Part of that wind gets redirected toward the flanks of the horseshoe. The strength, length, and proximity of the flanking fires to each other thus help determine how much wind reaches the headfire. The narrower the horseshoe is, the larger the fraction of wind diverted to the flanks, the lower the wind speed reaching the headfire, and the slower it spreads.

Another factor to be considered is the spatial arrangements of fuels. The potential for wildfires spreading from the crown of one tree to another is reduced when the spacing between trees increases. In that case more horizontal wind is required for flames to jump between trees. Indeed, removing trees is a common fire-risk-management practice. But the strategy behind it is more complex than just removing fuel. Gaps in a forest canopy also make it easier for high-speed winds above the canopy to reach fires on the ground. So although reducing the number of trees might reduce the crown-to-crown fire activity, it might increase the spread rate of a surface fire.

PRESCRIBED FIRE
In some regions of the US, land managers counter the threat of wildfires and promote ecosystem sustainability by purposefully lighting fires. Carefully controlled, prescribed burns, which clear duff and deadwood on the forest floor, are often lit at multiple locations; fire-induced indrafts at one location influence fires at other locations. For example, a single line of fire under moderate winds might reach spread rates and intensities that are undesirable or uncontrollable, but the addition of another line of fire upwind can influence how much ambient wind reaches the original fire and thus reduces its intensity.

The spread of the upstream fire line, ignited second, is purposefully limited, as it converges on the area downwind where the first fire has burned off fuel. Practitioners can manipulate the flow of wind between fire lines by adjusting the spacing between ignitions. Fire managers might tie the various ignition lines together—reducing the fresh-air ventilation, increasing the interaction between the lines, and causing fire lines to rapidly pull together—to give themselves more control over the spread.
The interaction between multiple fire lines can even stop a wildfire in its tracks. When firefighters place a new fire line downwind of a fire, they often hope that the indrafts will pull the so-called “counter fire” toward the wildfire and remove fuel in front of it. Unfortunately, the maneuver requires a good understanding of the wildfire’s indraft strength. Too weak an indraft could turn the counter fire into a second wildfire.

After realizing the huge significance of the wind interactions in wildfires over the past two decades, the science community is striving to better account for them. Those efforts should improve predictions of how a wildfire will behave in various conditions. To that end, some researchers, including me, use computer models to explicitly account for the motion of the atmosphere, wildfire processes, and the two-way feedbacks between them. Others perform experiments at scales ranging from meters (such as in wind tunnels) to kilometers (such as in high-intensity fires on rugged topography) for new insight on the nature of those fire–atmosphere interactions or to confirm existing models.

SIMULATION VIDEO

(If you’re having trouble playing the video, you can see it on YouTube)

The [above] simulation illustrates the dynamics of wind fields in a vertical plane, located at the white horizontal line, as a wildfire approaches it. The colors mark the speed u of the wind perpendicular to the plane, with red indicating motion toward the viewer (out of the screen), and blue indicating motion away from the viewer. As the clip shows, the fire starts to influence the winds long before it reaches the plane, and the wind patterns change in scale and character as the fire approaches. As the fire crosses the plane, the towers and trough flow patterns become apparent. Some locations show strong upward motion, whereas others have strong horizontal or even slightly downward motion. The colors on the ground surface illustrate the convective cooling (blue) that occurs as a result of the movement of cool air over the fuel— grasses in this simulation—and locations in front of the fire where the fuels are being convectively heated (red).