What to expect from El Niño

El Niño forecast

The question of IF there will be a strong El Niño weather pattern in the contiguous United States this winter is now settled. NOAA reports that there is a 95 percent probability that El Niño will continue through the 2015-2016 Northern Hemisphere winter. In an indication of the strength to expect, the June-August average of sea surface temperatures in the Niño3.4 region was 1.22° C above normal. This is the third-highest June-August value since records started in 1950.

El Niño isn’t a storm that will hit a specific area at a specific time. Instead, the warmer tropical Pacific waters cause changes to the global atmospheric circulation, resulting in a wide range of changes to global weather.

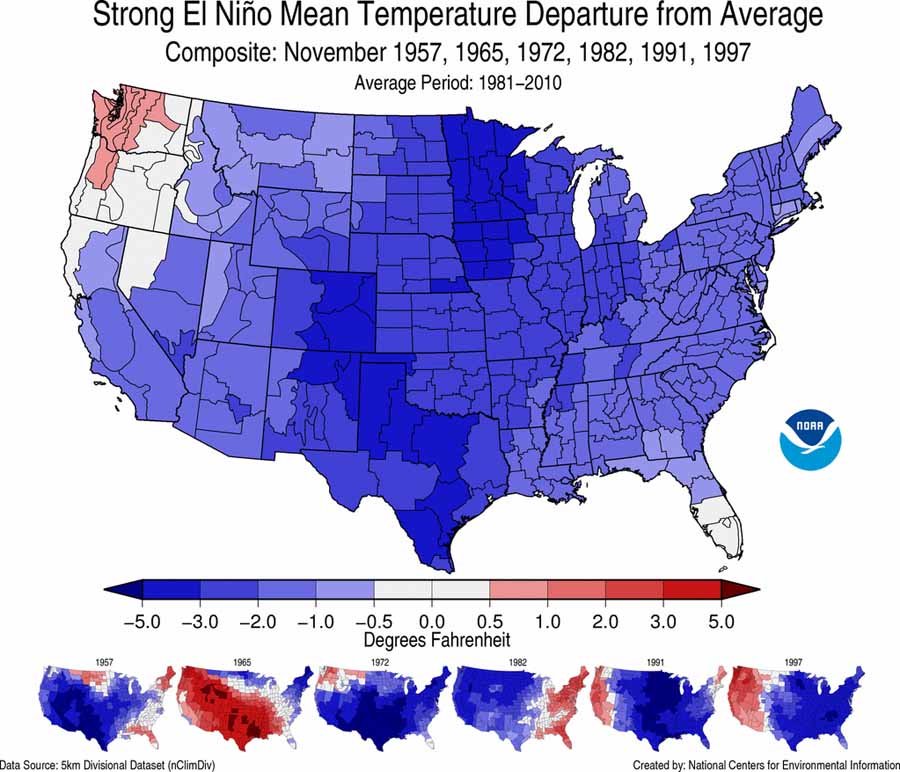
The map above is a composite of how precipitation varied from average during the strong El Niños of 1957–1958, 1965–1966, 1972–1973, 1982–1983, 1991–1992, and 1997–1998. There is a large variability in those six events that makes it difficult to predict the effects at any specific location. The map below is a composite of temperatures for the same periods. Again there is much variability, and you will notice that it is very different from the actual forecast, farther down, for this winter.

El Nino temp composite

The impacts of El Niño are typically largest in the U.S. during the cool months from October through May. During the winter season, the southern half of the country — from California to the Southern Plains, as well as along the East Coast — typically receives above-average precipitation. Below-average temperatures also often accompany this above-average precipitation in these regions. Across the northern half of the country, the winter season tends to be warmer and drier than average, particularly in the Northwest, Northern Plains, and Ohio Valley.

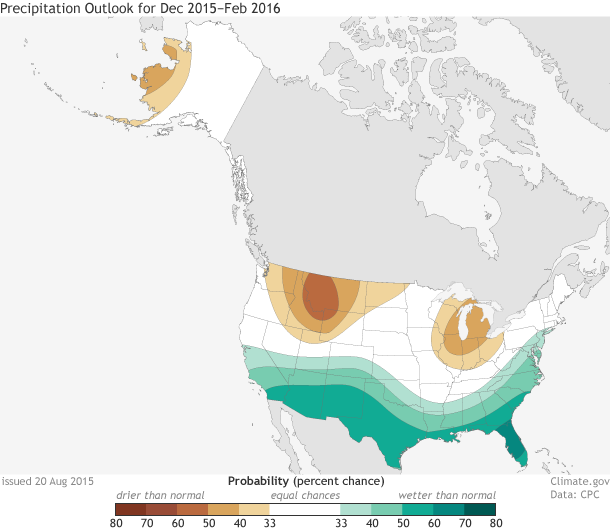
Below are NOAA’s outlooks for temperature and precipitation for December 2015 through February 2016.

precipitation outlook temperature outlook

Rain slows wildfire season in southern California

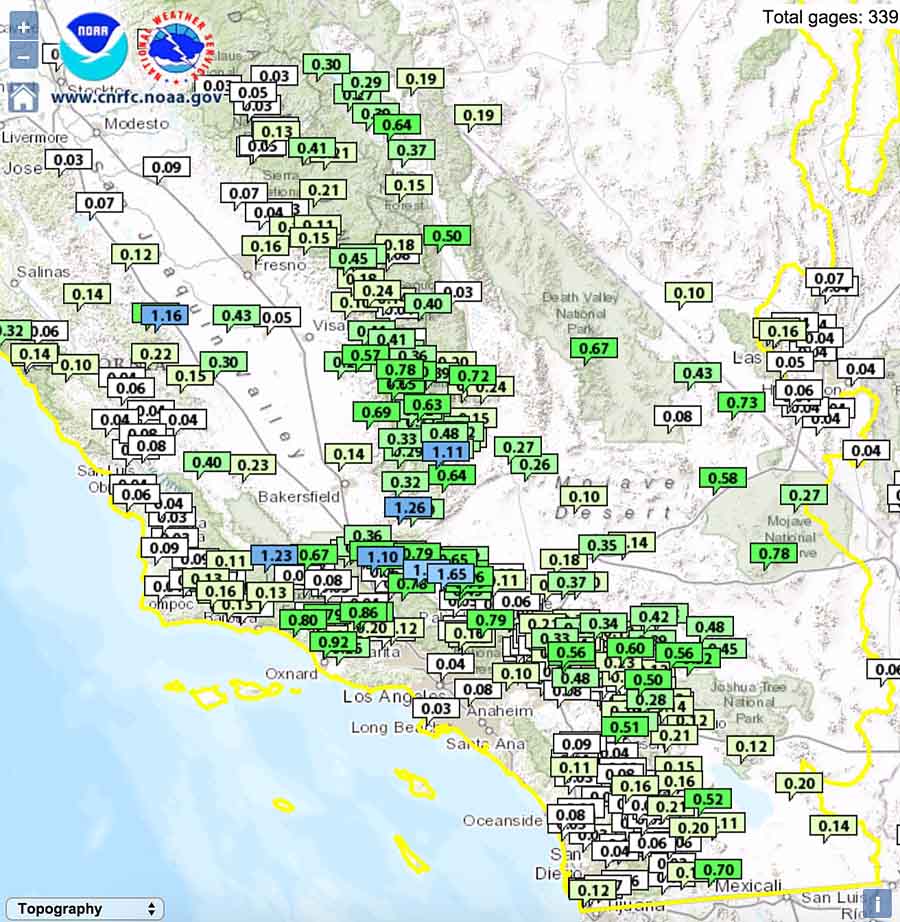
Observed precipitation in southern California
Observed precipitation in southern California for the five-day period ending at 9:45 a.m. MT, October 16, 2015. The map shows cumulative precipitation that exceeded 0.02″ for the period.

Massive amounts of rain in scattered locations and a general rain over much of the area over the past five days could pause the wildfire season in southern California.

I5 mudslide
Mudslide closes Interstate 5 north of Los Angeles in the Tejon Pass/Grapevine area on Thursday and Friday. CALTRANS photo.

Over an inch and a half of rain fell north of Los Angeles causing mud slides that closed 20 miles of Interstate 5 in the Tejon Pass/Grapevine area on Thursday and Friday. Over 200 vehicles on the highway were entrapped by the flowing debris. Some drivers sought refuge on the top of their cars, while in another area residents were rescued from the roofs of their houses.

LACo FD roof rescue
Los Angeles County FD firefighters use a ladder truck to rescue residents on a roof who took refuge from a mud slide. Photo by LA Co. FD.

The Los Angeles office of the National Weather Service warns that more flash flooding is possible in southern California today, Friday.

The multi-year drought and warnings of an above normal fall fire season in southern California in October had many fire officials on edge, and prompted the Los Angeles County Fire Department to double the number of scooping air tankers on contract from two to four.

The Wildland Fire Potential Outlook issued October 1 by the Predictive Services section at the National Interagency Fire Center predicted enhanced fire potential for southern California in October with “little if any precipitation”. Below is an excerpt:

Southern California: Above normal significant wildland fire potential will continue for the mountains and coastal areas of southern California in October, with the conditions trending toward normal in central California by the end of the month. Above normal fire potential will continue for the southern coastal areas into November before returning to normal by December.

Southern and central California will be dominated by high pressure during the first half of October, resulting in warm, to occasionally hot conditions throughout the region with periods of light to moderate offshore flow. Little if any precipitation is anticipated. There may be a trend towards cooler  weather during the latter part of the month, but with the anticipated weather pattern, most of October will likely experience precipitation deficits.

The map below shows cumulative precipitation for the contiguous United States during the last seven days.

Observed precipitation in the United States
Observed precipitation in the United States for the seven-day period ending at 6 a.m. MT, October 16, 2015.

Wildfire potential through January, 2016

The Predictive Services section at the National Interagency Fire Center issued their Wildland Fire Potential Outlook through January, 2016. The data represents the cumulative forecasts of the ten Geographic Area Predictive Services Units and the National Predictive Services Unit.

If their forecasts are accurate, the only areas with above normal wildfire potential during that period will be in California and Minnesota.

Here are the highlights from their outlook.

October

wildfire potential October 2015

  • Significant fire potential has reduced to normal fall conditions across most of the areas where fire activity concerns were prevalent through September.
  • Above normal significant fire potential will continue across central and southern California due to continued drought and dry fuels. Central portions of the state will return to normal by the end of the month.
  • Northwestern Minnesota will see short term elevated significant fire potential through October.
  • Portions of the Mississippi and Ohio Valleys, Puerto Rico and the Hawaiian Islands will see below normal conditions.
  • Elsewhere normal fall conditions will prevail.

November

wildfire potential November , 2015

  • The remainder of the above normal potential will return to normal by the end of November in California.
  • Portions of the Southeastern U.S., Hawaiian Islands and Puerto Rico will continue to see below normal potential.
  • Normal conditions are expected elsewhere.

December, 2015 and January, 2016

wildfire potential December January

  • Portions of the Southeastern U.S., Hawaiian Islands and Puerto Rico will continue to see below normal potential.
  • Normal conditions are expected elsewhere.

(end of Fire Potential report)

****

Below is the Drought Monitor analysis

Drought Monitor

Precipitation, departure from normal

The map below shows the how the amount of precipitation recorded during September, 2015 departed from normal for that period.

Precip, departure from normal

Precipitation slows wildfires in western US

Fires western US
Heat detected by a satellite during the 24 hours ending at 1:13 a.m. PT, September 16, 2015. The red icons are the most recent, with the brown icons being detected 12 to 24 hours previously. Most of the icons represent wildfires, however the ones in North Dakota are from the flaring of gas at drilling operations. (click to enlarge)

Rain, and in some cases snow, has slowed many of the large fires that have been burning in the western United States. Compare the heat detected by a satellite in the map above (current) with the map below from August 24.

satellite fires heat
Heat detected by a satellite in the 24 hours preceding 7:45 p.m. Pt, August 24, 2015. (click to enlarge)

As you can see below, some areas in California, Oregon, Idaho, Montana, Washington, and Wyoming received over a quarter of an inch in the last week, with a few locations getting more than half an inch. And in Orange County near Los Angeles that got almost two inches of rain on Tuesday, officials were dealing with flooding in Newport Beach and telling residents where they could obtain sandbags.

Precipitation 7 days ending September 15
Precipitation for the seven day period that ended September 15, 2015. NOAA.

Of course precipitation is expected during this time of the year in the West except in southern California, and is the reason that fire seasons usually start to wind down in the northwest one-quarter of the US in September.

The image below shows the normal precipitation for the seven day period ending September 15, 2015.

Normal precipitation
Normal precipitation for the seven day period ending September 15. NOAA.

Effects of El Niño will vary by regions

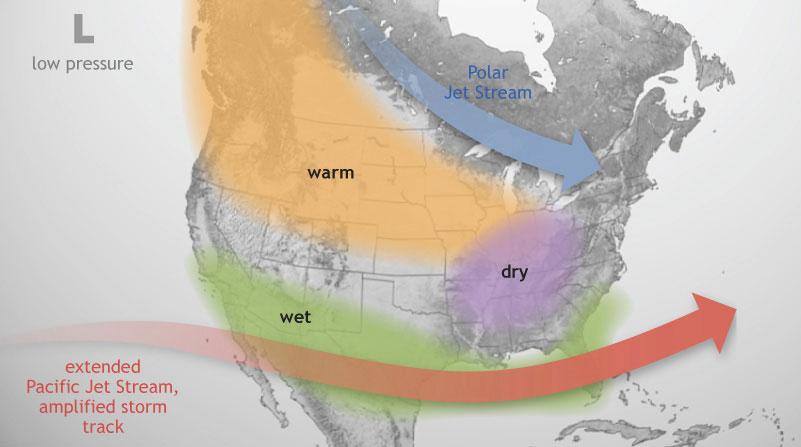
El Nino
The image above shows the typical pattern in the winter during El Niño events. The polar jet stream tends to stay to the north of the Midwest region, while the Pacific jet stream remains across the southern U.S. With the Midwest positioned between the storm tracks, warmer and possibly drier conditions can develop during El Niño events. NOAA image.

From NOAA:

El Niño conditions have continued this summer and forecasts indicate that this El Niño will strengthen, with an 84% chance of it peaking as a strong event in late fall or early winter. In terms of how long the event may last, the Climate Prediction Center (CPC) says there is a 95% chance that these conditions will last through the winter, gradually weakening through spring 2016. Research has shown that strong El Niños are often followed by La Niñas, so conditions should continue to be monitored closely, especially if the El Niño weakens next spring, as predicted.

El Niño in Winter

An El Niño develops when sea surface temperatures are warmer than average in the equatorial Pacific for an extended period of time. This is important to North America because El Niño has an impact on our weather patterns, most predominantly in the winter.

Although each El Niño is different, there are some general patterns that are predictable. For instance, the polar jet stream is typically farther north than usual, while the Pacific jet stream remains across the southern United States (see figure above).

This pattern brings above-normal temperatures to much of the Midwest region, particularly across the northern states. This does not mean that cold weather will not happen this winter but typical extreme cold weather may be milder and less frequent. In addition, this pattern may bring drier conditions to eastern portions of the Midwest.


Precipitation last 7 days

Precipitation last 7 days. September 5, 2015.
Observed precipitation last 7 days. September 5, 2015. NOAA.

The above map shows precipitation during the seven days preceding September 5, 2015. Some areas in Montana, Idaho, Washington, and Oregon received over an inch.

The map below is the observed precipitation today, September 5, 2015. This rainfall over the last week, and in some cases snow, probably will not put out the large fires, but will certainly slow them down.

Observed precipitation on September 5, 2015
Observed precipitation on September 5, 2015. NOAA.