Research: selecting the optimum escape route at a wildland fire

Escape Route Index: A Spatially-Explicit Measure of Wildland Firefighter Egress Capacity

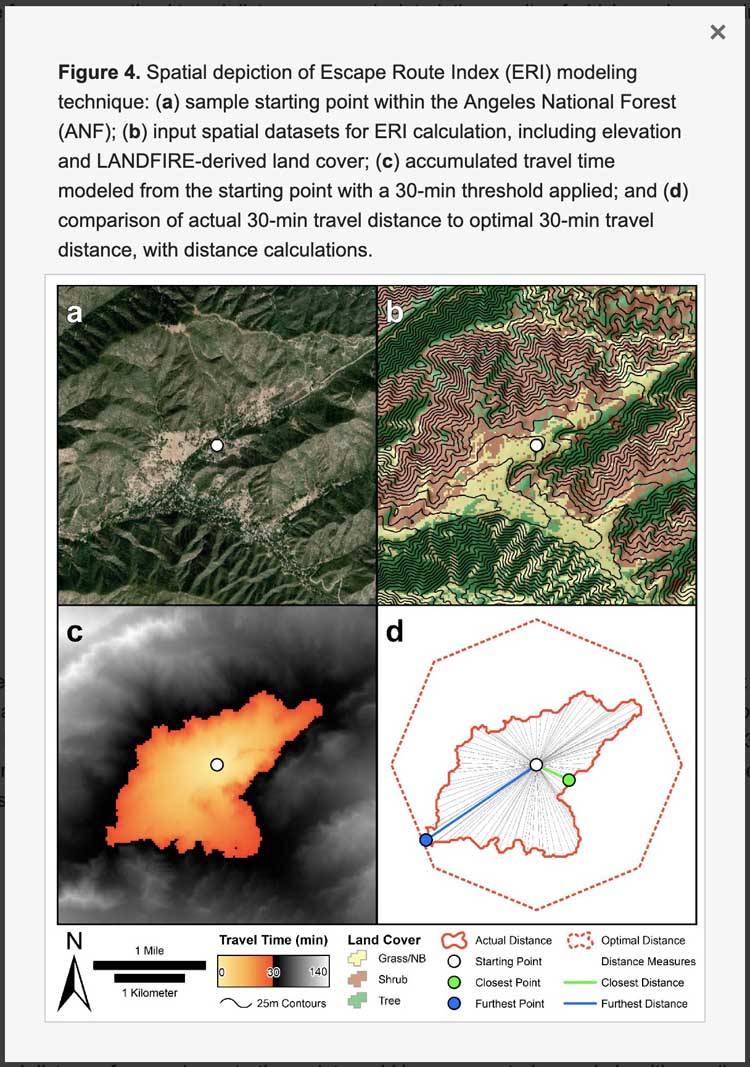
Escape Route Index

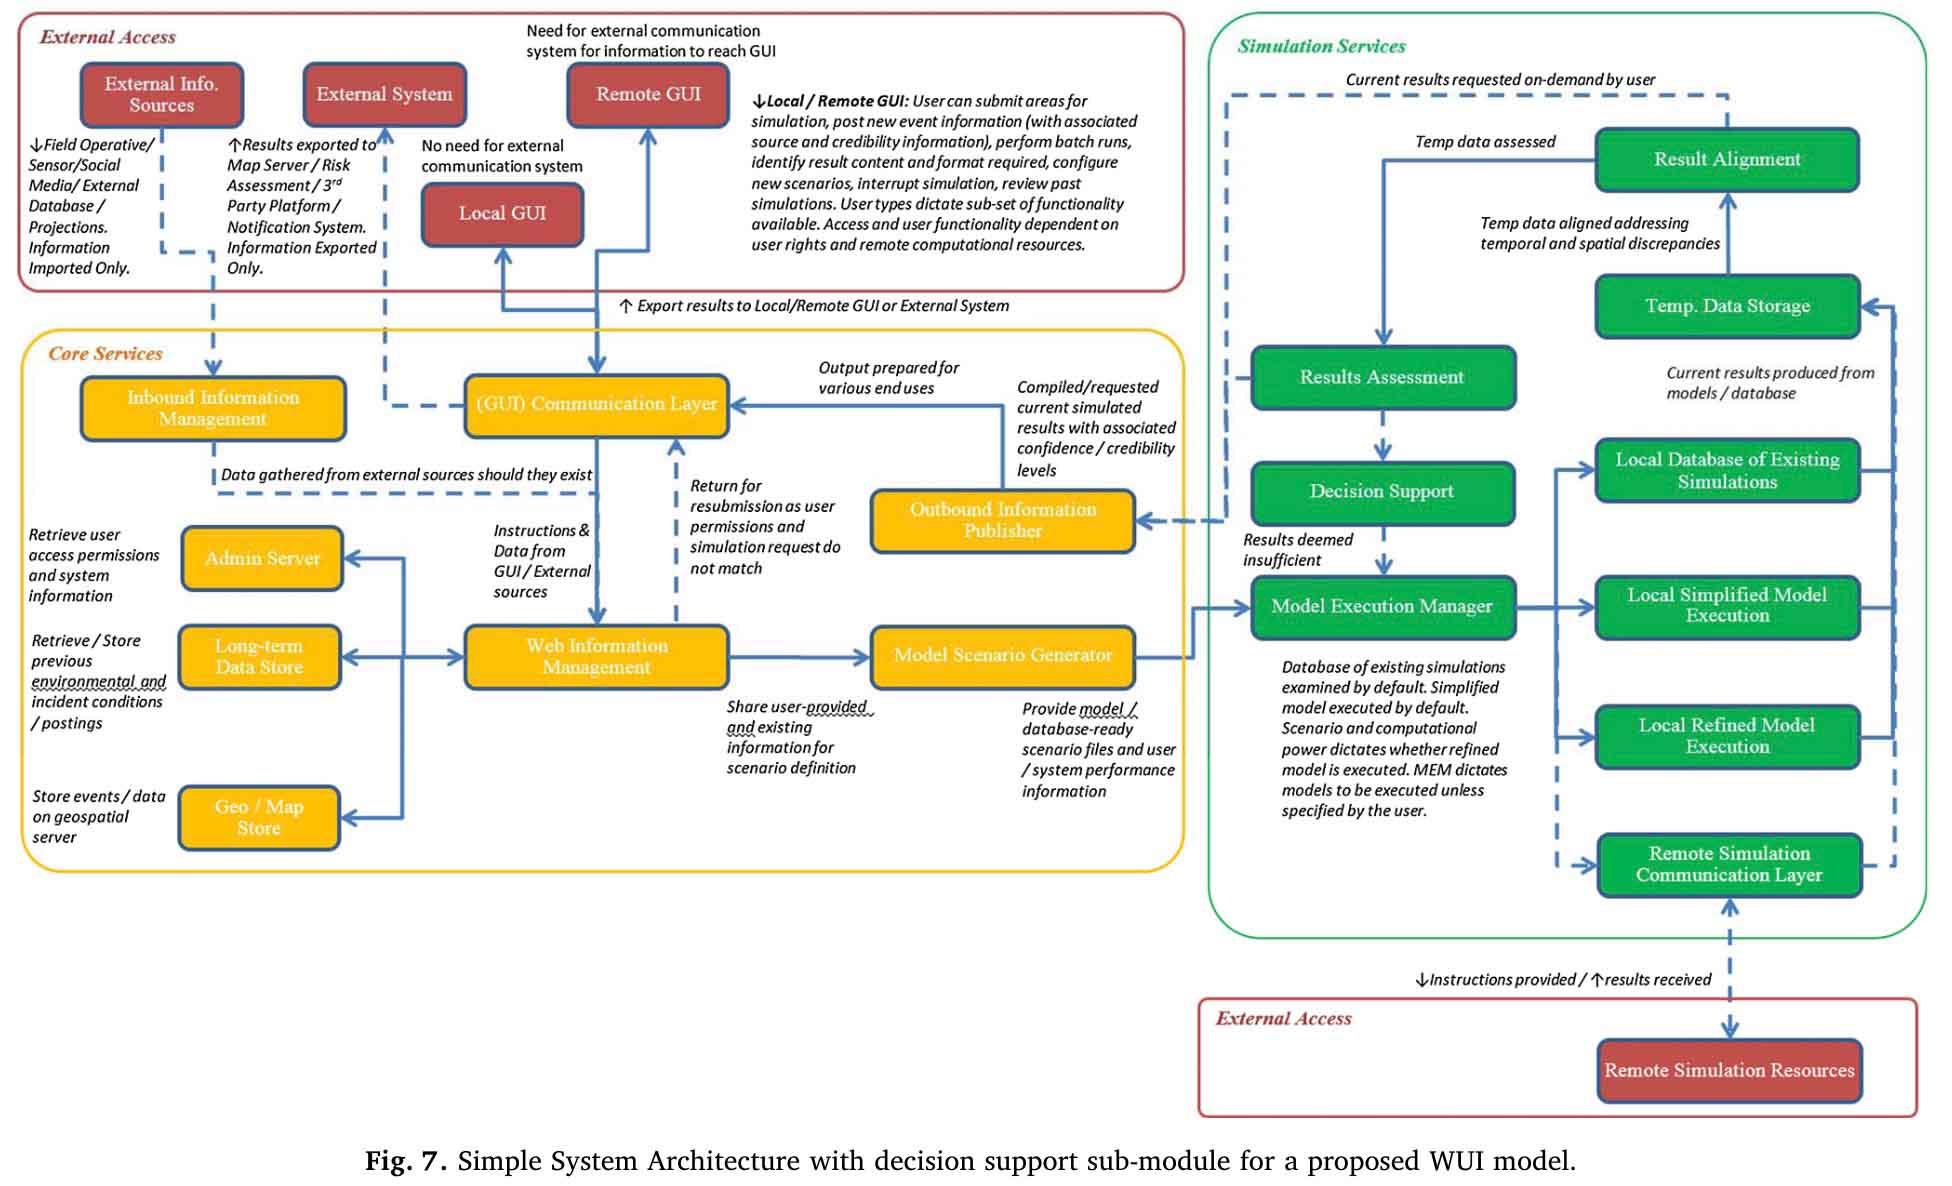
Above: a figure from the research

Previously we covered research that is underway to help wildland firefighters determine the best escape routes from a dangerous fire. A paper published in 2017 looked at the use of LiDAR to analyze the effects of slope, vegetation density, and ground surface roughness on travel rates for wildland firefighters’ escape routes. And earlier this year we reported on research that studied crowd-sourced fitness data to estimate rates of foot travel on slopes and how it could be integrated into recommendations for escape routes.

Below are excerpts from a research paper that was published July 8, 2019, written by Michael J. Campbell, Wesley G. Page, Philip E. Dennison, and Bret W. Butler. It is titled, Escape Route Index: A Spatially-Explicit Measure of Wildland Firefighter Egress Capacity. Link to the entire document.

From the Abstract

A previously published, crowd-sourced relationship between slope and travel rate was used to account for terrain, while vegetation was accounted for by using land cover to adjust travel rates based on factors from the Wildland Fire Decision Support System (WFDSS). Land cover was found to have a stronger impact on ERI values than slope. We also modeled Escape Route Index (ERI) values for several recent wildland firefighter entrapments to assess the degree to which landscape conditions may have contributed to these events, finding that ERI values were generally low from the crews’ evacuation starting points.

From the Conclusions

In this paper, we have introduced a new metric for assessing and mapping egress capacity, or the degree to which one can evacuate from a given location, on a broad, spatial scale based on existing landscape conditions. ERI is not a single metric, but a suite of four spatially-explicit metrics that define the relative travel impedance caused by terrain and land cover faced by a fire crew, should that fire crew need to evacuate. The intent is that this modeling technique will be employed to aid in wildland firefighter safety operations prior to engaging a fire, acting as a decision support tool. Given that the metric relies on US nationwide, publicly-available datasets, the goal is that ERI metrics would be mapped in advance of fire suppression and used to direct fire crews toward potential control locations with higher capacity for evacuation, thus reducing the potential for injurious or even fatal entrapments.

ERI does not map escape routes, per se, it highlights areas that have a greater or lesser capacity for providing efficient escape routes. Areas with high ERI values will likely have an abundance of open, easily-traversable terrain, through which many potential escape routes may exist requiring little alteration of the land cover. Conversely, areas with low ERI values possess some combination of rugged terrain and dense vegetation, thus making the designation of suitable escape routes difficult or even impossible.

Researchers study and film the depths and heights of a forest fire

The scientists captured video that is mesmerizing

Forest Service fire research
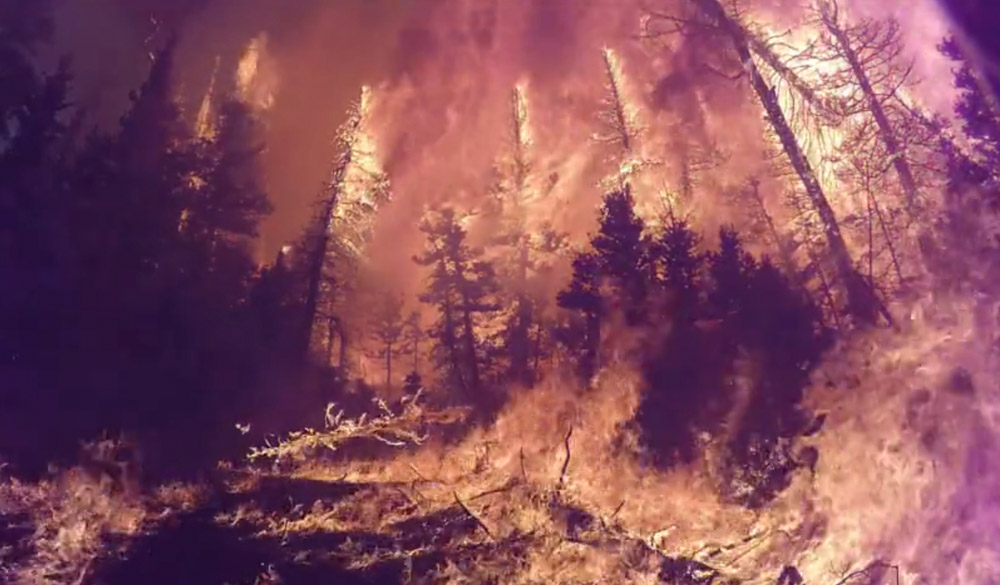
Screenshot from the USFS video below filmed in the fire.

By: Gail Keirn, Rocky Mountain Research Station-Fort Collins, Colorado; Matt Burks, Pacific Northwest Research Station-Corvallis, Oregon; John Zapell, Fishlake National Forest-Richfield, Utah
July 29th, 2019

Forest fires often reach or exceed temperatures of 2,000° Fahrenheit—that’s equivalent to one-fifth the temperature of the surface of the sun. What is the impact of such high temperatures on the soil and plants of our forests? And how do the intensity and heat of a wildfire impact its behavior, smoke and the surrounding weather?

Answering these questions is challenging since it is hard to predict when and where fires will occur. Therefore, USDA Forest Service scientists and others with the interagency Fire and Smoke Model Evaluation Experiment, or FASMEE, teamed up with the Fishlake National Forest Richfield Ranger District to study a prescribed fire from start to finish.

After months of planning and preparation, Fishlake National Forest fire crews ignited more than 2,000 acres of Utah forest in an effort to consume living upper canopy vegetation and initiate growth of new vegetation. This June 2019 prescribed fire was designed to restore aspen ecosystems by removing conifer trees and stimulating the regrowth of aspen.

Researchers at the Pacific Northwest Research Station and Rocky Mountain Research Station, as well as other FASMEE participants, saw the fire as a unique opportunity for study. Prior to the fire, Forest Service research experts took measurements of the forest vegetation and fuel loads. They also set up special fire-proof equipment to record and measure the heat of the fire throughout the project. Embedded below is a video recorded during the burn.

Forest Service fire research
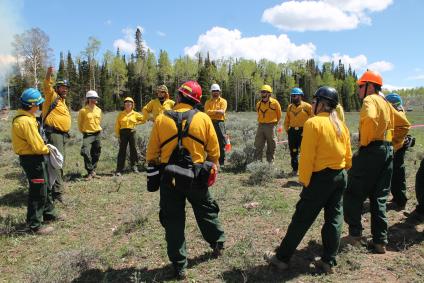
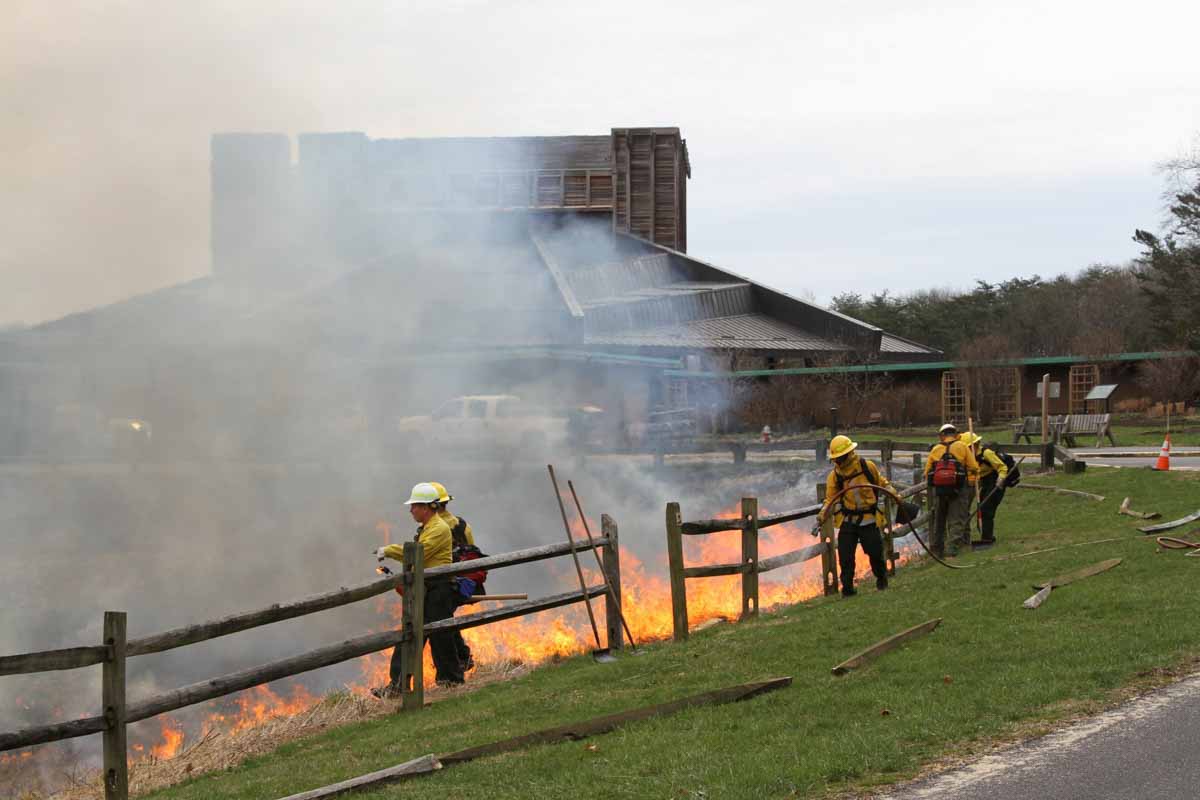
Researchers prepare for the start of a prescribed fire at Fishlake National Forest. More than 40 scientists from multiple agencies participated in the effort, gathering a variety of data on the fire itself and its impacts. USDA Forest Service photo.

During the fire, scientists used LiDAR, radar, aircraft and satellite imagery, weather and atmospheric measurements, and ground monitoring to study the fuel (dead materials) consumed, fire behavior and the fire’s impact on living vegetation. Scientists will continue to monitor the area to determine how vegetation recovers after fire.

“More than 40 scientists from multiple agencies participated in the effort, gathering a variety of data on the fire itself and its impacts,” said Pacific Northwest research forester Roger Ottmar, one of the lead scientists for the project. “The data is invaluable to our efforts to predict fire behavior, smoke impacts and the short- and long-term effects of extreme fires.”

Over the next several months, scientists will gather more data as the landscape recovers, comparing burn severity maps generated from remote sensors with observed plant regrowth. Other data from the fire is already being used to validate and improve models that predict fire and smoke severity, as well as to improve firefighter safety standards and guidelines.

Building upon this success, experts are planning a similar project for later this fall to continue studying and learning about fire.

Thanks and a tip of the hat go out to Rick. Typos or errors, report them HERE.

Researchers evaluate connection between California wildfires and human-caused climate change

A group of seven scientists published a paper last month that looks at the connection between California wildfires and human-caused climate change, titled Observed Impacts of Anthropogenic Climate Change on Wildfire in California. One of their main conclusions was that climate warming dries the atmosphere which in turn dries fuels, promoting forest fires in the summer.

Here is the abstract:

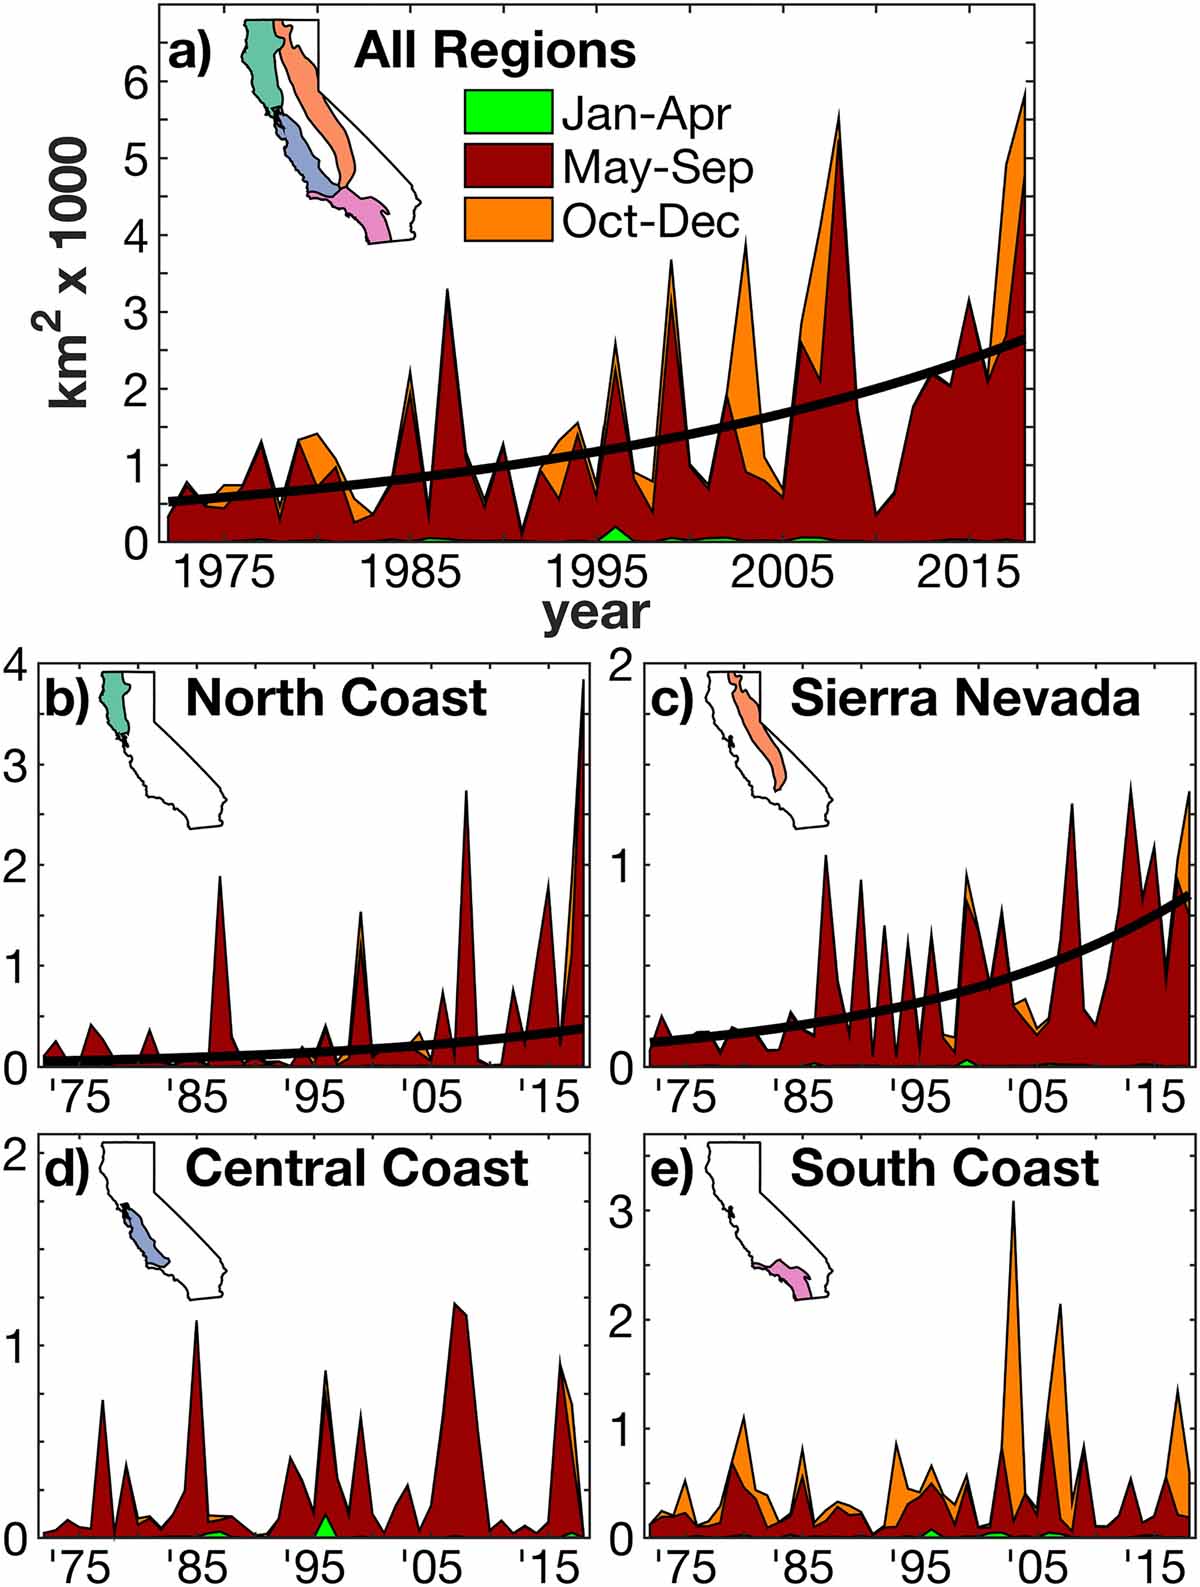
“Recent fire seasons have fueled intense speculation regarding the effect of anthropogenic climate change on wildfire in western North America and especially in California. During 1972–2018, California experienced a fivefold increase in annual burned area, mainly due to more than an eightfold increase in summer forest‐fire extent. Increased summer forest‐fire area very likely occurred due to increased atmospheric aridity caused by warming. Since the early 1970s, warm‐season days warmed by approximately 1.4 °C as part of a centennial warming trend, significantly increasing the atmospheric vapor pressure deficit (VPD). These trends are consistent with anthropogenic trends simulated by climate models. The response of summer forest‐fire area to VPD is exponential, meaning that warming has grown increasingly impactful.

“Robust interannual relationships between VPD and summer forest‐fire area strongly suggest that nearly all of the increase in summer forest‐fire area during 1972–2018 was driven by increased VPD. Climate change effects on summer wildfire were less evident in nonforested lands. In fall, wind events and delayed onset of winter precipitation are the dominant promoters of wildfire. While these variables did not change much over the past century, background warming and consequent fuel drying is increasingly enhancing the potential for large fall wildfires. Among the many processes important to California’s diverse fire regimes, warming‐driven fuel drying is the clearest link between anthropogenic climate change and increased California wildfire activity to date.”

An illustration from the paper:

Climate change California wildfires
Seasonal and annual burned areas in California for 1972–2018. (a) Total burned area in the four regions of focus: (b) North Coast, (c) Sierra Nevada, (d) Central Coast, and (e) South Coast. Annual burned area is decomposed into that which occurred in January–April (green), May–September (red), and October–December (orange). Significant (p < 0.05) trends are shown as bold black curves.

Below is an excerpt from the paper:

“In this study we evaluated the various possible links between anthropogenic climate change and observed changes in California wildfire activity across seasons, regions, and land cover types since the early 1970s. The clearest link between California wildfire and anthropogenic climate change thus far has been via warming‐driven increases in atmospheric aridity, which works to dry fuels and promote summer forest fire, particularly in the North Coast and Sierra Nevada regions. Warming has been far less influential on summer wildfire in nonforest areas. In fall, the drivers of wildfire are particularly complex, but warming does appear to enhance the probability of large fall wildfires such as those in 2017 and 2018, and this effect is likely to grow in the coming decades.

“Importantly, the effects of anthropogenic warming on California wildfire thus far have arisen from what may someday be viewed as a relatively small amount of warming. According to climate models, anthropogenic warming since the late 1800s has increased the atmospheric vapor‐pressure deficit by approximately 10%, and this increase is projected to double by the 2060s. Given the exponential response of California burned area to aridity, the influence of anthropogenic warming on wildfire activity over the next few decades will likely be larger than the observed influence thus far where fuel abundance is not limiting.”

Citation:
Observed Impacts of Anthropogenic Climate Change on Wildfire in California.
A. Park Williams John T. Abatzoglou Alexander Gershunov Janin Guzman‐Morales Daniel A. Bishop Jennifer K. Balch Dennis P. Lettenmaier
First published: 15 July 2019 https://doi.org/10.1029/2019EF001210

Planning evacuations using dynamic fire vulnerability mapping

satellite photo Camp Fire Paradise California
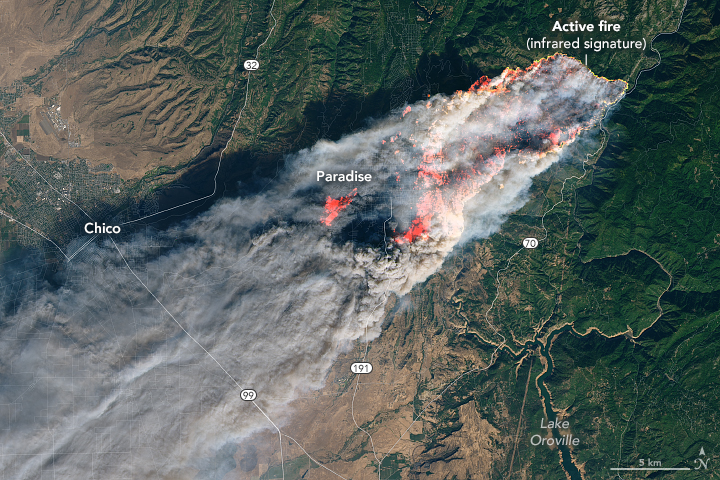
Camp Fire as seen from NASA Operational Land Imager on Landsat 8 at 10:45 PST November 8, 2018. The photo, enhanced with infrared imagery, was taken about 4 hours and 15 minutes after the fire started.

In the last three years examples of wildfires in North America that have caused massive evacuations, fatalities, and structures destroyed include:

City officials in Paradise had an evacuation plan in place and had even conducted a drill, but the plan assumed a specific fire situation that would allow time for sections of the city to evacuate, one area at at time. The Camp Fire, driven by strong winds, hit the community so quickly that the entire city had to evacuate immediately, causing the limited and low volume evacuation routes to become clogged. A situation like that with very little advance notice would overwhelm many cities, especially if the availability and capacity of routes can’t come close to handling the traffic.

Managers can use computer models to predict the spread of fires, and there are also models that can estimate how much time it would take to evacuate people in vehicles or on foot. But these models have not been integrated to determine how changes in fire behavior would affect evacuation capability and plans.

A linked fire behavior and evacuation model could have variable inputs for weather, fuels, and topography as well as an assortment of evacuation alternatives that could inform planners about existing and proposed designs.

An integrated modeling system or simulator for dynamic fire vulnerability mapping does not exist, but researchers have laid out specifications and a framework for building one. Their recommendations are detailed in a paper published in Safety Science titled, “An open physics framework for modelling wildland-urban interface fire evacuations.”

dynamic fire vulnerability mapping
Illustration from the researchers. Click to enlarge.

Below is the abstract from their paper:

“Fire evacuations at wildland-urban interfaces (WUI) pose a serious challenge to the emergency services, and are a global issue affecting thousands of communities around the world. This paper presents a multi-physics framework for the simulation of evacuation in WUI wildfire incidents, including three main modelling layers: wildfire, pedestrians, and traffic. Currently, these layers have been mostly modelled in isolation and there is no comprehensive model which accounts for their integration. The key features needed for system integration are identified, namely: consistent level of refinement of each layer (i.e. spatial and temporal scales) and their application (e.g. evacuation planning or emergency response), and complete data exchange. Timelines of WUI fire events are analysed using an approach similar to building fire engineering (available vs. required safe egress times for WUI fires, i.e. WASET/WRSET). The proposed framework allows for a paradigm shift from current wildfire risk assessment and mapping tools towards dynamic fire vulnerability mapping. This is the assessment of spatial and temporal vulnerabilities based on the wildfire threat evolution along with variables related to the infrastructure, population and network characteristics. This framework allows for the integration of the three main modelling layers affecting WUI fire evacuation and aims at improving the safety of WUI communities by minimising the consequences of wildfire evacuations.”

Authors of the paper: Enrico Ronchi, Steven M.V. Gwynne, Guillermo Rein, Paolo Intini, and Rahul Wadhwani.

Researchers find prescribed fire smoke to be less harmful than that from wildfires

Therefore, prescribed fires to protect communities can protect residents in more ways than one

Wolf Trap National park prescribed fire
Prescribed fire at Wolf Trap National Park, April, 2018. NPS photo by Nathan King.

Researchers studying the effects of smoke on children found prescribed fire smoke to be less harmful than smoke from wildfires. The Stanford University study looked at three groups of children:

  • Those who were exposed to smoke from a prescribed fire;
  • Children exposed to smoke from a wildfire in which no structures burned; and,
  • Children that were not exposed to smoke.

Sometimes fire personnel refer to a prescribed fire as “good fire”. Now they may call smoke from a planned burn as “good smoke”. A way to look at this research is that removing hazardous fuels near a community is a way to reduce the threat of a wildfire spreading into the town and burning structures or entrapping and killing people. And, removing the fuels with good fire rather than allowing a wildfire to burn the same area, exposes residents to less harmful smoke. For fire-prone areas, it is not IF it burns, it’s WHEN. Do you want your smoke now under controlled conditions or later, possibly under extreme conditions?

From Stanford University:


…The study was published May 30 in the European Journal of Allergy and Clinical Immunology. It was conducted in Fresno, California, a city with high air pollution levels due to its topography and other sources, including traffic and agriculture.

“This study suggests that exposure to wildfire smoke is detrimental above and beyond poor air quality,” said the lead author, Mary Prunicki, MD, PhD, an instructor of medicine.

The study’s senior author is Kari Nadeau, MD, PhD, professor of medicine and of pediatrics and director of the Sean N. Parker Center for Allergy & Asthma Research at Stanford.

Native Americans traditionally used controlled burns to manage California’s forests, but throughout the early 20thcentury, wildfires were widely suppressed. This began to change in the 1960s and 1970s, when scientists recognized fire as a normal part of forest ecology. Recent wildfires have brought more attention to the possible benefits of prescribed burns as a way to reduce fuel levels and wildfire risk, but not everyone is enthusiastic.

Opposition to controlled burns
“We know that there’s some public opposition to doing prescribed burning,” Prunicki said. “It’s our feeling that prescribed burning, because it’s so controlled, may expose people to fewer health effects than wildfires.” Prescribed burns are of lower intensity and are permitted only when weather conditions allow the fire to be contained.

In the study, the researchers compared blood samples from three groups of children, all of whom were 7 or 8 years old. One group of 32 children had been exposed to smoke from a 553-acre prescribed burn that occurred in March 2015; a second group of 36 children had been exposed to smoke from a 415-acre wildfire in September 2015. Both fires were about 70 miles away from Fresno, and blood samples were collected from the children within three months of each fire.

The study also included blood samples from a control group of 18 children who lived in the San Francisco Bay Area and had not been exposed to wildfire or prescribed-burn smoke.

The researchers measured air pollution levels recorded at four monitoring stations in Fresno and estimated pollution levels at the children’s homes during the fires based on how far they lived from the stations.

Pollutant exposures were higher in the wildfire group compared to the prescribed-burn group.  The air pollutants measured included nitrogen dioxide, polycyclic aromatic hydrocarbons, elemental carbon, carbon monoxide and particulate matter.

Wildfire smoke exposure was associated with lower blood levels of type-1 T helper cells, a group of immune cells that are involved in the immune response. Among children exposed to wildfire smoke, the researchers also saw increased methylation of the Foxp3 gene, indicating reduced activity of this gene, which is broadly involved in modulating allergic and other immune responses. The finding of greater Foxp3 methylation is congruent with earlier studies of the effects of air pollution on the immune system, Prunicki noted.

Significance of particulate matter
One important aspect of the study was that the September 2015 wildfire was confined to forested areas and did not burn any structures.

“Particulate matter from wildfires is different from region to region and depends on what is burning,” Prunicki said. “When a wildfire is going through a town, there are a lot of concerns about what happens to the chemicals in people’s homes and cars when they go up in flames.” Smoke from wildfires that burn inhabited areas almost certainly has worse health effects than those found in the current study, she said.

The researchers plan to conduct larger, more detailed studies of the effects of wildfire smoke on health. They will be enrolling healthy people in a trial at Stanford later this summer to collect baseline data from blood samples. When future wildfires affect Bay Area air quality, the participants will be asked to provide follow-up blood samples.

The scientists also plan to research the health effects of using home air purifiers during wildfires, as well as measure the protection offered by N95 masks, with the aim of developing recommendations for when masks should be used by different populations, such as healthy adults, elderly people, children and people with chronic illnesses.

The study’s other Stanford co-authors are biostatistician Justin Lee; life science researcher Xiaoying Zhou, PhD; Francois Haddad, MD, clinical associate professor of medicine; and Joseph Wu, MD, PhD, professor of medicine and of radiology.

New 3D fuel modeling helps predict fire behavior

Combining aerial and terrestrial LIDAR data with new 3D field sampling

By Diane Banegas, Research and Development, U.S. Forest Service

Land managers have a new tool in their firefighting arsenals that models forest fuels in three dimensions. These 3D fuel models have the potential to make firefighting and the management of controlled burns safer and less costly while helping to protect valuable natural resources.

The 3D fuels modeling technique will benefit land managers by allowing firefighters to develop better strategies and helping predict future fire behavior. It was recently tested at Eglin Air Force Base in Florida.

3-d fuels vegetation wildfire
New 3D fuel modeling techniques help land managers predict future fire behavior. Here, Louise Loudermilk (right) and Christie Hawley (left) collect 3D fuels in the field. Photo courtesy: Susan Prichard, University of Washington.

Managers will be able to input 3D fuels from this research into next-generation fire behavior models. This will allow them to test different ignition patterns for a prescribed burn to see how the resulting fire behaves in 3D.

Running 3D simulations can help firefighting teams develop strategies to manage or extinguish future fires as safely and economically as possible.

“These fire models can output various scenarios of fire behavior that help inform quick management decision making,” said Louise Loudermilk, a research ecologist at the USDA Forest Service’s Southern Research Station. The model can also give “burn bosses” choices on selecting the safest approach to meet management and ecological controlled burning objectives while better predicting smoke conditions.

“This work represents a new era in fuels research because it links fuel ecology with fire behavior. In fire behavior models, fuels traditionally are overgeneralized and have been unable to represent how fuels predict fire behavior. Now fuels can be represented dynamically in three dimensions,” Loudermilk said. “This advancement, which has taken over 10 years to achieve, is like going from a board game to a realistic video game.”

3-d fuels vegetation wildfire
Louise Loudermilk ignited a prescribed fire with a drip torch for management and ecological objectives. A new 3D fuel model can help make the management of controlled burns safer and less costly. USDA Forest Service photo by Christie Hawley.

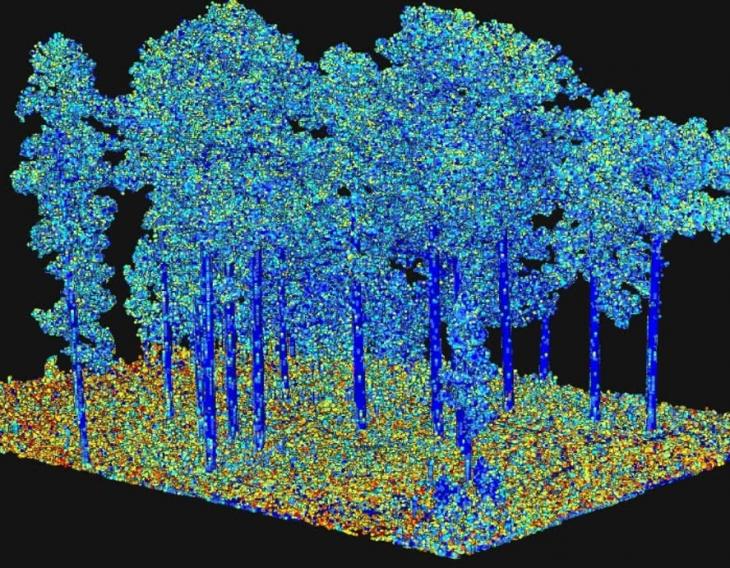
The modeling technique combines aerial and terrestrial LIDAR data with new 3D field sampling, historical data about when an area last burned and simulation modeling to provide 3D fuel characterization at multiple scales. Data collected from a landscape of interest includes vegetation type, fuel mass and fuel volume, all represented in 3D.

Loudermilk co-authored a research paper about a new method of field sampling used for this modeling technique. “The method works equally well across small or large landscapes,” she said. “Our goal is to provide big data collections that will one day be downloadable for anyone to use.” She also contributed to a book chapter about the 3D modeling technique and the importance of fuels research. A related paper in Forest Ecology and Management explains how the status and trends of plant diversity can be monitored at a landscape-scale, information valuable for 3D fuels monitoring.

Ultimately, extensive 3D data collected on fuels will be available for landscapes across the United States. Any land manager will be able to select the data for their area and run 3D fire simulations for educational or fire management purposes.

The success of these projects has been dependent on Loudermilk’s extensive network of federal, state and private organization collaborator

3-d model wildfire fuels
Output from processing of terrestrial laser scanning data, representing an important fuel characteristic “surface area” as illustrated by the different colors. This is input to next-generation fire behavior models. Image courtesy Eric Rowell, Tall Timbers Research Station.